The 4th Deadly Sin –
By: Larry Walker, Jr. –
Definition of Lazy – “encouraging inactivity or indolence” –
The Nixon Shock was a series of economic measures taken by U.S. President Richard Nixon in 1972, which included unilaterally cancelling the direct convertibility of the United States dollar to gold and essentially ending the existing Bretton Woods system of international financial exchange. However, it was not until March of 1976 when the world’s major currencies began floating. It is notable that what cost $1.00 in 1976, now costs $3.95, and what costs $1.00 today, cost only $0.25 in 1976, as annual inflation over the period averaged 4.00%.
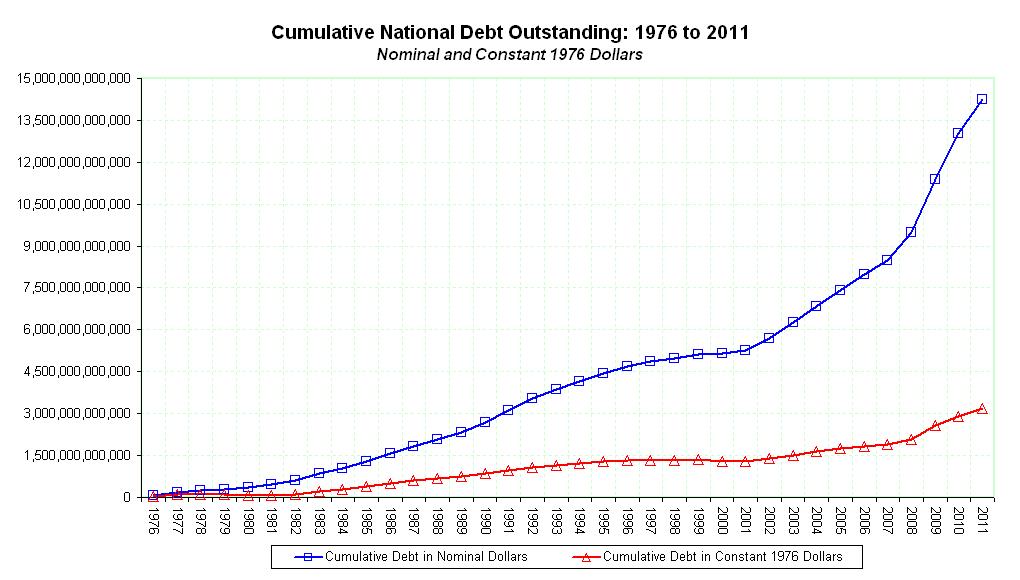
Meanwhile, since 1976, the U.S. National Debt has grown from $620.4 billion to $15,039.4 billion, in nominal dollars (as of November 17, 2011). So the questions today are as follows: How much of the national debt is attributable to a declining dollar? And, does anyone really care about the looming debt implosion?
Measuring the National Debt in 2011 Dollars
At the close of fiscal year 1976, the U.S. National Debt stood at $620.4 billion. Converting this to 2011 dollars, would have made it equivalent to $2,450.1 billion. So it took the United States 186 fiscal years, from 1791 to 1976, to accumulate today’s equivalent of $2,450.1 billion in debt. This averages out to around $13 billion per year, in today’s dollars, over the entire 186 year period. In contrast, over the last 4 fiscal years, the national debt has grown by a total of $5,006.9 billion, when measured in 2011 dollars. This averages out to borrowing of $1,251.7 billion per year, over the last 4 fiscal years.
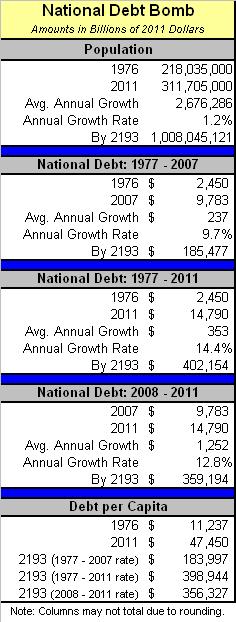
Per NationMaster.com, in 1976, the U.S. population stood at 218.0 million. By 2011 the population had increased to 311.7 million, representing an average annual growth rate of 1.2%. At the current rate of growth, the population will reach 1,008 million by the year 2193, 186 years from 2007.
From 1977 through fiscal year 2007, the national debt grew from $2,450 billion to $9,783 billion (in 2011 dollars). That’s an increase of $237 billion per year, or an average annual growth rate of 9.7%. On that trajectory, the debt would reach $185.5 trillion by the year 2193.
From 1977 through fiscal year 2011, the national debt grew from $2,450 billion to $14,790 billion (in 2011 dollars). That’s an increase of $353 billion per year, or an average annual growth rate of 14.4%. On this trajectory, the debt would reach $402.2 trillion by the year 2193.
In fiscal years 2008 through 2011, the national debt grew from $9,783 billion to $14,790 billion (in 2011 dollars). This represents an increase of $1,252 billion per year, or an average annual growth rate of 12.8%. Since the growth rate has been slightly lower over the last four years, as compared to 1977 to 2011, on its current trajectory, the national debt will reach $359.2 trillion by the year 2193.
On a per capita basis, the national debt was $11,237 in 1976 as compared to $47,450 at the end of fiscal year 2011 (in 2011 dollars). Based on its 1977 to 2007 growth rate, the debt would reach $183,997 per capita by the year 2193. At its 1977 to 2011 growth rate, the debt would reach $398,944 per capita by the year 2193. However, at the rate of growth since the end of 2007, the debt will reach $356,327 per capita by the year 2193.
To summarize, measuring in 2011 dollars, the national debt grew by an average of $13 billion per year over the 186 year period ending in 1976, and over the last four fiscal years it has increased at an average of $1,252 billion per year. Putting this into historical context, as compared to pre-1977 borrowing, the federal government is presently incurring the equivalent of 96 years of debt in each new fiscal year.
Another way of looking at this is that since the debt grew from $2,450.1 billion in 1976, to $14,790.3 billion in 2011, it has grown by $12,340.2 billion over the last 35 years, or by an average of $352.6 billion per year (in 2011 dollars). So because since 1976 we have borrowed an average of $352.6 billion per year, versus an average of $13 billion pre-1977, it may be stated that, the United States is currently borrowing at an annual rate which is 2,612.3% higher than its pre-1977 average.
And thanks to the Federal Reserve, what cost $0.25 in 1976, now costs $1.00. So since everything costs about 400% more than it did in 1976, in real terms, government borrowing is only off target by 2,212.3% from its pre-1977 level. Therefore, although the declining dollar is partially responsible for the increased borrowing, it only represents about 15.3% of the problem.
Debt to GDP: 1976 vs. 2011
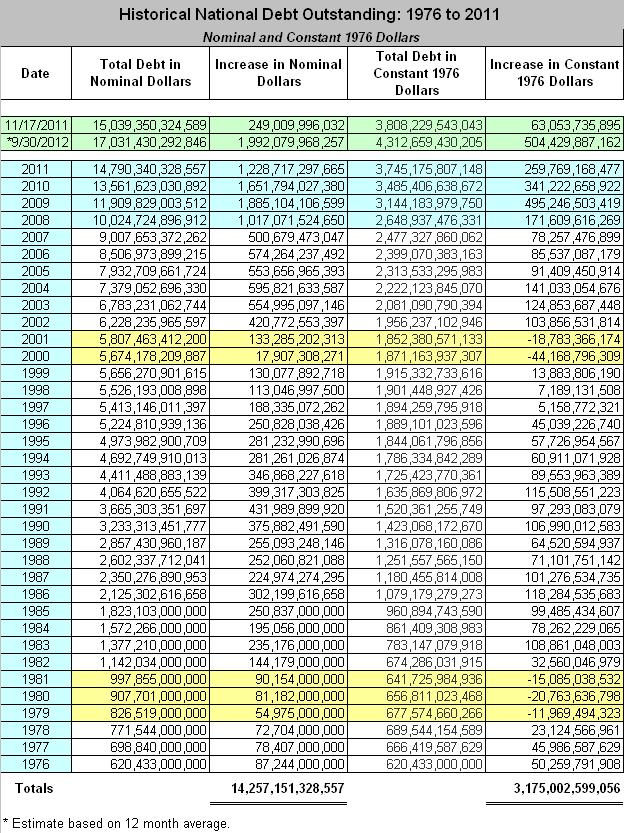
By the end of fiscal year 2011, the national debt had grown to $14,790.3 billion. Meanwhile, according to the Bureau of Economic Analysis, U.S. Gross Domestic Product stood at $15,198.6 billion, as of the end of the 3rd quarter 2011. So at the close of fiscal year 2011, our debt-to-GDP ratio was 97.3% (14,790.3 / 15,198.6). In comparison, the national debt stood at $2,450.1 billion, in 1976, and GDP was $7,205.7 (in 2011 dollars). So at the close of fiscal year 1976, our debt-to-GDP ratio was only 34.0% (2,450.1 / 7,205.7).
-
1976 Debt-to-GDP Ratio: 34.0%
-
2011 Debt-to-GDP Ratio: 97.3%
Measuring the National Debt in Constant 1976 Dollars
Since the dollar has lost 300% of its value since 1976, courtesy of the Federal Reserve, what would the national debt look like had our currency remained stable? Well, according to the table below, the national debt would be $3.8 trillion, as of 11/17/2011, in constant 1976 dollars, as opposed to its present value of $15.0 trillion. More interestingly however, there are five years where the national debt actually declined, when valued in constant 1976 dollars – 1979, 1980, 1981, 2000 and 2001.
Best 5 vs. Worst 5
When valuing the national debt in 2011 dollars, the table below shows that the worst 5 years were 2004, 2008, 2011, 2010, and 2009, with annual debt increases of $595.8, $1,017.1, $1,228.7, $1,651.8, and $1,885.1 billion, respectively. But what’s more disturbing is that, based on the first month and a half of fiscal year 2012, borrowing is currently on pace to reach $1,992.1 billion, which would exceed the fiscal year 2009 record of $1,885.1 billion, making this year, potentially, the all-time worst on record.
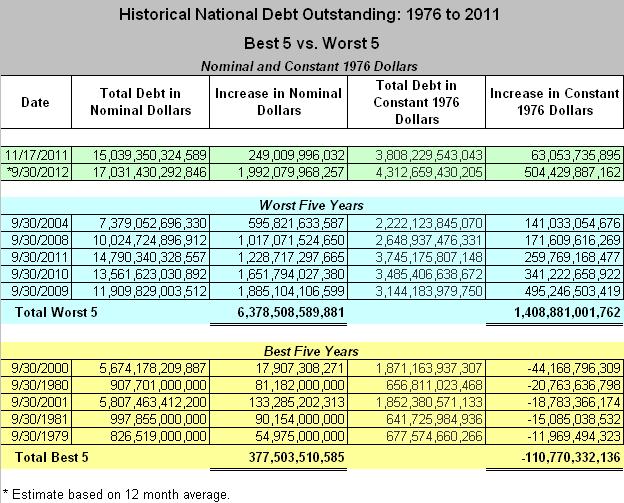
The table also shows that the best 5-years were 2000, 1980, 2001, 1981, and 1979, with annual borrowing decreases of $-44.1, $-20.7, $-18.8, $-15.1, and $-11.9 billion, when valued in constant 1976 dollars, respectively.
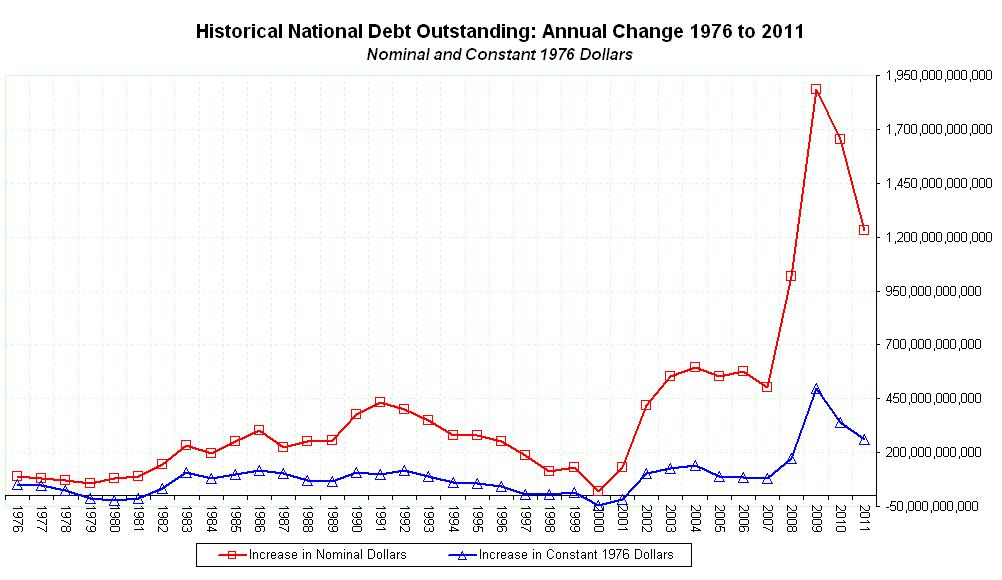
The chart above reflects the annual change in the national debt, in nominal dollars as compared to constant 1976 dollars. But it’s not like anyone really cares. Who’s paying attention anyway? I definitely have better things to do than worry about what’s going on in Washington, DC. As far as I’m concerned, wherever the buck stops is where the blame lies. So what does Obama have to say, after posting 3 of the worst 5 spending records in modern U.S. history? “…Also to put our economy on a stronger and sounder footing for the future, we’ve got to rein in our deficits and get the government to live within its means, while still making the investments that help put people to work right now and make us more competitive in the future.” So in other words, according to Obama, government needs to spend more and lower its annual deficit at the same time.
Obama recently made the admission that, “We’ve been a little bit lazy over the last couple of decades. We’ve kind of taken for granted — ‘Well, people would want to come here’ — and we aren’t out there hungry, selling America and trying to attract new businesses into America.” So pray tell, exactly who has “gotten a little bit lazy” in attracting foreign investment to America? It looks to me like most of that investment is coming in to cover Obama’s own irresponsible spending, and that the only other attraction would be the lure of higher taxes, and tighter governmental regulations. Oh, and by the way, those Obama manufactured Occupy Protests aren’t exactly lending America the aura of stability either. If America has gotten “a little lazy over the last couple of decades”, she must have committed the 4th Deadly Sin over the last 3 years.
References:
Nixon Shock – http://en.wikipedia.org/wiki/Nixon_Shock
Dollar Times – Inflation Calculator – http://www.dollartimes.com/calculators/inflation.htm
U.S. Treasury – Historical Debt – http://treasurydirect.gov/govt/reports/pd/histdebt/histdebt.htm

***Why start the inflation comparisons so late? The really killer inflation started earlier – in the early 70s.***
I was just looking for the point when floating exchanges really took effect, after the “shock”. It turns out that high inflation coupled with lower deficits actually helped keep the debt in line during the best 5-years, since inflation was high at those points relative to surrounding periods. For example, annual inflation averages were as follows: 1971 – 4.4%, 1972 – 3.2%, 1973 – 6.2%, 1974 – 11.0%, 1975 – 9.1%, 1976 – 5.8%, 1977 – 6.5%, 1978 – 7.6%, 1979 – 11.3%, 1980 – 13.5%, 1981 – 10.3%. And 1979, 1980, and 1981 were three of the lowest deficit years on record. The same was true in 2000 and 2001. So there does appear to be some correlation between high inflation and lower deficits.
***I put more blame on Johnson than Nixon – the latter just bowed to the inevitable. Consider that until 1965 the dollar coin had something like 0.77 troy oz. silver.***
I don't blame Nixon, he did what he had to do.
***Just on raw silver value alone, that would make a 1964 dollar worth about $24. How's that for currency devaluation?***
So the dollar is now worth a quarter and it could be worth $24? That's pretty freaking far from okay! But either way, Washington D.C. would have, and has made a mess of things, since the currency is not the main problem, it's Washington D.C.'s addiction to spending, and especially the slothfulness of Obama.
LikeLike
Pingback: Obama’s Square Deal and Just Deserts | Black and Center