The Real November Job Loss Number Was 255,000

Joe Weisenthal Dec. 4, 2009, 2:56 PM

Source: BusinessInsider.com

Just about every time the monthly jobs numbers comes out, economic research firm TrimTabs comes out and slams the government’s methodology, usually honing in on the Birth/Death model of new businesses entering the market.

This week is no exception.

Frankly, we’re not sure what to make of their arguments. We’ve been hearing about this Birth-Death issue for a long time, but unless you believe they’re changing their methodology from month to month, then that issue only goes so far.

We welcome your thoughts.

————

TrimTabs’ Estimates 255,000 Jobs Lost in November, While BLS Reports a Decline of Only 11,000

BLS Revises September and October Results Down a Whopping 45%

Something’s Not Right in Kansas!

TrimTabs employment analysis, which uses real-time daily income tax deposits from all U.S. taxpayers to compute employment growth, estimated that the U.S. economy shed 255,000 jobs in November. This past month’s results were an improvement of only 10.2% from the 284,000 jobs lost in October.

Meanwhile, the Bureau of Labor Statistics (BLS) reported that the U.S. economy lost an astonishingly better than expected 11,000 jobs in November. In addition, the BLS revised their September and October results down a whopping 203,000 jobs, resulting in a 45% improvement over their preliminary results.

Something is not right in Kansas! Either the BLS results are wrong, our results are in error, or the truth lies somewhere in the middle.

We believe the BLS is grossly underestimating current job losses due to their flawed survey methodology. Those flaws include rigid seasonal adjustments, a mysterious birth/death adjustment, and the fact that only 40% to 60% of the BLS survey is complete by the time of the first release and subject to revision.

Seasonal adjustments are particularly problematic around the holiday season due to the large number of temporary holiday-related jobs added to payrolls in October and November which then disappear in January. In the past two months, the BLS seasonal adjustments subtracted 2.4 million jobs from the results. In January, when the seasonal adjustments are the largest of the year, the BLS will add anywhere from 2.0 to 2.3 million jobs. In our opinion, trying to glean monthly job losses numbering in the tens of thousands or even in the hundreds of thousands are lost in the enormous size of the seasonal adjustments.

In November, the BLS revised their September and October job losses down a surprising 44.5%, or 203,000 jobs. In the twelve months ending in October, the BLS revised their job loss estimates up or down by a staggering 679,000 jobs, or 13.0%. Until this past month, these revisions brought the BLS’ revised estimates to within a couple percent of TrimTabs’ original estimates.

The large divergence between the two results begs the question of what is causing the difference. While we don’t have an answer today, we will be poring over the data in an attempt to answer that question.

A comparison of TrimTabs’ employment results versus the BLS’ results from January 2008 through November 2009 is summarized below.
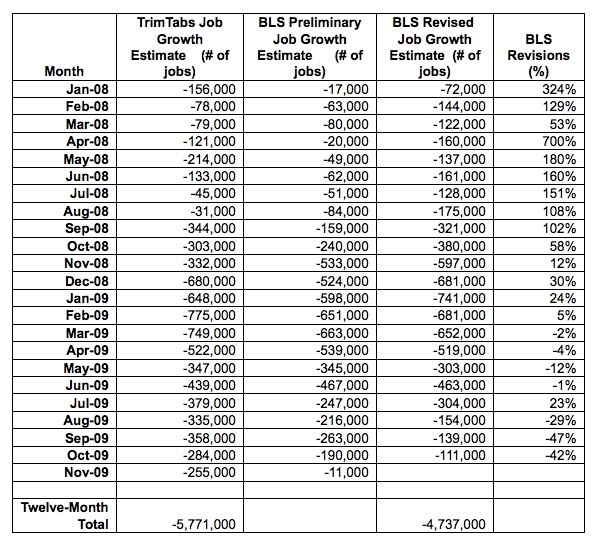
click to enlarge

Source: TrimTabs Investment Researchhttp://www.trimtabs.com/ and Bureau of Labor Statistics – http://www.bls.com/

Several other employment related data statistics support the conclusion that the labor market is not as robust as the BLS is reporting:

  • Automatic Data Processing reported on Wednesday that 169,000 jobs were lost in November.
  • The Institute of Supply Management (ISM) Non-Manufacturing Survey reported that the majority of companies surveyed were still shedding employees.
  • The ISM Manufacturing Survey reported weaker employment conditions in November.
  • Weekly unemployment claims were 457,000 in the week ended November 27, 2009. While last week’s results were below the important psychological level 500,000, the weekly claims are still uncomfortably high and point to a contracting labor market.
  • The TrimTabs Online Jobs Index reported lower online job availability in the past three weeks.
  • The Monster Employment Index declined in November.

We will have the opportunity to truth our employment model estimates at the end of January 2010 when the BLS releases its annual benchmark revisions. The BLS revisions are based on actual payroll data for March 2009. The BLS revision is then divided by twelve to correct prior month’s data back to April 2008. We also use the March 2009 revisions to adjust our model inputs and make any necessary corrections.

For a complete analysis of the current employment situation and economic conditions, refer to TrimTabs Weekly Macro Analysis published this coming Tuesday, December 8, 2009

Paying The National Debt For Dummies 2.0

Ignoring The Problem?

[updated below]

The Cost of Paying the Debt Now

By starting today, the Federal Government can pay off the National Debt in 30 years by making interest and principal payments of $699,013,323,930.52 per year (see the chart below). In Fiscal Year 2009 the government made interest payments of $383,656,592,545.78. So it would take an additional $315,356,731,384.74 in annual payments to completely extinguish the debt in 30 years. By starting now, the total cost of interest will be $8,883,038,042,900.88 (8.883 trillion), at 4%, over 30 years.

Amortization Schedule - click to enlarge

Opportunity Cost: Waiting until 2019 [updated]

If the Federal Government chooses to wait until 2019 before addressing the debt, the cost rises dramatically. If we choose to wait, our annual principal and interest payments will rise to $1,111,746,741,447.46 per year (see chart below), an increase of $412,733,417,516.94 in annual P&I payments. The total interest on the debt will rise to $20.4 trillion which is computed by adding the $14,128 billion at 4%, over 30 years plus the $6,271 billion in 4% interest only payments, over the first 10 years (shown here). Thus, the cost of waiting is an additional $11.514 trillion ($20,397 billion minus $8,883 billion) in interest.

Amortization Schedule 2.0 - click to enlarge

So What Are You Waiting For?

Are you wondering what will happen when interest rates rise? If politicians were serious about fiscal responsibility, surely they would find a way to cut government spending. All of Washington, DC is guilty. The longer you ignore a problem, the greater it becomes. America needs to stop the deficit spending ‘now’. Politicians need to start paying off the debt, and to put an end to annual budget deficits. Politicians need to stop making excuses, and quit playing political games.

References:

http://www.treasurydirect.gov/govt/reports/ir/ir_expense.htm

Paying The National Debt For Dummies

Amortization Schedule - click to enlarge

The Federal Government can pay off the National Debt in 30 years by making interest and principal payments of $699,013,323,930.52 per year. In Fiscal Year 2009 the government made interest payments of $383,656,592,545.78. So it would only take another $315,356,731,384.74 per year, or about $1,051 per capita to completely extinguish the debt. Since this will cost $8,883,038,042,900.88 in interest (at 4% over 30 years), I would suggest that you get started right away.

If you politicians were serious about fiscal responsibility, surely you could find a way to cut spending by $315,356,731,384.74 per year. I mean after all, many of you are claiming that more than that is wasted on Medicare each year.

The only condition for taking this bold step is that you stop deficit spending ‘now’. Pay the debt, end the deficits, stop making excuses, and quit playing games.

Source:

http://www.treasurydirect.gov/govt/reports/ir/ir_expense.htm

The Raw Truth: GDP vs National Debt

GDP vs National Debt – The Raw Truth

I am still mulling over the Bureau of Economic Analysis’ recent, erroneous, GDP projection after my last post Gross Domestic Product (GDP) Mumbo Jumbo. One aspect that was not addressed previously was the pace at which our National Debt is catching up to annual GDP.

The question for today is what will Gross Domestic Product need to be in 2019 in order to keep pace with the Federal Government’s ruinous spending? And based on the answer to that, at what pace must the economy grow annually?

click to enlarge

If we add the CBO’s 2010 to 2019 projected budget deficit of $7,137.0 billion to our current national debt of $12,087.3 billion, then the National Debt will total $19,224.3 billion by the year 2019. At the same time, GDP is averaging $14,198.5 billion annually. Thus, if our economy does not grow over the next 10 years, the National Debt will soon exceed GDP. [Note: GDP represents the amount that our economy can produce in a year.]

I know that the ‘hope and change’ crowd will say, “So what, It does not matter as long as the interest payments don’t exceed GDP”, or some other lame reasoning. However, I choose to look back to the days when the economy was growing at 5% per year with low unemployment. After all, surely America had some banner years in the past. The question should be, “how do we return to a more reasonable Debt-to-GDP ratio?” Not, “how far can we go before the economy breaks?”

Thus, the first scenario, below, determines the rate of growth necessary in order for GDP to match our projected debt. The second scenario determines the rate of growth needed in order to return to the 2003 debt-to-GDP ratio of 62.8%. Finally scenario three simply states the obvious.

Scenario #1 – The Road to Nowhere

GDP must grow from $14,198.5 to $19,224.3 billion in order to equal the National Debt by 2019. In other words, GDP must increase by $5,025.8 over the ten year period. This represents an increase of 35.4% for the period. That means that GDP must grow at a rate of 3.54% per year in order to equal our National Debt by 2019. As I clarified in my last post, GDP is currently declining at the rate of 1.21% per year, so although this is achievable, we still have a ways to go on this road to nowhere.

click to enlarge

Scenario #2 – Back to 2003

In order to return to the more prosperous, albeit not the most optimal, 2003 Debt-to-GDP ratio of 62.8%, annual GDP must grow to $30,611.9 by 2019. In other words, GDP must increase by $16,413.4 billion, over 10 years, in order for the National Debt to equal 62.8% of GDP. That equals a percentage increase of 116.0% over the 10 year period. In other words GDP must grow at the rate of 11.6% per year, over the next 10 years in order to return to the 2003 Debt-to-GDP ratio.

Scenario #3 – Stop Spending Money that we don’t have.

Of course there are many possible scenarios. One common sense scenario would be to stop spending money that we don’t have. I don’t think it’s possible to grow the economy at 11.6% per year. At least I don’t see any plans from the Congress, the Senate, or Obama that would come anywhere close. In fact, their current plans do nothing to increase GDP, but rather are focused shamefully on doubling the National Debt. And you know what that means: higher taxes, and higher interest rates, leading to less economic growth.

Conclusion

GDP must grow at an annual rate of 3.54% in order to equal the National Debt by 2019, a road to nowhere. GDP must grow at an annual rate of 11.6% in order to return to the 2003 Debt-to-GDP ratio of 62.8% by 2019. Government spending needs to be cut dramatically, and immediately. Any plan that falls short of scenarios #2 and #3 is not a plan. That’s the raw truth.

Sources:

GAO FINANCIAL AUDIT Bureau of the Public Debt’s Fiscal Years 2007 – 2008

CBO Budget Projections through 2019

Treasury Direct – Historical National Debt

A Free Market Solution to Universal Health Care, Part III

by: Raymond L. Richman

Link: Trade & Taxes

In the preceding blog on this subject (11-27-09), we wrote:

“The average household can afford to be self-insured with regard to health care costs that are not cataclysmic. We can expect falls and fractures, expect to catch cold, expect to need eyeglasses and hearing aids, expect to have children, expect cavities in one’s teeth, and to need dentures, and so on. Setting aside part of their income in a health savings account at regular intervals would enable the vast majority of our citizens to pay for these “normal” expenditures out of past savings and current income.”

“What we need is insurance against catastrophic illnesses not against the easily affordable costs of relatively minor medical episodes. Were the hundreds of millions of health-care consumers to pay the full cost of their own minor health care expenditures, they would have an incentive to economize and seek-out more economical treatments. And providers would soon compete for their patronage. Competition is the force that makes a private market economy innovate and achieve constantly growing productivity.”

Critics of health savings accounts argue that this could possibly work for the rich but not for the poor. What about those in poverty? Their past savings and current income are very likely to be inadequate to pay for all ordinary non-cataclysmic health care expenditures. Some special arrangement needs to be made for them. The current solution is Medicaid which like Medicare pays for all the expenses of getting treatment subject to a small co-payment which varies from state to state. Medicaid is a state administered program and each state sets its own guidelines regarding eligibility and services.

And these costs have been exploding. As we pointed out, expenditures in the United States on health care surpassed $2.2 trillion in 2007 or about $7,400 for every man, woman, and child, and has tripled since 1990. Neither the House or the Senate Bill creates any incentives to prevent or control rising health costs. They continue to insure the consumers of Medicare and Medicaid against all medical services. The problem is how to create incentives among Medicaid participants to economize on health expenditures. How can we create HSAs for those who have little or no income?

Medicaid is administered by the states. Philip Klein, the Washington correspondent of the American Spectator, wrote recently that the Congressional Budget Office (CBO) estimated that the proposed Obama health care bills

“would add 15 million to 20 million more people to the Medicaid rolls. The cost of such an expansion ‘could vary in a broad range around $500 billion over 10 years.’ But the catch is that such an estimate is of the anticipated federal cost of the Medicaid expansion. In actuality, the federal government typically pays around 57 percent of the cost of Medicaid, while the remaining 43 percent is picked up by the states. So what’s the full cost of a Medicaid expansion at both the federal and state level?”

According to these numbers, expenditures would increase $943 billion, not counting any rise in prices resulting from increased demand for medical services and prescriptions.

Currently, many of the poor uninsured use emergency room facilities, which are alleged to be very expensive. The National Institute of Health (NIH) estimated the average cost of such a visit to be $274 compared to $88 at community clinics. It attributed the difference principally to “the higher levels of fixed cost and indirect cost seen in the emergency department.” As we wrote in the first of this series, that it is alleged that the uninsured go to hospital emergency rooms for illnesses that could be attended to by a qualified nurse, paramedic, or intern. It is asserted that this imposes huge costs on the hospitals.

If the alleged illness can be diagnosed and treated without hospitalization and expensive tests, it imposes no greater costs on the hospitals than an ordinary clinic does. The costs of maintaining and staffing emergency facilities — having specialists, and testing and operating facilities on call to diagnose and treat really serious illnesses and injuries — is expensive. But such costs are not applicable to patients who are diagnosed and treated in a fifteen-minute visit and sent home. The allocation of such expensive overhead to such patients is not justified. The marginal cost of treating minor illnesses in emergency facilities is often zero. The personnel are there on a stand-by basis and often have little or nothing to do. Those who use emergency rooms as a clinic create a costly problem only when the staff and facilities are operating at capacity. In that case, the cost of treating patients with minor health problems in the emergency room is not zero but it is not infinity either. Having a general practitioner on call – MD or nurse or paramedic – is not expensive.

And there are many general practitioners and residents on duty in every hospital in the country. Still there is a need to reimburse the hospitals. Is there a way for every user of such facilities to pay for some if not all of the hospital’s reasonable charges, thus creating an incentive to restrain exorbitant cost increases. Many states require a Medicaid co-payment if the enrollee has any regular wage income. But this does not create a sufficient incentive for the consumer of health care or the provider to economize.

What we propose is assigning each enrollee to a primary private physician, clinic, or hospital-sponsored clinic of his choice. We expect there will be competition among providers to be his primary care provider. Some pharmacies have a clinic in their stores and they may qualify as primary providers. If treatment beyond primary provider’s abilities is required, the patient will be referred to an appropriate qualified co-operating provider of such required services.

An HSA account could be created in a local bank in the name of the enrollee and a fixed amount deposited in it by HHS, perhaps, $100 per month per enrollee or by depositing a single lump sum. A family of four would have $4800 paid into the savings account in a year. The account will be charged for each care provider’s services to the household. The bank will be reimbursed by HHS for withdrawals that exceed the balance in the account. Banks can be expected to compete for such accounts. An incentive to economize on the enrollee’s part would be a provision that half of any balance in the account that remains at the end of the fiscal year will be paid to him.

We need to think anew about providing or subsidizing health care. The above is a start.

Gross Domestic Product (GDP) Mumbo Jumbo

Give me a break!

by: Larry Walker, Jr.

Worthless Government Statistics

It was just back on November 3rd when the Bureau of Economic Analysis (BEA), a division of the U.S. Commerce Department, declared that Gross Domestic Product grew at an annual rate of 3.5% during the 3rd quarter of 2009. Then on November 23rd, the Bureau declared that the revised rate of growth for the 3rd quarter was only 2.8%. The question that came to mind, right away, was: What exactly does this mean?

Click to Enlarge

First of all what it does NOT mean is that the economy grew at the rate of 2.8% during the 3rd quarter of 2009. The rate of 2.8% is derived by taking the rate of increase from the 2nd quarter to the 3rd quarter of 0.70% and assuming that this will stay constant for the next 3 quarters (0.70% times 4). Why is this a bogus way of measuring the economy?

When I open my quarterly 401K statement and it reads that my portfolio has increased by 8.0% during the recent period, I don’t automatically assume that my annual rate of return is 32.0% (8.0% times 4). No, on the contrary, I look at the past four quarters to determine my annual return. If I lost 8.0% in the previous three quarters combined, and then gained 8.0% in the most recent quarter, then I am close to breaking even. But have I broken even? No.

To demonstrate, let’s assume my portfolio was valued at $100,000 at the end of the previous fiscal year. After declining by 8.0% in the succeeding three quarters, the value had dropped to $92,000 ($100,000 times 0.92). Now, after gaining 8.0% in the most recent quarter, the value of my portfolio has increased to $99,360 ($92,000 times 1.08). You will note that I have yet to break even. I am in fact still down by 0.64% ($640 divided by $100,000) having started with $100,000 and declined to $99,360 over the past four quarters. So much for growth. Now back to GDP.

GDP has declined by 1.42% over the past four quarters

Now when it comes to GDP, a more reasonable way to look at our present rate of growth, similar to measuring an investment portfolio, is to look at the past 4 quarters. Since the BEA only publishes figures in annual terms, I will approach this by using their figures, but keep in mind that the quarterly GDP figures are shown as annual amounts (in billions).

  • 4th Quarter 2008 – $14,347.3

  • 1st Quarter 2009 – $14,178.0

  • 2nd Quarter 2009 – $14,151.2

  • 3rd Quarter 2009 – $14,266.3

Dividing the above by four, the average GDP over the past four quarters is $14,235.7 billion. The final GDP figure for all of 2008 was $14,441.4. So GDP has dropped by $205.7 billion ($14,441.4 minus $14,235.7) over the past four quarters. That equals a percentage drop of 1.42% ($205.7 divided by $14,441.4) since 2008.

GDP has declined at the rate of 1.21% since 2008

An even more accurate way to look at this is to start with the 2008 total GDP of $14,441.4 billion and to measure the decline over the next three quarters. In this respect GDP declined by 1.82% in the 1st quarter of 2009, by another 0.19% in the 2nd quarter of 2009, and then improved by 0.80% in the 3rd quarter of 2009. Overall GDP has declined by 1.21% since 2008. This is the statistic that’s most meaningful to me.

GDP has declined at the rate of 1.21% since 2008. In dollar terms that’s $175.1 billion per year in lost production in our economy. That’s the equivalent of losing 3.5 million jobs paying $50,000 per year. That’s more meaningful to me than the BEA’s mumbo jumbo.

GDP growth averaged 4.93% per year from 2003 to 2008

While we are at it, you will note on the chart above that GDP was $11,142.1 billion in 2003 and grew to $14,441.4 billion in 2008. That’s an increase of 29.6% over the six-year period, or an average of 4.93% per year. It also represents an increase of $3,299 billion in U.S. production over the period. That’s the equivalent of an increase of around 65.9 million jobs paying $50,000 per year.

So wake me up when Obama’s economy killing policies have created 65.9 million jobs, or when GDP reaches $18,490.7 billion (an increase of 29.6% from today’s level), whichever comes first, but don’t bother me with meaningless government statistics.

Sources:

http://www.bea.gov/newsreleases/national/gdp/gdpnewsrelease.htm

http://www.bea.gov/newsreleases/national/gdp/2009/xls/gdp3q09_2nd.xls

Give Me a Tax Cut, or Give Me Death!

Small Business Tax & Toil

By: Larry Walker, Jr.

I have been contemplating all the blood, sweat, and tears shed by Small Business owners such as myself. Having been in business for the past 9 years, I have come to the realization that:

  1. I am paying a hell of a lot in Taxes (and government mandated fees), and

  2. I am feeling mighty underappreciated.

The Federal Government, under the American Recovery and Reinvestment Act of 2009, chose to give a Social Security tax cut, the Making Work Pay Credit, to workers making under $75,000 per year. That’s all well and fine, but what about the Small Businesses who pay those wages? Small Business Owners have to pay double the amount of Social Security and Medicare taxes on our own pay, plus a matching amount on what we pay our employees.

As the owner of an S-Corporation, in order to write myself a paycheck I am hit with 25% in Federal Withholding Taxes, 15.3% for Social Security and Medicare (since as an owner-employee both halves come out of the same pocket), 5% for State Withholding Taxes and Federal and State Unemployment Taxes. Excluding Unemployment Taxes, I have to withhold and pay in 45.3% of my pay every month. On top of that, since I have employees, I also have to match 7.65% of their pay for Social Security and Medicare Taxes.

As a side note, I also have to pay County business license fees, Federal and State license fees, County property taxes, State Sales Taxes, Federal Excise taxes on telephone, cell phone and internet usage, interest and principal payments on a Federal SBA loan and other business debts, professional liability insurance, health insurance, matching retirement contributions, etc. … and then the actual operating expenses. When it’s all said and done, in return for my contribution to society, I get to keep about 20% of my gross income (toil). But lets just keep the focus here on Social Security, Medicare, and Income Taxes.

As an example, let’s say I have to write gross pay checks for myself and my employees of $8,000 per month. And let’s say $5,000 of that is for me, and the other $3,000 is for two employees. In order to pay myself $5,000 I have to set aside $2,265 for taxes ($5,000 * 45.3% = $2,265). In order to pay my employees $3,000 I have to set aside an extra $229.50 ($3,000 * 7.65% = $229.50) to match Social Security and Medicare.

So to summarize my gross pay started out at $5,000, but my net take home pay wound up being only just $3,117.50 (see the chart below). In the end, I have spent a total of $8,612.00. My employees took home $2,770.50, I took home $3,117.50, and the Government took home $2,724.00.

click to enlarge

When times are good and I can afford to take a full paycheck I have to fork over 45.3% of my earnings to the Government. When times are tough and I can’t afford to pay myself a full paycheck I still have to fork over 45.3% of my earnings to the Government. And when the business makes a profit, the Government will be standing there laying claim to another 30% or more of my toils (25% Federal Taxes and 5% State Taxes).

And now the Federal Government, through the Senate’s Health Care Bill, is proposing to:

  • Add an Excise Tax on Comprehensive Health Insurance Plans

  • Burden us with Employer Reporting of Health Insurance Costs on W-2 Forms

  • Hike Taxes on Health Savings Account Withdrawals by 10%

  • Raise the “Haircut” for Medical Itemized Deductions from 7.5% to 10% of AGI

(See How Does the Reid-Obama Health Bill Raise Taxes on Your Current Health Plan?).

If there is any common sense at all in Washington D.C., Congress and the President will realize that Small Businesses employ most of America, and that Small Business owners pay an unfair burden of Social Security and Medicare Taxes. And we receive nothing in return. By nothing I mean that business owners do not get double the Social Security and Medicare benefits for paying twice what the average worker pays into the system. When liberals start whining about tax cuts for the rich, perhaps they should try standing in the shoes of a small business owner. They would not last a week. They would die from their own complaining.

Do Small Business Owners deserve tax relief? You’re damned right! What can you do about it in Washington D.C.? Well, if you want Small Businesses to spend more, hire more, and stop the lay offs, then stop squeezing us.

  1. Give small business Owners an immediate tax cut of 50% of the Social Security and Medicare Taxes on the wages that they pay themselves. This is not only fair, but it would be just that simple.

  2. Or, if you really want to be fair, then give us a 50% tax cut on the Social Security and Medicare Taxes on all the wages that we have paid so far this year. It’s time to act.

Give me a tax cut, or give me death!

Obama’s Cluelessian Economics – Obamanomics

By: Larry [Update: below in red]

As economists from across the globe are grappling to find a new name for Barack Obama’s economic policies, I have beat them to the punch. Cluelessian is Obama’s new model for future economic (failures). Thus, in an effort to ensure that others do not slip and fall down into the same bottomless pit, let me help you define the difference between Free Market Economics and Cluelessian Economics.

The two most basic concepts in free market economic theory are the laws of supply and demand. Under the law of supply as prices increase the quantity of goods and services increases, as additional investment is attracted into the market. Under the law of demand as prices decrease, the quantity of goods and services demanded increases, because more consumers are able to afford these goods and services. Where supply and demand meet is at the prevailing market price.

Now when a price is set below the prevailing market price in order control prices, less investment is attracted to produce the supply. Where the price is fixed as in the graph below, the quantity demanded is higher than the quantity supplied, thus creating excess demand, better known as shortages. And shortages lead to rationing.

On Health Care Reform

Under Cluelessian Theory, the laws of supply and demand didn’t work for everyone. Thus, what is being proposed with health care reform is an increase in the number of people covered by insurance through a legal mandate (demand), without increasing the price. This is only possible under the Cluelessian Model. In fact, under the new theory demand will increase, prices will decline, supply will decline (as insurance companies go bankrupt) and higher income taxes will make up the difference.

Under Cluelessian theory you actually wind up paying more for less, but that’s all right because higher taxes don’t count towards the price of health insurance, right? Also by following the Cluelessians we can get rid of all those evil, greedy doctors and insurance companies at the same time. So under Cluelessian theory it would appear that we would actually destroy the free market system, and create not only government run health insurance, but also government doctors and hospitals.

On Climate Change

Now when it comes to making an impact on the effects of that evil, and relentless Sun, that sits in the middle of our solar system spewing out all that heat, the laws of supply and demand just don’t quite cut it. So it will be necessary to dramatically reduce the supply of electricity, coal, natural gas, and gasoline; meaning that prices will necessarily ‘skyrocket’ (a Cluelessian axiom).

Cluelessian policies will necessarily call for a dramatic decline in the demand for energy. As the supply declines and businesses begin to lay off workers and shutter plants, and as people begin to freeze to death in their homes and to die of heat stroke, the Cluelessians will compensate by _______? (I don’t think they have thought this one all the way through.)

A. Raising taxes to help those who can no longer afford their energy bills?

B. Coming up with a nifty formula to demonstrate how many human beings they saved, or how many years of life they added to Planet Earth?

On Jobs

Under Cluelessian law, a job saved (or created) is equal to giving a pay raise to existing employees. Contemporary economists thought that a job saved entailed cancelling a layoff, or recalling laid off workers; and that a job created meant hiring new employees on top of the existing workforce. However, under Cluelessian theory, whatever makes you look good counts. As we saw recently in the news, the Southwest Georgia Community Action Council was able to save 935 jobs by providing a cost of living increase for only 508 people. (See the last post: Jobs and O-bonics Interpreted).

The Cluelessians haven’t yet been able to formulate a way to actually create jobs so please check back for updates over the next three (3) years.

[Update: The Cluelessians have just stated that a key part of their plan for job creation will involve housing Guantanamo terrorism detainees in U.S. prisons. Cluelessian economists are talking to Illinois officials about buying the Thomson Correctional Center, a maximum-security prison about 150 miles west of Chicago. A limted number of the remaining 215 Guantanamo detainees would be housed there which some Cluelessians are claiming could create up to 2,000 jobs. So now we have an even better understanding of how Cluelessian policies will impact future economic and social deterioration.]

Conclusion

So in conclusion it’s not very hard to understand Cluelessian Economics. Simply throw away the idea of a free market system. Forget about the laws of supply and demand. Under this new theory the Government will take care of all of us. The Government will supply our health care, energy, and employment needs. The Government will take the place of the free market. The Government is good, and we are bad. The Government knows all. And when the Government runs out of money, then under Cluelessian law, they will make up another lie (i.e. blame Bush).

Now if you want some real answers, you should check out The Just Third Way Blog, or The Center for Economic and Social Justice. You may even want to read, Capital Homesteading for Every Citizen or Binary Economics: The New Paradigm.

Related to and inspired by John Galt at: John Galt’s Wisdom Blog

Jobs and O-bonics Interpreted

Why Take Math? So Your Ignorance Isn’t Broadcast Nationwide on the AP Wire

November 6, 2009

This is pretty funny. Or horrifying. Depends on how you want to look at it.

Several days ago, I noted on Twitter that there were a lot of “saved” jobs that weren’t saved at all but actually cost of living increases. About 24 hours after I noted this, there was an Associated Press article about that very phenomena.

Coincidence? Almost certainly. But I’ll flatter myself anyway.

But the laugh riot comes several paragraphs into the article as they look into why Southwest Georgia Community Action Council was able to save 935 jobs with a cost of living increase for only 508 people. The director of the action council said:

“she followed the guidelines the Obama administration provided. She said she multiplied the 508 employees by 1.84 — the percentage pay raise they received — and came up with 935 jobs saved.

“I would say it’s confusing at best,” she said. “But we followed the instructions we were given.”

“Confusing at best”? The multiplication of percentages is “confusing at best”? It seems obvious to me she should have multiplied 508 people by the amount the increase (.0184) and gotten 9.3. But she forgot that you have to divide the percentage by 100 before you multiply.

The fact that she had “saved” more jobs than there were people in the organization should have been a tip-off. But this is a pretty common problem with people who don’t have a very good grasp on mathematics… they don’t recognize obvious mathematical errors, they just plug in the numbers and go with whatever comes out.

And this, children, is why you pay attention at school. So you don’t get in the national news for doing something really stupid and then blame it on the instruction manual.

Via: Political Math Blog

———————————————————————————————-

My Comments:

So I take it that instead of creating or saving 1 million jobs, we only created or saved around 10,000 (after moving the decimal place two places to the left). And since we know that no jobs were actually created, what Obama really means, you have to interpret the Obonics, is that, “we lost 4.2 million jobs, and we think we would have lost 1 million more, but thankfully our $787 billion dollar stimulus program saved around 10,000″. Right?

3.5% Growth in the 3rd Quarter? No! Try 0.87%

Source: Trade and Taxes

Raymond L. Richman

The U.S. Bureau of Economic Analysis issued a misleading report when it announced October 29, 2009, that annualized Gross Domestic Product, measured in 2005 prices, increased 3.5 percent from the 2nd quarter 2009 to the 3rd Quarter of 2009. The fact is that annualized GDP in the 3rd quarter was $13,014 billion compared with $12,901 in the 2nd quarter , an increase of 0.872, less than one percent. The number, 3½ , asserted by the BEA was obtained by multiplying 0.872 by 4, in other words by extrapolating the rate of increase in the 3rd quarter for three additional future quarters, hardly a scientific way of prediction . What is worse, analysis of the data indicates no reason to expect any future growth of the economy at all.

Net private non-residential investment, the key to a growing economy, declined in the 3rd quarter. So did net exports. Exports increased but imports increased even more, resulting in a drag on the economy. Personal Consumption increased but that was due principally to a non-recurring factor, the “klunkers” rebate, a costly exercise in subsidized consumption which did more economic harm than good. We already have evidence that it was at the expense of sales in the succeeding period. Thus, it will contribute to a decline in the current quarter. And it will no doubt have a negative effect on auto repairs and maintenance expenditures. Although the administration claimed that it was intended as a stimulus to the economy, it was done at the urging of environmentalists wanting to reduce carbon emissions in the atmosphere. Personal Consumption may increase in the future but there was nothing in the 3rd quarter data to give any assurance that it will.

Personal consumption may grow if expectations about the future of the economy improve. Unfortunately, the data do not lend to the expectation of the economy’s growth. The real growth of the economy is dependent on fixed private investment. Private non-residential fixed investment fell, -1.88 percent in current dollars and -.636 percent in 2005 dollars. Multiply those by four!

The other principal contributor to economic growth is positive net exports. While exports of goods rose 4.65 percent in current dollars and 3.49 percent in 2005 dollars, imports increased faster, 6.43 percent and 3.86 percent respectively. This occurred in spite of a falling dollar which is supposed to increase exports and reduce imports. Multiply those numbers by four, too!

For years we have been warning that the growing trade deficits of the U.S. were a threat to the health of the U.S. economy. It caused the loss of millions of industrial jobs, depressed wages as the laid off industrial workers sought jobs in the service sector, and worsened the American distribution of income. It is urgent that we get trade into reasonable balance. If we succeed, the economy has a chance of recovering quickly because it would stimulate private investment , growth, and employment. These and other measures appear in our book, Trading Away Our Future (2008), which deals with the causes of and cures for the trade deficits.

The stock markets boomed on the news that GDP had grown at an annual rate of 3.5 percent. Pres. Obama and Dr. Romer, Chairwoman of the President’s Council of Economic Advisors, repeated the number. The latter should have known better. What should have been reported is that in the third quarter GDP rose, compared with the 2nd quarter, 1.06 percent in current dollars and 0.87 percent in 2005 dollars. The next day, after investors had time to read the release and the accompanying tables, the stock markets collapsed.

We have great respect for the Bureau of Economic Analysis and their statistical methods. But the extrapolation of the rate of growth into the future serves no purpose and adds nothing to the data and should be abandoned.

__________________________________________________

Link to BEA Report: http://www.bea.gov/newsreleases/national/gdp/gdpnewsrelease.htm

Note: It says, “Real gross domestic product…increased at an annual rate of 3.5 percent in the third quarter of 2009…” The use of the term Annual Rate means that GDP actually only rose by 0.87% during the 3rd Quarter of 2009. Thus, I concur. This is a shameful deception by the Obama Administration and he needs to be called on it.

It’s also debatable whether when annualizing GDP growth one should take the previous three quarters plus the current one, or as makes no sense here, take the current quarter and expand it out by three future quarters at the same rate.

I don’t see any consistency with this even with the BEA. In checking the BEA’s 2nd quarter report, for example, GDP decreased by -0.8% in the 2nd Quarter but the annualized decrease was stated as minus -1.0%, not minus -3.2% as would be apples to apples. So what’s up with that?

http://www.bea.gov/newsreleases/national/gdp/2009/gdp2q09_adv.htm