Blindsided | White House Fiscal Lunacy

Back in the Ditch

2016 GDP vs. National Debt

– By: Larry Walker, Jr. –

We will not be adding more to the national debt.” ~ Barack Obama ~

Say what? You must mean that you will not be adding more to your national debt, because I know that I certainly won’t be adding to the national debt, so you need to take the we out of that statement buddy. The real question is how are you going to pay back the trillions of dollars that you have already squandered? And here’s another riddle – What will the U.S.A.’s gross domestic product (GDP) need grow to by the year 2016 in order to keep pace with the present White House occupant’s irrationally exuberant spending spree? And based on the answer to that question, at what annual rate must our economy grow?

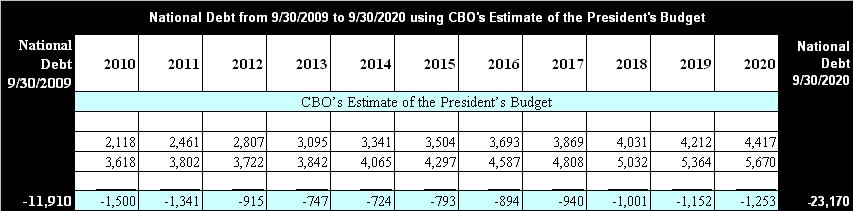
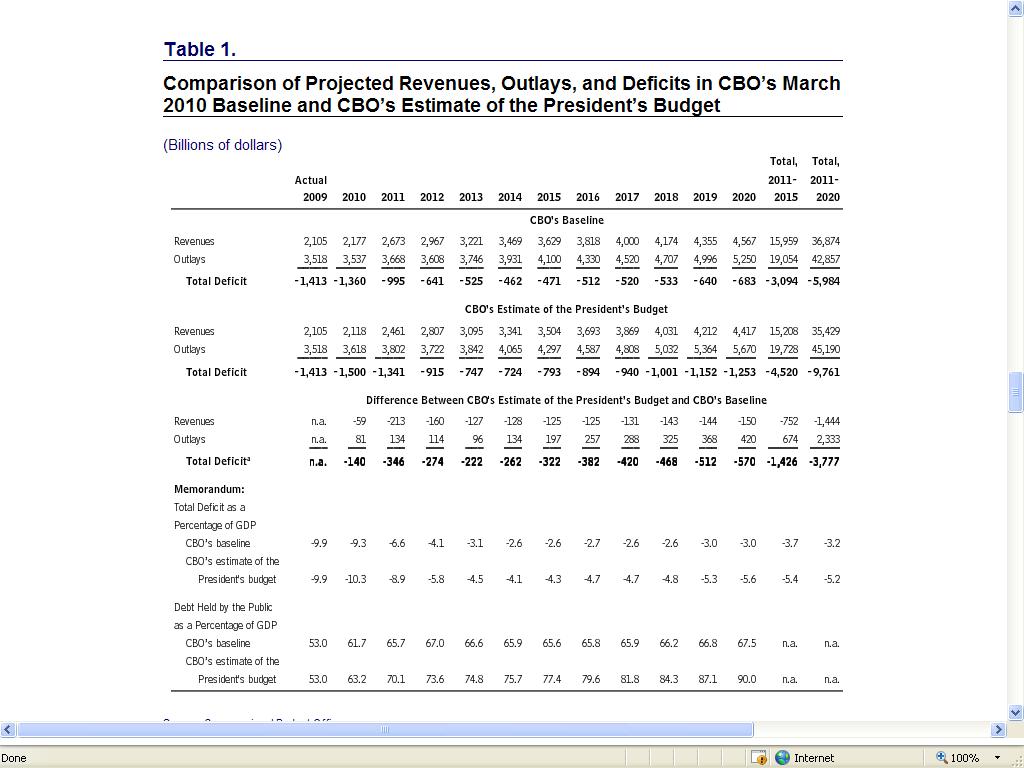
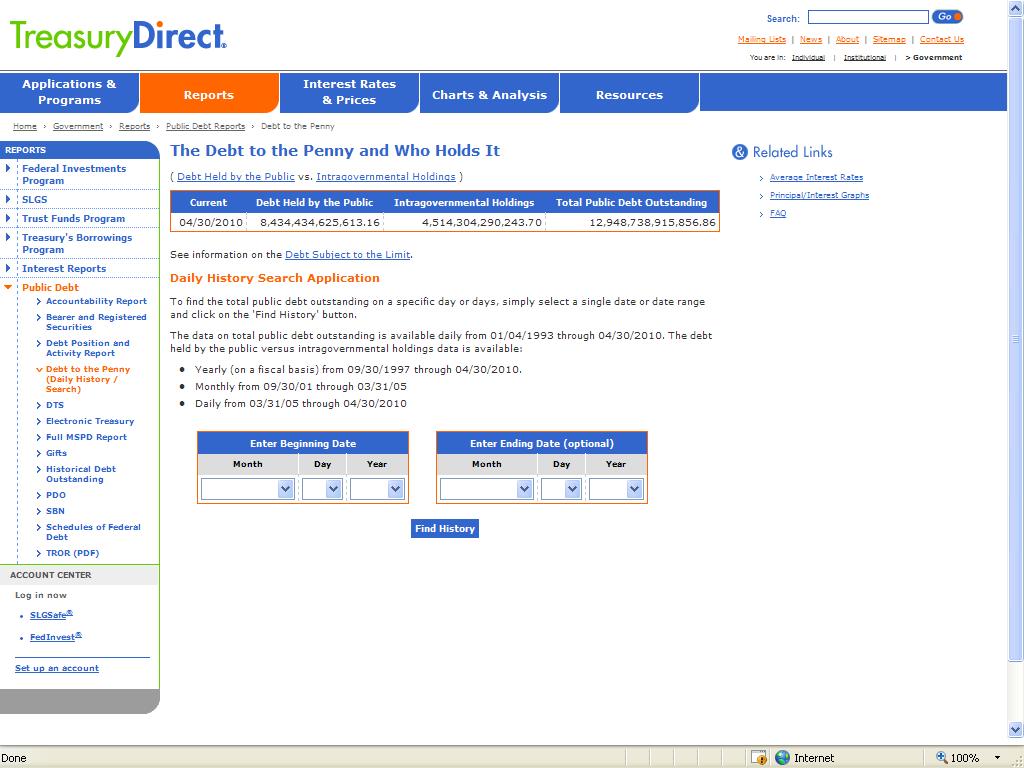
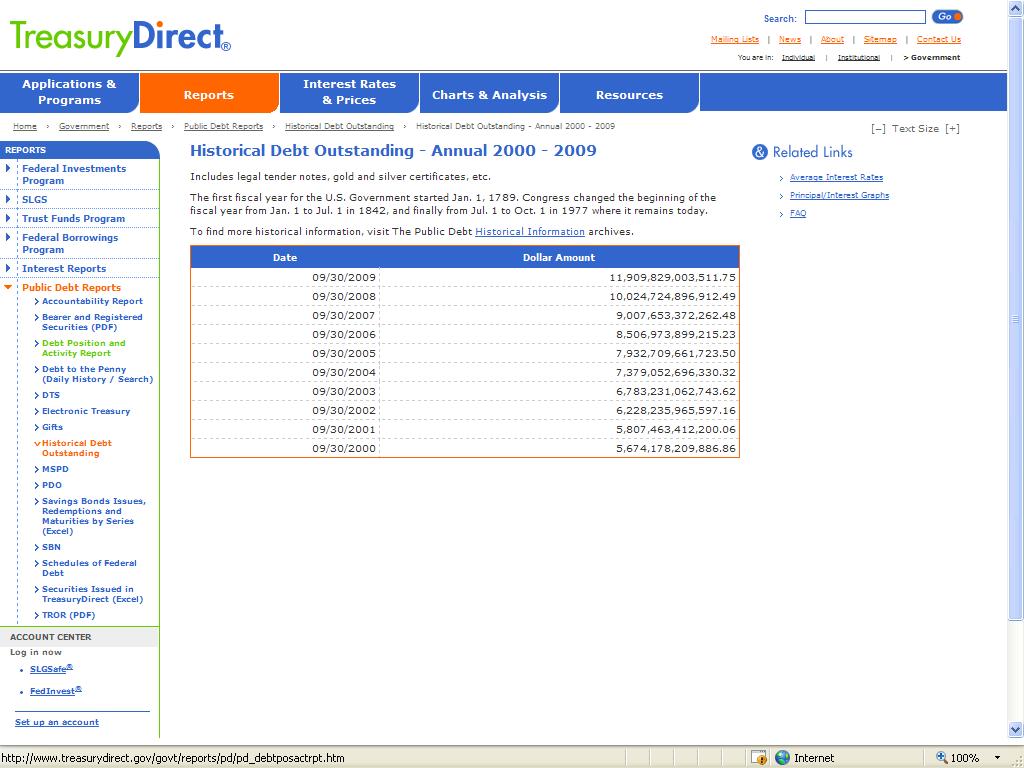
If we add the inexperienced CEO’s 2011 to 2016 projected annual budget deficits to fiscal year 2010’s ending national debt balance of $13.6 trillion, then the national debt will equal $19.0 trillion by the year 2016. And you call that “not adding more to the national debt”? So is this guy a pathological liar, or what?

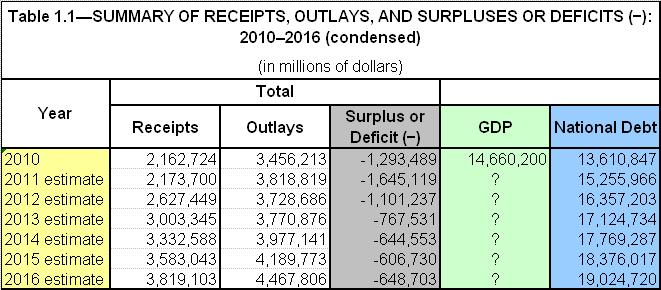
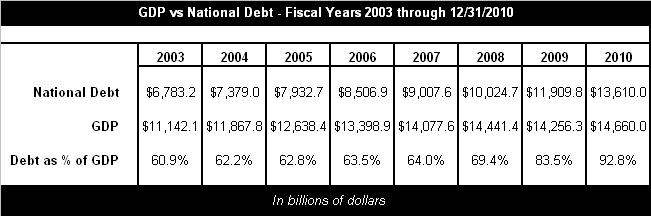
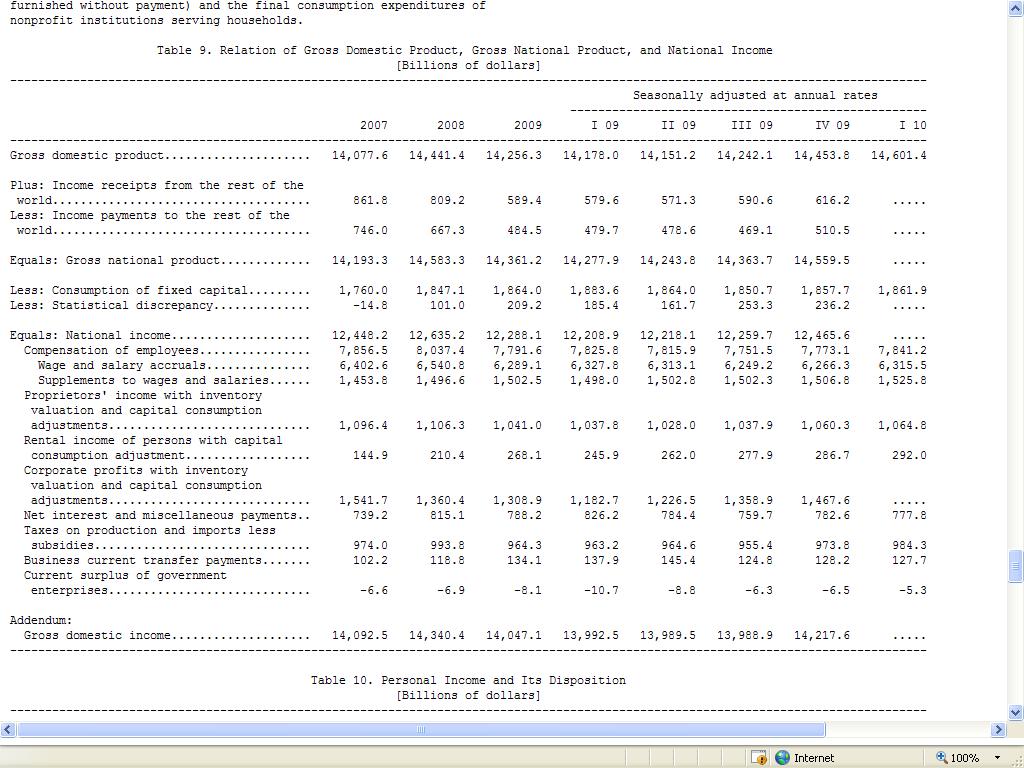
At the end of 2010, the Bureau of Economic Analysis (BEA) reported that gross domestic product (GDP) for the year was $14.6 trillion. So depending on the rate of economic growth over the next 6 years, the national debt may sooner or later exceed GDP. Although even the present White House occupant once stated that the national debt is unsustainable, the question is – as juxtaposed to what? If we take a look back to the days when our debt was sustainable, when the economy was growing at roughly 5% per year with low unemployment, such as in 2003, we will discover that the debt-to-GDP ratio back then was 60.9%. So the question is what do we need to do in order to reduce our debt-to-GDP ratio from its present level of 92.8% back down to 60.9%?

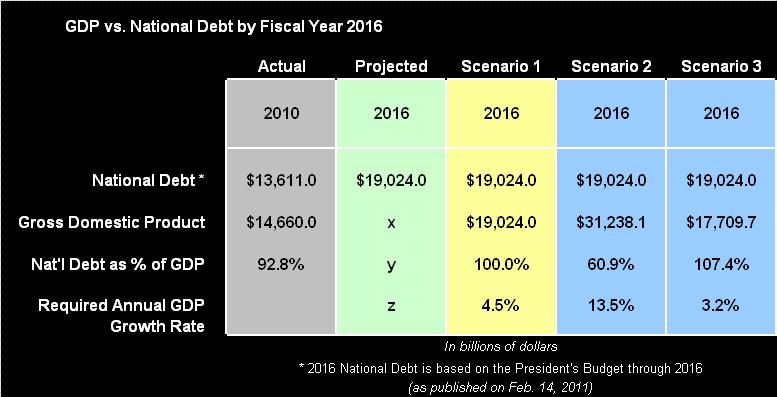
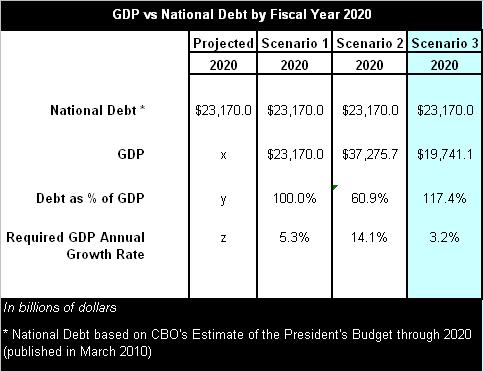
In Scenario #1 (below) we will determine the rate of economic growth necessary in order for GDP to equal our projected debt by the year 2016. In Scenario #2 we will discover the rate of economic growth needed to return to a more healthy debt-to-GDP ratio of 60.9%. Finally, in Scenario #3 we reveal what the debt-to-GDP ratio will be by 2016 if GDP maintains its present growth rate of 3.2% per annum.

Scenario #1 – The budget to nowhere

Gross domestic product must grow from $14.6 to $19.0 trillion in order to equal the National Debt by 2016. In other words, GDP must maintain an average sustained growth rate of 4.5% per year, over the next 6 years, in order to achieve a debt-to-GDP ratio of 100%. This represents ‘the budget to nowhere’. Although, the Bureau of Economic Analysis reports that GDP grew at the rate of 3.2% in the 4th quarter of 2010, as you can deduce, this will not be sufficient to reach the current White House occupant’s pitiful goal of a 100% debt-to-GDP ratio.

Scenario #2 – Back to sanity

In order to return to the more prosperous 2003 debt-to-GDP ratio of 60.9%, GDP must grow at a sustained annual rate of 13.5% over the next 6 years. How likely is this? In order to achieve such a rate of growth, our economy would need to expand at the pace of an emerging market economy, a feat which is hardly doable. This is precisely why the Debt Commission recently stated that we will never grow our way out of this fiscal disaster.

Scenario #3 – Your new reality

Finally, if GDP maintains the present annual growth rate of 3.2%, then our debt-to-GDP ratio will have reached 107.4% by 2016. Welcome to reality, and to a future of bonded labor. This doesn’t look like winning the future to me, it looks more like a donkey in a quagmire.

Conclusion

The present White House occupant’s budget plan leads to disaster. What most of us wanted to hear was a plan for paying off the debt which he alone has run up over the last two years, not more debt evasion. Face it, there is only one way out of this mess. The first thing we need to do is to derail all of this administration’s reckless spending initiatives. Secondly, government spending must be cut, slashed, and cut again. And finally, we must get this fiscally bankrupt pathological liar out of the White House, by any means necessary. By any means necessary. And as far as who will be the next POTUS; throw a dart. While I am not certain about who it will be, I definitely know who will be packing up at the end of 2012, if not sooner.

Sources:

http://www.whitehouse.gov/sites/default/files/omb/budget/fy2012/assets/hist01z1.xls

http://www.bea.gov/newsreleases/national/gdp/2011/xls/gdp4q10_adv.xls

http://www.treasurydirect.gov/NP/NPGateway

The Progressive Slide to 2020 | GDP vs. Debt

2020 GDP vs. National Debt

By: Larry Walker, Jr.

The question of the day is what will the USA’s Gross Domestic Product (GDP) need grow to by the year 2020 in order to keep pace with the Progressive’s ruinous spending? And based on the answer to that, at what annual rate should our economy be growing?

If we add the CBO’s 2010 to 2020 projected estimate of the president’s budget deficit to the current national debt of $12,948.7 billion (as of 4/30/2010), then the National Debt will total $23,170.0 billion by the year 2020.

click to enlarge

click to enlarge

click to enlarge

As of the end of the 1st quarter of 2010, based on the Bureau of Economic Analysis (BEA’s) latest preliminary estimate, GDP is averaging $14,601.4 billion annually.

click to enlarge

Depending upon the rate of growth of our economy over the next 11 years, our National Debt will exceed GDP, sooner or later. We know that even the Progressive’s say that our National Debt is unsustainable, but the question is just how unsustainable? If we take a look back to the days when our debt was sustainable and the economy was growing at roughly 5% per year with low unemployment, for example 2003, we will discover that our Debt to GDP ratio was 60.9%.

Scenario #1, below, determines the rate of growth necessary in order for GDP to match our projected debt by the year 2020. Scenario #2 determines the rate of growth needed in order to return to the 2003 debt-to-GDP ratio of 60.9%. Finally, Scenario #3 reveals what the debt-to-GDP ratio will be by 2020 if GDP maintains its current pace.

click to enlarge

Scenario #1 – The road to nowhere

GDP must grow from $14,601.4 to $23,170.0 billion in order to equal the National Debt by 2020. In other words, GDP must maintain an average sustained growth rate of 5.3% per year for the next 11 years, in order to achieve a Debt to GDP ratio of 100%. This represents ‘the road to nowhere’. Although, per the BEA, GDP grew at a rate of 3.2% in the first quarter of 2010, as you can see, this will not be enough to reach the destructive Progressive goal of a 100% debt-to-GDP ratio.

Scenario #2 – The way back to 2003

In order to return to the more prosperous 2003 Debt-to-GDP ratio of 60.9%, GDP must grow at a sustained annual rate of 14.1% for the next 11 years. In order to achieve such a rate of growth, our economy would have to grow at the pace of an emerging market, a feat which is clearly impossible for an industrialized nation. This is precisely why the president’s debt commission has stated publicly that, we will never grow our way out of this ‘man-made disaster’.

Scenario #3 – The Hellenistic toboggan slide

If GDP maintains its present annual growth rate of 3.2%, then by the year 2020 our debt-to-GDP ratio will reach 117.4%. Welcome to the Progressive Utopia. Welcome to the Republic of Greece.

Conclusion

The end of the Progressive trail leads to Greece. What you are seeing in Greece today is precisely where Progressive ideology will take us. Prepare for riots, violence, chaos, class warfare, and national bailouts. If that’s what you want, then support Barack Obama, and his Progressive entourage, and vehemently defend all of their policies. But, if this is not where you want to be in 2020, then identify and support true fiscal conservatives. Join with independents and moderates, and let’s elect responsible mainstream leaders who will lead us out of the wilderness, through sound fiscal policy, and free-enterprise solutions. It’s time to put the Progressives in their place: prison.

Sources:

http://www.bea.gov/newsreleases/national/gdp/2010/txt/gdp1q10_adv.txt

http://www.treasurydirect.gov/govt/reports/pd/histdebt/histdebt_histo5.htm

http://www.treasurydirect.gov/NP/BPDLogin?application=np

http://www.cbo.gov/ftpdocs/112xx/doc11231/frontmatter.shtml

click to enlarge

click to enlarge

Government-Run vs. Private Health Insurance

The table above was revised on 08/30/09.

click image to enlarge

Government-Run vs. Private Health Insurance

More Honest Debate

First of all, 60% of private sector health insurance providers are non-profits who must by law disclose their records to the public. You can find their tax returns online including information about programs, and compensation.

Most of the remaining companies are publicly traded and by law must file 10K and 10Q reports with the SEC. Their financial information and compensation information is also available online on various websites.

Information on government-run health insurance programs (i.e. The Public Option) may also be found online. The Social Security Administration issues an annual Trust Fund report. (Note: Both public trustee positions are still vacant.)

In comparing the three types, it is clear that something is wrong with the federal government. I have to disclose that I did not include the funds that Medicare obtains from general government revenues, above, because this money comes directly from income taxes.

Medicare Part A is funded primarily by payroll taxes assessed on an individual’s total wages. Medicare B and D is funded primarily by premiums charged to Social Security recipients (which I might add is kind of redundant).

To be brief: For-profits are by necessity in the black. On the other hand, government-run insurance is in the tank. In fact, Medicare is projected to exhaust it’s assets by 2017 according to the 2009 Annual Trustees Report.

So I ask this question. Who is better qualified to manage health insurance: ‘government workers’ in Washington, DC or the Private Sector? I think you know the answer.

Solution: With proper regulation and oversight, turn over Medicare, and Social Security to the Private Sector. Bigger government is not the solution, it’s the problem.

[Update: Expanded table and updated sources on 08/30/09]

Sources:

  1. http://www.bcbsm.com/home/bcbsm/annual_report.shtml

  2. http://www.redorbit.com/news/health/1639322/kaiser_foundation_health_plan_inc_and_kaiser_foundation_hospitals_report/

  3. http://www.hcsc.com/about-hcsc/finance.htm

  4. http://www.marketwatch.com/investing/stock/unh/financials

  5. http://www.marketwatch.com/investing/stock/ci/financials

  6. http://www.marketwatch.com/investing/stock/wlp/financials

  7. http://www.marketwatch.com/investing/stock/hum/financials

  8. http://www.marketwatch.com/investing/stock/aet/financials

  9. http://www.ssa.gov/OACT/TRSUM/index.html

  10. http://www.ssa.gov/OACT/TRSUM/index.html