Endless Stimulus | Payroll Tax Cut

Common Sense vs. Nonsense: Bankrupting the Future –

By: Larry Walker, Jr. –

Facts: The 2% payroll tax cut not only boosted workers’ take-home pay by $120 billion in 2011, but it also widened the government’s budget deficit, and left the social security trust fund in the red.

Since Social Security and Medicare taxes are collected in order to realize future benefits, why would the federal government choose to refund a portion of those collections today? Are its entitlement programs in such good shape that the government can afford to distribute benefits prematurely? I don’t think so. For that would infer that future benefit payouts are on the decline. However, to the dismay of many, in fiscal year 2011 the net cost of social security benefits increased by 18.9%, over fiscal year 2008, while tax collections declined by 13.5%, widening the breach by 1,678%.

Since at least 1975, a growing portion of social welfare spending has been introduced by Congressional tax-writing committees and administered by the Internal Revenue Service. As I outlined in Tax Simplification, Part II, the Earned Income Credit, Child Tax Credit, and Making Work Pay Credit were primarily responsible for IRS administered giveaways of $171 billion in fiscal year 2010, or if you prefer $1.7 trillion over 10 years. In fiscal year 2011 the amount was upped to $231 billion per year, due to the payroll tax cut. And today, some members of Congress are urging others to increase these tax giveaways to $351 billion annually, which I think will end up costing closer to $471 billion (as explained below). But in all of this pandering, what is even more illogical than charging additional debt to Obama’s unlimited credit line, is the rebating of funds “supposedly” earmarked for future liabilities.

As Sherlock and I proved in Social Security: A Breach of Trust, the federal government has summarily confiscated and spent every dime of the $2.6 trillion surplus, which would have comprised the Social Security Trust Fund, and has replaced it with non-marketable, special-issue, Treasury securities. And since these special-issue securities are an asset to the Trust Fund and a liability to the U.S. Treasury, they therefore cancel each other out. In other words, since there is no surplus, every dime of Social Security and Medicare tax collected today is spent today, therefore any shortfall rests squarely on the shoulders of the general budget. And as you may know, the general budget is currently more than $15 trillion in arrears.

When the Making Work Pay Credit expired at the end of 2010, it was replaced with the 2% Payroll Tax Cut, as part of the Tax Relief, Unemployment Insurance Reauthorization and Job Creation Act of 2010. The newest tax gimmick allowed a 2% cut in payroll taxes for employees, which reduced the Social Security Tax from 6.2% to 4.2%, without affecting Social Security benefits. But in the big picture, all it really accomplished was to elevate the amount of social welfare tax expenditures already in the tax code, from $171 billion in 2010, to $231 billion in 2011, or by another $60 billion (see table below).

According to an editorial in Bloomberg-Businessweek, the 2% payroll tax cut boosted workers’ take-home pay by $120 billion in 2011. The editors contend that, “… this should stay in force for another year, be extended to the employer portion of payroll taxes, and increased for both employers and employees to a 3% cut.” And further that, “… the payroll tax cut should be widened to temporarily relieve employers of the entire 6.2% levy for new hires and pay raises.” They conclude their unbalanced argument by stating that, “Republicans should be willing to go along. We are talking about tax cuts, after all, that would pump some $240 billion into a struggling economy.”

So in other words, Bloomberg-Businessweek thinks that annual social welfare tax expenditures of $171 billion in 2010, and $231.3 billion in 2011 were not enough. According to the editor’s, social welfare tax expenditures should be increased to $351.3 billion, and conservatives should be willing to go along, to get along. But stepping back from the easel, to gain some aesthetic distance, the inference appears to be that a 10-year tax expenditure of $1,710 billion wasn’t enough, that $2,313 billion is insufficient, and that $3,513 billion is somehow the magic number (assuming that expenditures for the child tax credit and earned income credit remain fixed). I don’t know any true Conservative, in my neck of the woods, which would go along with blowing a bigger hole in the federal budget than already exists, for any reason; especially not to extend another temporary economic stimulus, some 29 months after the recession officially ended.

Endless Stimulus

These days, it’s as if every time a temporary measure expires, its reversal is deemed to be a tax hike. But the expiration of this one-year, one-time, re-election ploy isn’t a tax hike at all; it’s merely the death of what was probably a bad idea in the first place. If we follow the logic that every temporary measure is permanent, then Obama’s entire 2009 stimulus spending binge must represent the new normal, and any reduction in government spending must be deemed a deviation from the norm, and thus a bad thing. But if not a descent towards Greece, where will this road end? Italy? France? Sheol?

I am not sure how the editor’s of Bloomberg-Businessweek arrived at their $120 billion and $240 billion figures, but let’s assume the former is correct. If so, then it would seem to me that since the cost of the 2% tax cut was estimated to have been $120 billion, that upping the employee payroll tax cut from 2% to 3%, and adding an employer tax cut of 3%, would come to more than double the current giveaway. Simple math leads me to a price tag closer to $360 billion [(120 / .02) * .06], than $240 billion. And that doesn’t include adding the 6.2% tax cut on new hires and pay raises, which would up the ante even more. Other than that little boo-boo, the major omission from Bloomberg-Businessweek’s one-sided endorsement of Barack Obama, because that’s what it is, is that any cut in the Social Security payroll tax translates directly into an increase in the budget deficit, and by extension, the national debt.

The following table was extracted from the Social Security Administration’s Consolidated Statements of Changes in Net Position for the Years Ended September 30, 2008 through 2011. If you wish, you may view the actual financial statements by following the links provided at the end of this post. After navigating this rather murky tome, the bottom line, exclusive of appropriations and interest payments derived from the general fund, may be summarized as follows:

The total amount of tax revenues collected dropped from $671.2 billion in fiscal year 2008, to $580.9 billion in fiscal year 2011, or by $90.3 billion. And the total cost of operations jumped to $782.7 billion in fiscal year 2011, from $658.4 billion in fiscal year 2008, or by $124.3 billion. In a nutshell, the fiscal year 2008 annual surplus of $12.8 billion has been transformed into a $201.8 billion annual deficit in just three fiscal years. In fact, expenditures have exceeded revenues by $370.9 billion over the past three fiscal years.

In other words, social security tax revenues have fallen by 13.5%, since 2008, while operating costs have risen by 18.9%. Another way of stating this is that the shortfall in Social Security tax collections, versus expenditures, has widened by 1,678%. This is significant because any shortfall, whether covered by interest on the debt or appropriations, must be siphoned directly from the general budget. In effect, these annual deficits have increased the national debt, while simultaneously compromising the future of our troubled entitlement programs.

Following the wisdom of Bloomberg-Businessweek, and implementing this fraction of Obama’s misnamed American Jobs Act, would add another $120 to $240 billion to what is already a $201.8 billion deficit on the Social Security Administration’s account. The idea of a payroll tax cut is not a bad one in and of itself, for a nation where the net cost of social benefits is on the decline, however under the circumstances, which some of us refer to as reality, it is probably the dumbest idea proffered by the Obama Administration to-date (although that’s pretty much a tossup).

Personally, I can do without the 2% payroll tax cut, since it has done nothing to increase my personal consumption, has accelerated the national debt, and has compromised the future of Social Security. No. I’m not on the band wagon with those harping for more social insurance rebates. Nor am I opposed to a surtax on those making more than $1 million per year, as long as it’s accompanied by a greater amount in spending cuts. What good is an equal increase in both spending and taxes? And what government-manufactured problem would a tax cut for some, and a tax hike on others solve? I say, ‘no good’, and ‘none’. As far as I’m concerned, anyone who votes for either keeping or increasing the payroll tax cut, under any circumstance, short of a 10-fold cut in spending, is an idiot. And anyone against raising taxes on taxable incomes greater than $1 million per year, in exchange for a 10-fold reduction in spending, is devoid of common sense.

References:

Social Security Administration 2011 Financial Statements – http://ssa.gov/finance/2011/Financial%20Statements.pdf

Social Security Administration 2010 Financial Statements – http://ssa.gov/finance/2010/Financial%20Statements.pdf

Social Security Administration 2009 Financial Statements – http://ssa.gov/finance/2009/Financial%20Statements.pdf

National Debt Bomb | 1976 to 2011

The 4th Deadly Sin

By: Larry Walker, Jr. –

Definition of Lazy – “encouraging inactivity or indolence”

The Nixon Shock was a series of economic measures taken by U.S. President Richard Nixon in 1972, which included unilaterally cancelling the direct convertibility of the United States dollar to gold and essentially ending the existing Bretton Woods system of international financial exchange. However, it was not until March of 1976 when the world’s major currencies began floating. It is notable that what cost $1.00 in 1976, now costs $3.95, and what costs $1.00 today, cost only $0.25 in 1976, as annual inflation over the period averaged 4.00%.

Meanwhile, since 1976, the U.S. National Debt has grown from $620.4 billion to $15,039.4 billion, in nominal dollars (as of November 17, 2011). So the questions today are as follows: How much of the national debt is attributable to a declining dollar? And, does anyone really care about the looming debt implosion?

Measuring the National Debt in 2011 Dollars

At the close of fiscal year 1976, the U.S. National Debt stood at $620.4 billion. Converting this to 2011 dollars, would have made it equivalent to $2,450.1 billion. So it took the United States 186 fiscal years, from 1791 to 1976, to accumulate today’s equivalent of $2,450.1 billion in debt. This averages out to around $13 billion per year, in today’s dollars, over the entire 186 year period. In contrast, over the last 4 fiscal years, the national debt has grown by a total of $5,006.9 billion, when measured in 2011 dollars. This averages out to borrowing of $1,251.7 billion per year, over the last 4 fiscal years.

Per NationMaster.com, in 1976, the U.S. population stood at 218.0 million. By 2011 the population had increased to 311.7 million, representing an average annual growth rate of 1.2%. At the current rate of growth, the population will reach 1,008 million by the year 2193, 186 years from 2007.

From 1977 through fiscal year 2007, the national debt grew from $2,450 billion to $9,783 billion (in 2011 dollars). That’s an increase of $237 billion per year, or an average annual growth rate of 9.7%. On that trajectory, the debt would reach $185.5 trillion by the year 2193.

From 1977 through fiscal year 2011, the national debt grew from $2,450 billion to $14,790 billion (in 2011 dollars). That’s an increase of $353 billion per year, or an average annual growth rate of 14.4%. On this trajectory, the debt would reach $402.2 trillion by the year 2193.

In fiscal years 2008 through 2011, the national debt grew from $9,783 billion to $14,790 billion (in 2011 dollars). This represents an increase of $1,252 billion per year, or an average annual growth rate of 12.8%. Since the growth rate has been slightly lower over the last four years, as compared to 1977 to 2011, on its current trajectory, the national debt will reach $359.2 trillion by the year 2193.

On a per capita basis, the national debt was $11,237 in 1976 as compared to $47,450 at the end of fiscal year 2011 (in 2011 dollars). Based on its 1977 to 2007 growth rate, the debt would reach $183,997 per capita by the year 2193. At its 1977 to 2011 growth rate, the debt would reach $398,944 per capita by the year 2193. However, at the rate of growth since the end of 2007, the debt will reach $356,327 per capita by the year 2193.

To summarize, measuring in 2011 dollars, the national debt grew by an average of $13 billion per year over the 186 year period ending in 1976, and over the last four fiscal years it has increased at an average of $1,252 billion per year. Putting this into historical context, as compared to pre-1977 borrowing, the federal government is presently incurring the equivalent of 96 years of debt in each new fiscal year.

Another way of looking at this is that since the debt grew from $2,450.1 billion in 1976, to $14,790.3 billion in 2011, it has grown by $12,340.2 billion over the last 35 years, or by an average of $352.6 billion per year (in 2011 dollars). So because since 1976 we have borrowed an average of $352.6 billion per year, versus an average of $13 billion pre-1977, it may be stated that, the United States is currently borrowing at an annual rate which is 2,612.3% higher than its pre-1977 average.

And thanks to the Federal Reserve, what cost $0.25 in 1976, now costs $1.00. So since everything costs about 400% more than it did in 1976, in real terms, government borrowing is only off target by 2,212.3% from its pre-1977 level. Therefore, although the declining dollar is partially responsible for the increased borrowing, it only represents about 15.3% of the problem.

Debt to GDP: 1976 vs. 2011

By the end of fiscal year 2011, the national debt had grown to $14,790.3 billion. Meanwhile, according to the Bureau of Economic Analysis, U.S. Gross Domestic Product stood at $15,198.6 billion, as of the end of the 3rd quarter 2011. So at the close of fiscal year 2011, our debt-to-GDP ratio was 97.3% (14,790.3 / 15,198.6). In comparison, the national debt stood at $2,450.1 billion, in 1976, and GDP was $7,205.7 (in 2011 dollars). So at the close of fiscal year 1976, our debt-to-GDP ratio was only 34.0% (2,450.1 / 7,205.7).

  • 1976 Debt-to-GDP Ratio: 34.0%

  • 2011 Debt-to-GDP Ratio: 97.3%

Measuring the National Debt in Constant 1976 Dollars

Since the dollar has lost 300% of its value since 1976, courtesy of the Federal Reserve, what would the national debt look like had our currency remained stable? Well, according to the table below, the national debt would be $3.8 trillion, as of 11/17/2011, in constant 1976 dollars, as opposed to its present value of $15.0 trillion. More interestingly however, there are five years where the national debt actually declined, when valued in constant 1976 dollars – 1979, 1980, 1981, 2000 and 2001.

Best 5 vs. Worst 5

When valuing the national debt in 2011 dollars, the table below shows that the worst 5 years were 2004, 2008, 2011, 2010, and 2009, with annual debt increases of $595.8, $1,017.1, $1,228.7, $1,651.8, and $1,885.1 billion, respectively. But what’s more disturbing is that, based on the first month and a half of fiscal year 2012, borrowing is currently on pace to reach $1,992.1 billion, which would exceed the fiscal year 2009 record of $1,885.1 billion, making this year, potentially, the all-time worst on record.

The table also shows that the best 5-years were 2000, 1980, 2001, 1981, and 1979, with annual borrowing decreases of $-44.1, $-20.7, $-18.8, $-15.1, and $-11.9 billion, when valued in constant 1976 dollars, respectively.

The chart above reflects the annual change in the national debt, in nominal dollars as compared to constant 1976 dollars. But it’s not like anyone really cares. Who’s paying attention anyway? I definitely have better things to do than worry about what’s going on in Washington, DC. As far as I’m concerned, wherever the buck stops is where the blame lies. So what does Obama have to say, after posting 3 of the worst 5 spending records in modern U.S. history? “…Also to put our economy on a stronger and sounder footing for the future, we’ve got to rein in our deficits and get the government to live within its means, while still making the investments that help put people to work right now and make us more competitive in the future.” So in other words, according to Obama, government needs to spend more and lower its annual deficit at the same time.

Obama recently made the admission that, “We’ve been a little bit lazy over the last couple of decades. We’ve kind of taken for granted — ‘Well, people would want to come here’ — and we aren’t out there hungry, selling America and trying to attract new businesses into America.” So pray tell, exactly who has “gotten a little bit lazy” in attracting foreign investment to America? It looks to me like most of that investment is coming in to cover Obama’s own irresponsible spending, and that the only other attraction would be the lure of higher taxes, and tighter governmental regulations. Oh, and by the way, those Obama manufactured Occupy Protests aren’t exactly lending America the aura of stability either. If America has gotten “a little lazy over the last couple of decades”, she must have committed the 4th Deadly Sin over the last 3 years.

References:

Nixon Shock – http://en.wikipedia.org/wiki/Nixon_Shock

Dollar Times – Inflation Calculator – http://www.dollartimes.com/calculators/inflation.htm

U.S. Treasury – Historical Debt – http://treasurydirect.gov/govt/reports/pd/histdebt/histdebt.htm

Obama’s Economic Reduction Plan

Private Equity vs. Government Redistribution

– By: Larry Walker, Jr. –

“A farmer went out to sow his seed. As he was scattering the seed, some fell along the path, and the birds came and ate it up. Some fell on rocky places, where it did not have much soil. It sprang up quickly, because the soil was shallow. But when the sun came up, the plants were scorched, and they withered because they had no root. Other seed fell among thorns, which grew up and choked the plants. Still other seed fell on good soil, where it produced a crop—a hundred, sixty or thirty times what was sown. He who has ears, let him hear.” ~ Matthew 13:3-9

For many, the American Dream consists of the hope of freeloading off of the good fortune of others for their entire lives. Yet for some, the dream is comprised of one day saving enough capital to invest in a business of their own. And for a few, the dream is to one day save enough to invest through a private equity group. For those aspiring towards business ownership, sometimes a little help is needed, and that help, in many instances comes though private equity firms.

So why would anyone dream of investing in a private equity firm? Well one big reason is that under current law, around 58% of the profits realized by private equity firms are taxed as long-term capital gains rather than as ordinary income. Long-term capital gains are currently taxed at the maximum rate of 15%, while ordinary income is taxed as high as 35%. The lower tax rate on long-term capital gains helps to compensate for the opportunity cost of investing for the long haul, and also enables a greater portion of the profits to be reinvested into the next venture, which can ultimately lead to the accumulation of a great deal of wealth.

Another reason many dream of investing in private equity groups is because they feel a calling to help fellow Americans reach their dreams. Unlike bloated, deficit-financed, short-sighted, big government wealth redistribution schemes, private equity is good for America. However, if the carried interest (the long-term capital gains earned through investing in private equity) were to suddenly be taxed at the same rates as ordinary income, then there would no longer be an incentive to invest in long-term private business endeavors.

Private equity firms fund and co-manage thousands of private businesses in the United States, employing millions of American workers, and these businesses are dependent upon stable long-term investments. If big government takes away the incentive to save and invest in long-term endeavors, then there will be no long-term investment. It simply won’t be worth the risk. And without long-term private equity investment, thousands of businesses, millions of jobs and the American Dream will be choked out of existence.

Carried Interest vs. Ordinary Income

Ordinary income is mostly comprised of net business income, fixed compensation, interest, dividends, rents, royalties, and short-term (less than a year) capital gains. Unlike ordinary income, there is greater risk involved with long-term (more than a year) capital investments. Private equity firms typically make investments over a 3 to 7 year term. The risk of tying up capital savings for many years is that the investment might be lost entirely, or may not return any profit at all. So is carried interest the same as ordinary income? Centuries of sound and settled tax policies say no. But Barack Obama, a novice, with no business experience, and a track record of failed economic policies; and Warren Buffett, a retiring billionaire, who has profited from lower taxes on carried interest during his lifetime, say yes. So who’s right, centuries of proven economic science, or 32 months of butt kissing and B.S.?

The Obama-Buffett Rule presumes that carried interest is the same as ordinary income and should be taxed at ordinary income tax rates of up to 35%, instead of at capital gains rates of up to 15%. The contention that the profits earned through long-term capital investment, which involves placing previously taxed income at risk through investing in risky business ventures, which employ hundreds of thousands of American workers, and which help drive the American economy, should be taxed at the same rate as fixed compensation, such as wages earned from labor, is quite a leap. The problem with Obama’s latest Socialist twist is that unlike fixed compensation, which is properly taxed as ordinary income, carried interest, garnered through private equity investments, only rewards general partners if, at the end of the term, the fund actually results in a net gain.

To break this down further, you have on the one hand wage earners, who work 40 hours per week, get paid weekly (or semi-monthly), consume most of their pay, and have taxes withheld from each paycheck. And on the other hand, you have private equity partners who work on a project for 3 to 7 years, expending capital and sweat equity, aiding in the employment of thousands of tax paying workers, helping make tax paying businesses profitable, and ultimately hoping to, at the end of the term, regain their investment along with a handsome profit. So is carried interest the same as ordinary income? Is all income created equal? Is Capitalism the same as Socialism? Do words still have meaning?

Private Equity in Action

Within the State of Georgia there are approximately 30 private equity firms, which have invested an estimated $26 billion in Georgia-based companies, which back approximately 340 private companies, which employ more than 175,000 U.S. workers. If more capital is diverted away from private equity investments, through errant tax policies, and instead invested in tax-free securities or some other jurisdiction, then where will the capital to fund these Georgia businesses come from? It’s not likely to come from banks, which are currently paying investors taxable interest of between .01% and 1.0% on savings. And it’s not likely to come from the federal government which is currently $14.7 trillion in debt. Thus, when private equity capital is finally taxed out of existence, there will be no capital, and most of these 340 companies will cease to exist, along with 175,000 jobs.

In the State of Illinois there are approximately 137 private equity firms, which have invested an estimated $72.9 billion in Illinois companies, which back approximately 450 private companies, which employ more than 350,000 workers in the U.S. The State Employees’ Retirement System of Illinois had nearly $525 million invested in private equity as of June 30, 2008, about 5 percent of the System’s total pension fund portfolio of more than $11.4 billion. And as of June 30, 2009, the Illinois’ Teachers Retirement System had $2.34 billion invested in private equity, about 8.2 percent of TRS’ total portfolio of nearly $29 billion. Are the billions of dollars that Illinois pension funds invest in private equity firms any more or less important than any other American citizen’s savings? I think not. If the government takes away the incentive of private equity partners, then where will this capital go? If you say, “To the Banks”, again you err. If you say, “Directly into businesses”, then who will oversee and manage these investments, the government? Yeah, right, just like Solyndra.

It’s Math!

And then there’s this hogwash about wealthy people paying lower tax rates than middle income earners. Does anyone really believe this? All you have to do is glance over at one of our “progressive” tax rate schedules, to know that’s not the case. Since our tax rate structure is “progressive”, the rates increase along with income. One’s combined tax rate is never the same as their bracket rate. In other words, you may be in a 25% bracket, but that doesn’t mean you’ll fork over 25% of your taxable income. As you can see below, married couples with ‘ordinary taxable income’ of $25,000 pay a tax of 11.6%, those with $50,000 pay 13.3%, and those with $100,000 pay 17.2%; while married couples with ‘ordinary taxable income’ of $250,000 pay a tax of 24.0%, those with $1,000,000 pay 32.0%, and those with $10,000,000 pay 34.7%.

In terms of dollar amounts, on the low-end, 11.6% of $25,000 translates into $2,900, while on the high-end, 34.7% of $10 million works out to around $3.5 million. So is paying $2,900 in taxes greater than or equal to paying $3.5 million? It’s math! One must also consider that five times out of ten, that $2,900 liability gets magically turned into a tax refund of up to $8,000, as nearly half of all American workers are either not liable for any income tax whatsoever, or fall into the negative category. So perhaps the words “fair share” could be more appropriately expressed as “unfair and not-shared”.

From Taxing the Rich

Although it may seem fair for Obama and Buffett to compare a private equity partner with $10,000,000 of carried interest, to a married couple with taxable wages of $100,000, it’s really not. It’s like comparing oranges to apples. Although the wage earning couple will pay federal taxes of 17.2% versus the carried interest earners 15.0%, in the end, the couple will have paid a total of $17,250 in taxes, versus $1,500,000 for the private equity partner. So is $17,250 greater than $1,500,000? “It’s math!”

The real difference is that a private equity partner may then turn around and reinvest most or all of the remaining $8,500,000 into the same company that the married couple works for, thus enabling them to continue their very employment. In terms of economics, the multiplier effect on private equity investment generates many times the tax revenue paid by the partner himself. Just add up the taxes collected on all the additional wages, salaries and business profits he helps to generate. But if that capital be muzzled, the result will be less free-enterprise and even higher levels of unemployment. Thus, while earning a salary is productive, it’s nowhere near as productive as carried interest. Perhaps there’s a reason why some of our tax policies are the way they are! “It’s math!”

If Obama and Buffett really wanted to compare apples to apples, then they would be comparing a married couple with carried interest income of $10,000,000, to a couple with long-term capital gains income of $10,000,000. Each will pay $1,500,000 in taxes. So is fairness still an issue? The truth is that no American is prevented from saving his or her own money and investing in activities generating similar capital gains. Anyone can do it, and will reap an equal reward — a maximum 15% long-term capital gains tax. But if the government ever takes away this incentive, or begins to discriminate against certain forms of long-term gains, then you can kiss the American Dream goodbye.

Government Subsidies vs. Private Equity

If the government steps in and confiscates a larger chunk of the profits earned by private equity firms, then there will be that much less capital to reinvest in new acquisitions. And what will the government do to make up the shortfall? Will the government invest in and manage new enterprises? Perhaps, the federal government will subsidize more companies like Solyndra, but then who gets the ‘return on subsidy’ (ROS), if and when the government is successful? Will every taxpayer get an equal slice of the pie? That’s highly doubtful. More than likely, the money will simply be absorbed into the federal government’s irresponsible $1.3 trillion per year budget deficits, or into its $14.7 trillion national debt, or used to pay unemployment compensation, or to dole out more food stamps, neither of which will create new jobs. In other words, the money will be pilfered and consumed rather than invested in viable job creating enterprises. And we all know that America needs more jobs, not more debt, unemployment compensation and food stamps.

Private equity investors fund American businesses which employ millions of American workers. By investing in non-public companies they typically hold their investments with the intent of realizing a return within 3 to 7 years. Shouldn’t there be some reward for committing previously taxed income for 3 to 7 years, in order to help businesses grow, and to enable employment for millions of workers, with no guarantee of a profit let alone return of the original investment? I say, yes. Obama and Buffett say, no. Where they err in their quest for “fairness” is in that 42% of the profits earned by private equity investors are already taxed at ordinary tax rates, while just 58% represents carried interest. They also fail to realize that such profits are typically reinvested back into the cash account to fund the next acquisition. You would think that at least Buffett would understand this concept, since most of his earnings have been likewise reinvested.

Hell No!

With Obama’s brand of math, one would surmise that if the government could just confiscate the $1.4 trillion in annual private savings, and use it to pay the $1.4 trillion of annual government deficits this would somehow bring about “balance”. But all it would really bring about is a permanent state of depression, mass government dependency, and even greater deficits once the government runs out of other people’s money. And considering that the best the federal government could possibly do, by confiscating additional tax revenue, is to immediately absorb it into its irresponsibly amassed $14.7 trillion in accumulated deficits, over $4 trillion of which was squandered by Obama himself, the answer to the request for more revenue is still, “Hell No”. Cut spending, stop squandering the tax dollars we’re already paying, and stop regurgitating the same old lies over and over again.

Although the federal government does employ a couple of million workers, about 59% of the money used to pay them is already confiscated from taxpayers, while the other 41% is merely borrowed from the Federal Reserve Bank and from countries like China. Every dime taken away from private investors and spent by the government is a dime taken away from private businesses and private sector workers. Once the point of no return was breached, back in 2010, there was no longer enough personal income to cover the amount of federal debt, on a per capita basis, and if this is not corrected soon, it will lead to the death of the American Dream. If there is already not enough income to pay the government’s debt, then why is Obama begging for higher taxes? When there is nothing left but government, then what? Will the government pay everyone a subsidy of say $50,000, and then proceed to levy a 100% tax on everyone in order to fund itself into infinity? Isn’t this exactly where Obama’s plan leads?

The failure of Obamanomics can be summed up in a few short phrases: If it produces jobs, tax it. If it keeps producing jobs, regulate it. And when it stops producing jobs, subsidize it. Thus Obama’s plan for deficit reduction, like his Jobs Act, is just another gimmick leading to economic reduction, job destruction, government dependence, poverty and the end of the American Dream. Obama gave it his best, but his best just wasn’t good enough for America. Hey Obama, “Hell no, and good riddance.”

*** BTW – Raising the tax rate on carried interest from 15% to 35% would result in a 133.33% tax hike, or to 39.6% would equal a 164.0% hike, just in case anyone is still considering this madness. ***

“There is a limit to the taxing power of a State beyond which increased rates produce decreased revenue. If that be exceeded intangible securities and other personal property become driven out of its jurisdiction, industry cannot meet its less burdened competitors, and no capital will be found for enlarging old or starting new enterprises. Such a condition means first stagnation, then decay and dissolution. There is before us a danger that our resources may be taxed out of existence and our prosperity destroyed.” ~Calvin Coolidge (Address to the General Court beginning the 2nd year as Governor of Massachusetts January 8, 1920)

References:

Private Equity Info

Private Equity Growth Capital Council

Related:

The Problems with Raising Taxes on Carried Interest, Part II

Taxing the Rich – 1765 to 2011, Part III

– War on Taxes: 1964 to 2011

– By: Larry Walker, Jr. –

“The largest single barrier to full employment of our manpower and resources and to a higher rate of economic growth is the unrealistically heavy drag of federal income taxes on private purchasing power, initiative and incentive.” ~John F. Kennedy, Jan. 24, 1963, special message to Congress on tax reduction and reform

From Taxing the Rich

Recap: 1776 to 1912

In 1765, Great Britain imposed a series of taxes upon the American Colonies, in order to pay for its lengthy French and Indian War (1754-1763). After the war, the British forced upon the Colonies, the Stamp Act of 1765, requiring the purchase of tax stamps for any printed documents including newspapers, legal documents, marriage licenses and more. This was followed by the Townshend Acts of 1767 which were passed: to raise revenue in order to pay the salaries of governors and judges so that they would be independent of colonial rule; to create a more effective means of enforcing compliance with trade regulations; to punish the province of New York for failing to comply with the 1765 Quartering Act; and to establish as precedent the British Parliament’s right to tax.

Just like the Tea Party Movement of today, our founding fathers resented insidious taxes and regulations imposed upon them without their consent. Then as now, it is simply a matter of ‘taxation without representation’, an act which early Americans likened to tyranny. By 1773, when the East India Company was granted a virtual monopoly on the importation of tea, it was the last straw. In protest, a group of Boston citizens disguised as Mohawk Indians boarded a ship and dumped 342 chests of tea into Boston harbor. The Revolutionary War ensued, and the United States of America was born. Today, the Affordable Care Act is only a symptom of the disease. The disease being: overregulation, overburdensome covert and overt taxes, unsustainable federal debt, and a small minority of ideologues, with socialist tendencies, forcing their will upon the people.

The first income tax proposed by the United States Government was intended to fund the American Civil War (1861). Prior to this, the government was funded strictly through customs duties, tariffs levied on imported goods. During the War of 1812, the government experimented briefly with excise taxes on certain goods, commodities, housing, slaves and land, but a tax on income was out of the question. What is significant is that prior to 1861, or for the first 86 years of American history, whether a citizen had an annual income of $800, $250,000, $1,000,000 or $10,000,000, every dime was considered to be private property of the individual, and not subject to any federal claim.

In 1862, the first Revenue Act was revised, before any tax was due, and the Revenue Act of 1862 launched the first progressive rate tax in U.S. history. The Act established the office of the Commissioner of Internal Revenue, and specified that the Federal income tax was a temporary measure that would terminate in the year 1866. Annual income of U.S. residents, to the extent it exceeded $600 ($13,400 in 2011 dollars), was taxed at a rate of 3.0%; those earning over $10,000 per year ($224,000 in 2011 dollars) were taxed at a 5.0% rate. Through 1912, the income tax only existed for 11 out of the first 137 years of American history, from 1862 to 1872, while no income tax was imposed upon private citizens for 126 years. The income tax was a temporary measure imposed to fund the American Civil War. During the era, the highest tax rate assessed on married couples occurred between 1865 and 1866, when those earning the equivalent of $250,000 (in 2011 dollars) paid a tax of 8.4%, those earning $1,000,000 paid 9.6%, and those earning $10,000,000 incurred a tax rate of just 10.0%.

In the midst of the Panic of 1893, an amendment to the Wilson-Gorman Tariff Act of 1894 was passed, establishing a flat 2.0% tax on all incomes above $4,000 per year (about $104,000 today). The amendment would have exempted from taxation the salaries of state and local officials, federal judges, and the president. Believing the tax to be unconstitutional, President Grover Cleveland refused to sign it. The Act became law in 1894 without his signature, but was ruled unconstitutional by the U.S. Supreme Court in the following year.

Thus America remained the land of the free, free of an income tax from 1873 through 1912. But behind the scenes, the Democrat Party was fast at work, conjuring legislation which would ultimately destroy the freedoms won by Americans in 1776. Democrats proposed a constitutional income tax amendment in their party platforms of 1896 and 1908. Theodore Roosevelt endorsed both an income tax and an inheritance tax, and in 1908, became the first President of the United States to openly propose that the political power of government be used to redistribute wealth.

In 1909, the income tax amendment passed overwhelmingly in the Congress and was sent off to the states. The last state ratified the amendment on February 13, 1913. The Sixteenth Amendment owes its existence mainly to the West and South, where individual incomes of $5,000 or more were comparatively few. Sold to the public as a tax on the rich, the income tax initially applied to less than 1.0% of the population, but that would be short lived. The aspirations of power hungry, greedy and wasteful politicians would soon change the federal government into the conundrum it is today.

From Taxing the Rich

Recap: 1913 to 1963

In April of 1913, President Woodrow Wilson summoned a special session of Congress to confront the perennial tariff question. He was the first president since John Adams to make an appeal directly to Congress. Under the guise of reducing tariffs, the Act turned out to be nothing more than a means of reinstituting a federal income tax. The argument followed that since a reduction in tariff duties would lead to lost revenue, an income tax would be required to makeup the shortfall. We should be mindful of this deception as Barack Obama attempts to twist arms during his upcoming special session.

World War I commenced on July 28, 1914 and lasted until November 11, 1918. Since the income tax was initially imposed as a means of funding war (1861), its original intent now combined with an element of wealth redistribution, lead to one of the most convoluted tax rate schedules of all time. The War Revenue Act of 1917 expanded the tax rate schedule from 7 to 56 tiers. Rates were hiked to a range of 6.0% to 77.0% in 1918. The 1918 tax rate schedule was so convoluted that taxpayers were thrown into a higher bracket with every $1,000 to $2,000 of additional income.

Although the war ended in 1918, income taxes were not significantly reduced until 1924. In 1919 the top rate was gradually lowered to 73.0%, then to 58.0% in 1922, and to 46.0% under the Mellon Tax Bill of 1924. By 1924, the tax rate schedule contained just 43 tiers compared to 56 in 1918. The bottom rate also gradually declined from 6.0% in 1918 to 2.0% in 1924. Then in 1925, under the leadership of President Calvin Coolidge, the bottom rate was reduced to 1.5%, the top rate slashed to 25.0% with a reduced top bracket, and the tax rate schedule was simplified to 23 tiers from 43.

In the midst of the Great Depression, President Herbert Hoover relapsed, imposing higher tax rates and expanding the number of tax brackets from 23 to 55. In 1932, the bottom rate was increased from 1.5% to 4.0%, and the top rate was hiked from 25.0% to 63.0%. Franklin Roosevelt would later increase the top rate to 79.0%, in 1936, where it remained through 1940. Hoover had in effect reinstated wartime tax rates during a time of peace. Errantly believing that higher taxes would increase government revenue, Hoover was the first president to prove that raising taxes during a recession only prolongs the downturn.

Thanks to Hoover, and his successor Franklin Roosevelt, the Great Depression wouldn’t end until America entered the 2nd World War. After Hoover opened the door, FDR removed the hinges, gradually raising rates from the bottom up. President Franklin Roosevelt believed and stated that, “Taxes, after all, are dues that we pay for the privileges of membership in an organized society.” This would mark a critical turning point in American history, as the purpose of the income tax had shifted from a temporary means to fund the Civil War, to a measure reinforcing lower tariff duties, to a tool for redistributing wealth, and ultimately to the price of living under the rule of a tyrannical dictator.

Following suit, bottom tax rates were raised from 4.0% in 1932, to 10.0% in 1941, to 19.0% in 1942, and to a record high of 23.0% in 1944. His successor, Harry Truman, would continue the tradition. After initially lowering the bottom rate to 20.0% in 1949, Truman raised it to 20.4% in 1951 and to 22.2% in 1952. The bottom rate was then locked in at 20.0%, by President Dwight Eisenhower, where it remained from 1954 through 1963. The top rate was likewise increased by FDR, climbing from 63.0% in 1932, to 79.0% in 1936, 81.0% in 1941, 88.0% in 1942, and to a record high of 94.0% in 1944 — during the height of the 2nd World War. Truman later lowered the top bar to 91.0% in 1946, and then raised it yet again to 92.0% in 1952. Eisenhower would fix the top tier at 91.0%, where it would remain from 1954 through 1963.

During the first 51 years after reinstatement of the income tax (1913 – 1963), the bottom rate commenced at 1.0%, peaked at 23.0%, and settled at 20.0%. Meanwhile, the top rate was nudged in at 7.0%, peaked at 94.0%, and ended the period at 91.0%. Imagine being in the top tax bracket with an opportunity to make an extra $1 million, and facing the prospect of handing over $910,000 of it to the government, while clutching to a paltry $90,000. Was that fair? Does it sound like a plan for economic prosperity and jobs growth? As we shall see, neither John F. Kennedy nor Ronald Reagan thought so.

From Taxing the Rich

The Tax Reduction Act of 1964

“Our tax system still siphons out of the private economy too large a share of personal and business purchasing power and reduces the incentive for risk, investment and effort – thereby aborting our recoveries and stifling our national growth rate.” – John F. Kennedy, Jan. 24, 1963, message to Congress on tax reduction and reform, House Doc. 43, 88th Congress, 1st Session

Finally in 1963, President John F. Kennedy was able to restore a measure of common sense to the overburdening income tax system. However, shortly after rebuking the “tax the rich” intelligentsia, JFK was assassinated in November 1963. He was succeeded by Lyndon Johnson who signed his vision into law. Under the Tax Reduction Act of 1964, the bottom rate was lowered from 20.0% in 1963, to 16.0% in 1964, and then to 14.0% from 1965 through 1976, and then later reduced to 0.0% in 1977 where it remained until 1986. The top rate was likewise reduced from 91.0% in 1963, to 77.0% in 1964, and then cut to 70.0% in 1965 where it remained until 1981.

Note: It was also during this era, that the Earned Income Credit (EIC) was signed into law by President Gerald Ford in 1975. The function of the EIC was to offset the burden Social Security taxes placed on low-income filers with children, and to motivate them to work.

From Taxing the Rich

In 1965 married couples with taxable income equivalent to $250,000 today paid a tax of 28.6%; those earning $1,000,000 paid 50.3%; and those earning $10,000,000 forked over 67.9% of taxable income (see table below).

From Taxing the Rich

During the entire 18 year period marking JFK’s tax reform legacy, married couples with taxable income equivalent to $250,000 today would have faced an average tax rate of 31.0%; those earning $1,000,000 would have paid an average rate of 52.8%; and those earning $10,000,000 would have forked over an average of 68.6% of their taxable income.

The Economic Recovery Tax Act of 1981

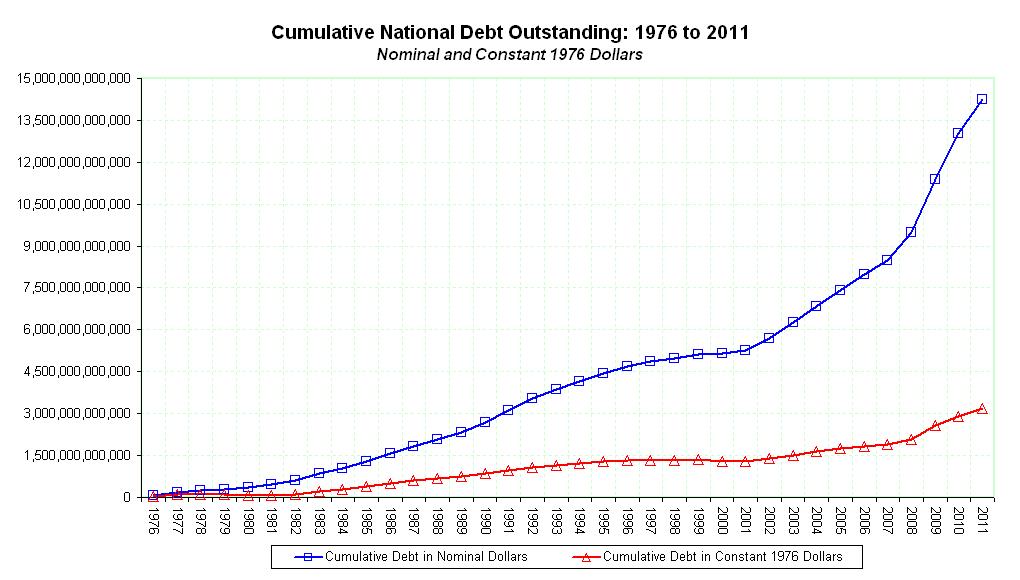
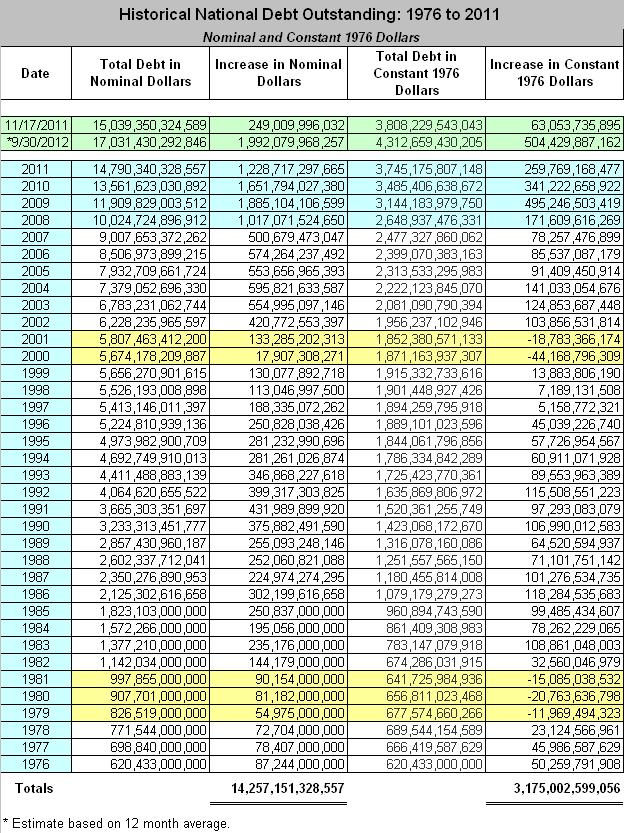
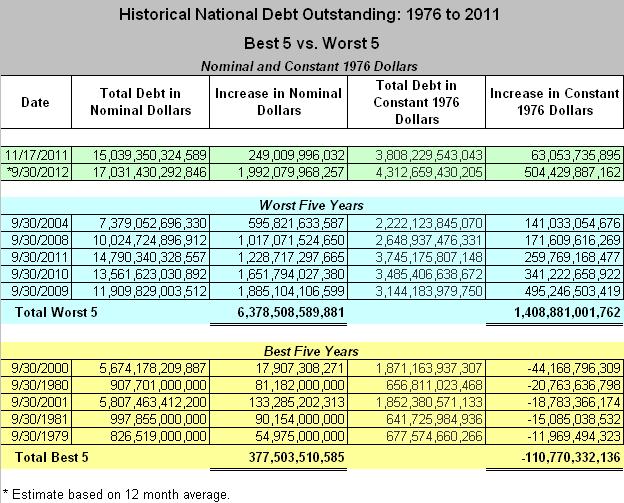
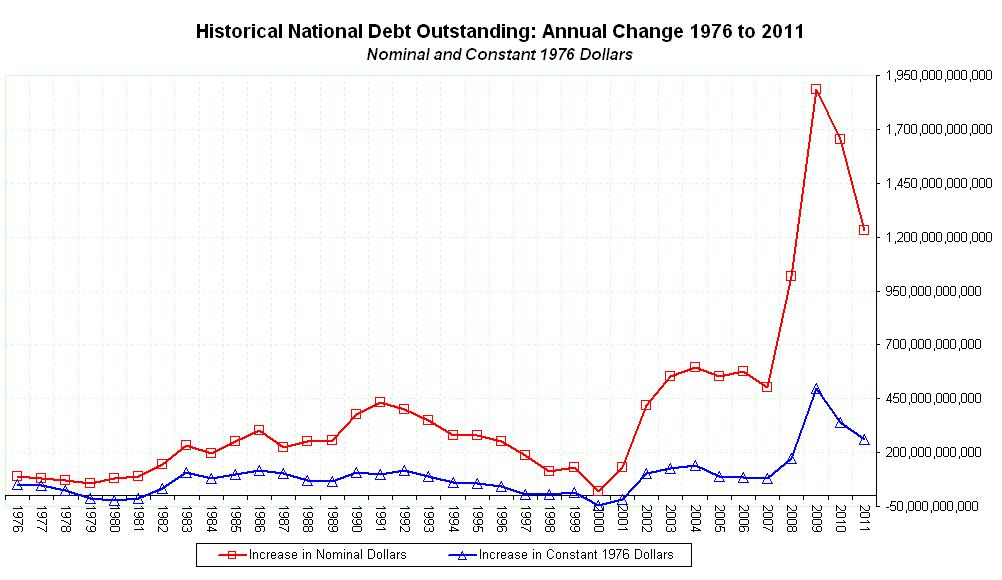
“We don’t have a trillion-dollar debt because we haven’t taxed enough; we have a trillion-dollar debt because we spend too much” ~Ronald Reagan – 40th US President (1981-1989)

In 1981, President Ronald Reagan, in the Jeffersonian spirit, with the wisdom of Lincoln, and the knowledge of Coolidge, took over where Kennedy left off. Summing up the folly of big government, he declared that, “The government’s view of the economy could be summed up in a few short phrases: If it moves, tax it. If it keeps moving, regulate it. And if it stops moving, subsidize it.” The Economic Recovery Tax Act, which went into effect in 1982, would maintain the bottom rate of 0.0%, and slash the top rate from 70.0% to 50.0%, but this was only the beginning.

In 1982 married couples with taxable income equivalent to $250,000 today paid a tax of 38.3%; those earning $1,000,000 paid 47.1%; and those earning $10,000,000 forked over 49.7% of taxable income (see table below).

From Taxing the Rich

The Tax Reform Act of 1986

The Economic Recovery Tax Act of 1981 was only a prelude to Reagan’s ultimate goal, tax reform. His objective was to simplify the income tax code, broaden the tax base and eliminate many tax shelters and other tax preferences. Under the Tax Reform Act of 1986 the bottom rate was raised from 0.0% to 11.0%, and the top rate slashed from 50.0% to 38.5%. As of 2011, the Act is the most recent major simplification of the tax code, drastically reducing the number of deductions and the number of tax brackets.

From Taxing the Rich

In 1987 a married couple with taxable income equivalent to $250,000 today paid a tax of 30.5%; those earning $1,000,000 paid 36.5%; and those earning $10,000,000 forked over 38.3% of taxable income (see table below).

From Taxing the Rich

The Tax Reform Act of 1986 culminated in the most simplified rate schedule since the days of Abraham Lincoln. Between 1988 and 1990, the tax rate schedule contained only two tiers, with a bottom rate of 15.0% for couples making under $56,504, and a top rate of 28.0% for those making $56,504 or more.

Between 1988 and 1990, married couples with taxable income equivalent to $250,000 today paid a tax of 25.1%; those earning $1,000,000 paid 27.3%; and those earning $10,000,000 had a tax liability of 27.9% of taxable income (see table below).

From Taxing the Rich

Although George H. W. Bush would ultimately raise taxes by adding a new top bracket of 31.0%, in 1991 through 1992, during the entire 11 year period, married couples with taxable income equivalent to $250,000 today would have faced an average tax rate of 30.5%; those earning $1,000,000 paid an average of 37.2%; and those earning $10,000,000 would have incurred an average tax liability of 39.3% of taxable income.

The Deficit Reduction Act of 1993

“I’ll tell you the whole story about that budget. Probably there are people in this room still mad at me at that budget because you think I raised your taxes too much. It might surprise you to know that I think I raised them too much, too” ~Bill Clinton – 1995

Bill Clinton’s Deficit Reduction Act of 1993 was nothing more than a tax hike. It was far from stellar, simply adding two new brackets above George H. W. Bush’s, but one positive aspect was that it represented a permanent change. The tax rates and brackets remained constant from 1993 through 2000, with an annual adjustment for inflation. The Act kept Reagan’s 15.0% and 28.0% brackets, and Bush’s 31.0% bracket in tact, and merely added two new brackets to the mix — 36.0% and 39.6%.

Note: Clinton is also responsible for implementing the Child Tax Credit, as part of the Taxpayer Relief Act of 1997. The credit was designed to provide tax relief to lower-income families. Initially, for tax year 1998, families with qualifying children were allowed a credit against their federal income tax of $400 for each qualifying child. For tax years after 1998, the credit increased to $500 per qualifying child, and for families with three or more children, the child tax credit was refundable.

From Taxing the Rich

During the 8 year period, 1993 through 2000, married couples with taxable income equivalent to $250,000 today enjoyed an average tax rate of 27.1%; those earning $1,000,000 incurred an average rate of 36.0%; and those earning $10,000,000 gave up an average of 39.2% of taxable income (see table below).

From Taxing the Rich

The Economic Growth and Tax Relief Reconciliation Act of 2001 (EGTRRA)

“He said, tax the rich. You’ve heard that before haven’t you? You know what that means. The rich dodge and you pay.” ~George W. Bush – 2004

In 2001, George W. Bush signed the Economic Growth and Tax Relief Reconciliation Act. The Act maintained the 15.0% bracket, and modestly reduced Reagan’s 28.0% bracket, Bush’s 31.0% bracket, and Clinton’s 36.0% and 39.6% brackets, to 27.5%, 30.5%, 35.5% and 39.1% in 2001. Then in 2002, the Act added a new 10.0% bracket (making it an authentic across the board tax cut), maintained a 15% bracket, and further reduced the remaining brackets to 27.0%, 30.0%, 35.0% and 38.6%.

Note: EGTRRA also enacted a stair-step schedule that raised the Child Tax Credit from $500 to $1,000 over a 10 year period. It also made a portion of the credit, known as the additional child tax credit, refundable.

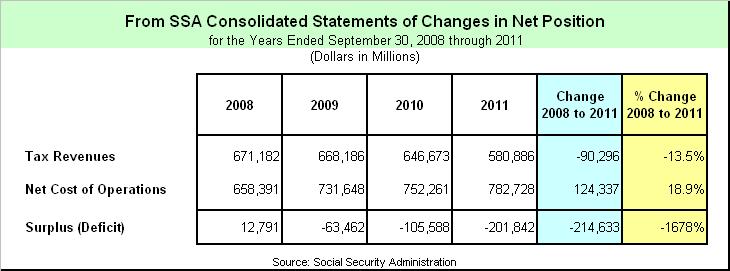
The following year, Bush would sign the Jobs and Growth Tax Relief Reconciliation Act of 2003 which provided the rates in force today. The Act maintained the 10.0% and 15.0% brackets, and reduced the remaining brackets to 25.0%, 28.0%, 33.0%, and 35.0%. As of today, although Barack Obama has delivered numerous speeches and proposed various temporary tax relief measures, such as a 2.0% cut on the employees’ portion of Social Security taxes (which threatens to accelerate the programs demise), he has offered nothing in the order of permanent tax reductions or reforms.

From Taxing the Rich

Between 2003 and 2011, married couples with taxable income equivalent to $250,000 today are accustomed to an average rate of 24.0%; those earning $1,000,000 have incurred an average of 32.0%; and those earning $10,000,000 are accustomed to paying an average tax of 34.7% of taxable income (see table below).

From Taxing the Rich

Pressing On

“Nothing in this world can take the place of persistence. Talent will not; nothing is more common than unsuccessful people with talent. Genius will not; unrewarded genius is almost a proverb. Education will not; the world is full of educated derelicts. Persistence and determination alone are omnipotent. The slogan ‘press on’ has solved and always will solve the problems of the human race.” ~Calvin Coolidge

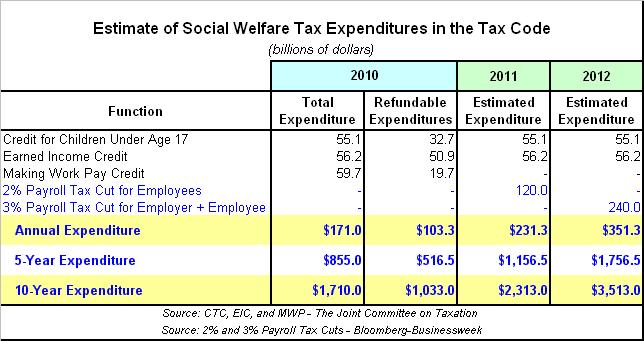
When a taxpayer has enough deductions and credits to not owe any income tax, that should be the end of the matter, but that’s not the case today. No. Ever since enactment of the Earned Income Credit in 1975, followed by the Child Tax Credit in 1997, the federal income tax has become one of the government’s primary tools for the redistribution of wealth. Today, billions of dollars are transferred from one taxpayer to another before the funds ever reach federal coffers. Nowadays, a family with no tax liability at all may receive a “tax refund” of as much as $8,000 per year. This is most outrageous, and a matter which should be on the table for Congressional reform today, not tomorrow. In fact, on September 2, 2011, the Treasury Department’s Inspector General for Tax Administration reported that, in 2010, $4.2 billion in refundable credits were paid to individuals not even authorized to work in the United States. The federal government’s days of sitting around begging for more tax revenue, while recklessly giving away the dollars we currently pay are over.

When we examine the tax rates levied on upper incomes since the Revenue Act of 1913, we find that the average rate paid by married couples with taxable income equivalent to $250,000 today is 23.3%, while those earning $1,000,000 have paid an average tax of 38.6%; and those earning $10,000,000 have paid an average rate of 55.7%. The weighted averages are essentially the same, at 23.3%, 38.6%, and 55.8%, respectively (see table below).

From Taxing the Rich

But of course, if we take into account the first 137 years of American history prior to 1913, when the income tax was for the most part nonexistent, the historically weighted averages are actually significantly lower. We must never forget that out of 236 years of American history, the United States has only put up with an income tax for 110. That’s why many American’s are pressing towards a return to the low rates of Coolidge, while some long for the rates promised in 1913, and still others for repeal of the 16th Amendment.

Today we have Barack Obama, a man who seems curiously decoupled from any sense of American history. By repeatedly delivering the same broken record speech about raising taxes on millionaires and billionaires, while simultaneously proposing to apply the top tax rate to those earning $250,000, Obama has made himself the laughing stock of POTUS’. What gives? Did he miss the 1960’s, 1970’s, or 1980’s? Perhaps Obama was living outside of the country during a key decade, missing a segment of history that most Americans my age remember. I would suggest to Obama or anyone else proposing a radical change in U.S. tax policy, to first learn something about American tax history, and then proceed with caution. We must never forget that it was ‘taxation without representation’, an act of tyranny, which led to the first American Revolution.

Since 1913, the highest average tax rate assessed on taxable incomes of $250,000 has been 32.2%, during precarious times, the lowest 1.3%, and the historical weighted average 23.3%. So with that in mind, one can only imagine where Barack Obama is coming from as he delivers speech after speech hinting at raising taxes on millionaires and billionaires, a feat he portends to accomplish through ushering those making $250,000 into the top tax bracket. If we can learn anything from the past, it should be clear that tax rates on incomes of $1,000,000, $10,000,000 or more are lagging behind their historical weighted averages, while rates on those making $250,000 are within tolerance. So where’s the legislation spelling out the addition of upper brackets on those making millions and billions per year? Obama should either place a proposal in line with his rhetoric on the table, or simply step aside.

From Taxing the Rich

References / Related:

Taxing the Rich, Part I

Taxing the Rich, Part II

Spreadsheets: Historical Income Tax Data

Images: Tax Tables and Charts

Tax Foundation – Income Tax Tables: 1913 to 2011

Tax Acts of the United State, 1861 through 2010

The Origin of the Income Tax

Quick Revolutionary War Tour 1765-1777

#Taxes

CPI Adjusted Dollars:

http://www.measuringworth.com/uscompare/

http://www.dollartimes.com/calculators/inflation.htm

Taxing the Rich – 1765 to 2011, Part II

– War and Taxes: 1873 to 1963

– By: Larry Walker, Jr. –

“A wise and frugal government, which shall leave men free to regulate their own pursuits of industry and improvement, and shall not take from the mouth of labor the bread it has earned – this is the sum of good government.“ ~Thomas Jefferson

From Taxing the Rich

In the post-Civil War years, a booming economy produced tariff surpluses for decades. However, Democrat members of Congress, not wanting to give up on the pursuit of legalized theft, introduced sixty-eight income tax bills between the years of 1874 and 1894. It was in the midst of the Panic of 1893 that an amendment to the Wilson-Gorman Tariff Act of 1894 was passed, establishing a 2.0% tax on all incomes above $4,000 per year (about $104,000 today). The amendment would have exempted from taxation the salaries of state and local officials, federal judges, and the president.

Believing the income tax to be unconstitutional, President Grover Cleveland refused to sign it. The Act became law in 1894 without his signature, but was ruled to be unconstitutional in the following year. In 1895, the Supreme Court ruled 5-4 against the income tax, stating that its provisions amounted to a direct tax, which was prohibited by the U.S. Constitution. Prior to the 16th Amendment, a direct tax could only be levied if apportioned among the states according to the census, a concept that America could easily restore through its repeal.

Article I, Section 8: The Congress shall have Power To lay and collect Taxes, Duties, Imposts and Excises, to pay the Debts and provide for the common Defence and general Welfare of the United States; but all Duties, Imposts and Excises shall be uniform throughout the United States.

Article I, Section 9: No capitation, or other direct, Tax shall be laid, unless in Proportion to the Census or Enumeration herein before directed to be taken. [This section was changed in 1913 by passage of the 16th Amendment.]

Thus America remained the land of the free, free of income taxes from 1873 through 1912. But behind the scenes, the Democrat Party was fast at work, conjuring legislation which would ultimately destroy the freedoms won by Americans in 1776. Democrats proposed a constitutional income tax amendment in their party platforms of 1896 and 1908. Theodore Roosevelt endorsed both an income tax and an inheritance tax, and in 1908, became the first President of the United States to openly propose that the political power of government be used to redistribute wealth.

In 1909, the income tax amendment passed overwhelmingly in the Congress and was sent off to the states. The last state ratified the amendment on February 13, 1913. The Sixteenth Amendment owes its existence mainly to the West and South, where individual incomes of $5,000 or more were comparatively few. Sold to the public as mainly a tax on the rich, the income tax initially applied to less than 1.0% of the population, but that would be short lived. The aspirations of power hungry, greedy and wasteful politicians would soon change the federal government into the conundrum it is today.

“Government’s view of the economy could be summed up in a few short phrases: If it moves, tax it. If it keeps moving, regulate it. And if it stops moving, subsidize it.” ~Ronald Reagan

Those hornswoggled by today’s Democrat Party, having been indoctrinated in the tired old “tax the rich” mantra of the early 20th Century, will eventually find themselves mired in an infinite array of new taxes: energy taxes, excise taxes, higher Social Security and Medicare taxes, mandated health care taxes, consumption taxes, value added taxes, and every imaginable form of regressive fine and fee. From 1776 to the present, a battle has been waged to determine the government’s fair share of a private citizen’s earnings, and it will continue until government is finally restored to its Constitutional limitations.

The Revenue Act of 1913

In April of 1913, President Woodrow Wilson summoned a special session of Congress to confront the perennial tariff question. He was the first president since John Adams to make an appeal directly to Congress. Under the guise of reducing tariffs, the Act turned out to be nothing more than a means of reinstituting a federal income tax. The argument followed that since a reduction in tariff duties would lead to lost revenue, an income tax would be required to makeup the shortfall. We should be mindful of this as Barack Obama attempts to twist arms during his upcoming special session.

The 1913 Act appealed to those of the “tax the rich” mentality. Its progressive rates were similar to our modern day model, with the exception that it contained 7 tiers and a top rate of 7.0%, versus the present 6 tiers with a top rate of 35.0%. Marginal tax rates, under the 1913 Act, ranged from just 1.0% up to 7.0%. And since a married couple was allowed an exemption of $4,000, which was more than most people earned, most of the population was exempt. At the time, less than 1.0% of the population was subject to the tax, which helps to explain how the 16th Amendment achieved ratification: i.e. “It won’t affect me, so why should I care?” The largest proportion of the tax was targeted to those with incomes higher than anyone could imagine, as at the time, the top bracket of $500,000 was the equivalent of more than $10,000,000 today.

From Taxing the Rich

In 1913, a married couple with taxable income equivalent to $250,000 today would have paid a tax of just 1.0%; those earning $1,000,000 would have paid a tax of 1.6%; and those earning $10,000,000 would have incurred a tax rate of just 4.9% (see table below).

From Taxing the Rich

The War Revenue Act of 1917

World War I commenced on July 28, 1914 and lasted until November 11, 1918. Since the income tax was initially imposed as a means to fund war (1861), its original intent, now combined with an element of wealth redistribution, lead to one of the most convoluted tax rate schedules of all time. The War Revenue Act of 1917 expanded the tax rate schedule from 7 to 56 tiers. Rates were hiked to a range of 6.0% to 77.0% in 1918. The 1918 tax rate schedule was so convoluted that taxpayers were thrown into a higher bracket with every $1,000 to $2,000 of additional income.

From Taxing the Rich

Under the 1918 Act, a married couple with taxable income equivalent to $250,000 today would have paid a tax of 12.9%; those earning $1,000,000 would have paid a tax of 25.7%; and those earning $10,000,000 would have incurred a tax rate of 66.9% (see table below).

From Taxing the Rich

The Mellon Tax Bill (1924 – 1931)

Although the war ended in 1918, income taxes were not significantly reduced until 1924. In 1919 the top rate was gradually lowered to 73.0%, then to 58.0% in 1922, and to 46.0% under the Mellon Bill of 1924. By 1924, the tax rate schedule contained just 43 tiers compared to 56 in 1918. The bottom rate also gradually declined from 6.0% in 1918 to 2.0% in 1924. Then in 1925, under the leadership of President Calvin Coolidge, the bottom rate was reduced to 1.5%, the top rate slashed to 25.0% with a reduced top bracket, and the tax rate schedule was simplified to 23 tiers from 43.

Finally, common sense had returned. It was peacetime, and with taxes greatly reduced, the “Roaring Twenties” ensued. Although Coolidge didn’t cut top rates back to 7.0%, the lower rates he put in place, lasting from 1925 through 1931, have never been matched since. Coolidge had it right when he proclaimed that, “Collecting more taxes than is absolutely necessary is legalized robbery.”

From Taxing the Rich

Even before being elected President of the United States, the former Governor of Massachusetts understood and opined that, “There is a limit to the taxing power of a State beyond which increased rates produce decreased revenue. If that be exceeded intangible securities and other personal property become driven out of its jurisdiction, industry cannot meet its less burdened competitors, and no capital will be found for enlarging old or starting new enterprises. Such a condition means first stagnation, then decay and dissolution. There is before us a danger that our resources may be taxed out of existence and our prosperity destroyed.” ~Calvin Coolidge (Address to the General Court beginning the 2nd year as Governor of Massachusetts January 8, 1920)

By 1925, a married couple with taxable income equivalent to $250,000 today would have paid a tax of just 4.9%; those earning $1,000,000 would have paid a tax of 14.4%; and those earning $10,000,000 would have incurred a tax rate of 23.9% (see table below).

From Taxing the Rich

Revenue Acts of 1932 to 1940

In the midst of the Great Depression, President Herbert Hoover relapsed, imposing higher tax rates and expanding the number of tax brackets from 23 to 55. In 1932, the bottom rate was increased from 1.5% to 4.0%, and the top rate was hiked from 25.0% to 63.0%. The tax rate on upper brackets was later increased to 79.0%, by FDR, in 1936, where it would remain through 1940. Hoover had in effect reinstated wartime tax rates during a time of peace. Errantly believing that higher taxes would increase government revenue, Hoover was the first president to prove that raising taxes during a recession only prolongs the downturn. Thanks to Hoover, and his successor Franklin Roosevelt, the Great Depression wouldn’t end until America entered the 2nd World War.

From Taxing the Rich

In 1932, a married couple with taxable income equivalent to $250,000 today would have paid a tax of 8.6%; those earning $1,000,000 would have paid a tax of 21.8%; and those earning $10,000,000 would have forked over 54.8% of their taxable income (see table below).

From Taxing the Rich

Revenue Acts of 1941 to 1963

The next major tax hike would occur in 1941, with rates remaining at accelerated levels through 1963. After Hoover opened the door, FDR removed the hinges, gradually raising rates from the bottom up. President Franklin Roosevelt believed and stated that, “Taxes, after all, are dues that we pay for the privileges of membership in an organized society.” This would mark a critical turning point in American history, as the purpose of the income tax had shifted from a temporary means to fund the Civil War, to a measure reinforcing lower tariff duties, to the price of living under the rule of a tyrannical dictator.

Following suit, bottom tax rates were raised from 4.0% in 1932, to 10.0% in 1941, to 19.0% in 1942, and to a record high of 23.0% in 1944. His successor, Harry Truman, would continue the tradition. After initially lowering the bottom rate to 20.0% in 1949, Truman raised it to 20.4% in 1951 and to 22.2% in 1952. The bottom rate was then locked in at 20.0%, by President Dwight Eisenhower, where it remained from 1954 through 1963.

The top rate was likewise increased by FDR, climbing from 63.0% in 1932, to 79.0% in 1936, 81.0% in 1941, 88.0% in 1942, and to a record high of 94.0% in 1944 during the 2nd World War. Truman later lowered the top bar to 91.0% in 1946, and then raised it yet again to 92.0% in 1952. Eisenhower would fix the top tier at 91.0%, where it would remain from 1954 through 1963.

From Taxing the Rich

In 1941, a married couple with taxable income equivalent to $250,000 today would have paid a tax of 23.1%; those earning $1,000,000 would have paid 46.9%; and those earning $10,000,000 would have forked over 71.0% of their taxable income (see table below).

From Taxing the Rich

During the entire 23 year period, a married couple with taxable income equivalent to $250,000 today would have faced an average tax rate of 32.2%; those earning $1,000,000 paid an average tax of 57.6%; and those earning $10,000,000 would have forked over a whopping 85.5% of their taxable income (see table below).

Summary

“The government should create, issue, and circulate all the currency and credits needed to satisfy the spending power of the government and the buying power of consumers. By adoption of these principles, the taxpayers will be saved immense sums of interest. Money will cease to be master and become the servant of humanity.” ~Abraham Lincoln, 16th US President (1809-1865)

From Taxing the Rich

During the first 51 years after reinstatement of the income tax, from 1913 to 1963, the bottom rate commenced at 1.0%, peaked at 23.0%, and settled at 20.0%. Meanwhile, the top rate was nudged in at 7.0%, peaked at 94.0%, and ended the period at 91.0%. Imagine being in the top tax bracket with an opportunity to make an extra $1 million, and facing the prospect of handing over $910,000 of it to the government, while clutching to a paltry $90,000. Was that fair? Does it sound like a plan for economic prosperity and jobs growth? As we shall see, neither John F. Kennedy nor Ronald Reagan thought so.

The average rates on the wealthy during each significant wave between 1913 and 1963 are shown above. It is important to understand that a small imposition, upon the rich, blossomed into grand theft taxation. That’s what happens when citizens allow a government to act without restraint. Those seeking to usher couples with taxable income of $250,000 into the upper echelons of taxation should recognize that the highest tax rates ever assessed at this level, when wartime taxes were at a peak, averages out to 32.2%, while pre-1941 averages were below double digits.

It’s time for America to return to her roots. We cannot and will never again allow our government to lead us, as blind men, into the abyss. To raise taxes on one is to raise them on all. Those who believed they would always be exempt from taxes, in 1913, would soon find themselves paying nearly three times the rate initially assessed on the wealthy. Today, every worker is subject to Social Security and Medicare taxes totaling 15.3% (temporarily 13.3%), a rate which is more than double that paid by the wealthiest Americans under the Revenue Act of 1913. There is no escape; you’re either for higher taxes, or lower taxes. Don’t believe the lie. Those advocating higher taxes on the rich have always and will always ultimately raise them on every soul, from the bottom up.

To be continued… Taxing the Rich – 1765 to 2011, Part III

References / Related:

Taxing the Rich – 1765 to 2011, Part I

Spreadsheets: Historical Income Tax Data

Images: Tax Tables and Charts

Tax Foundation – Income Tax Tables: 1913 to 2011

Tax Acts of the United State, 1861 through 2010

The Origin of the Income Tax

Quick Revolutionary War Tour 1765-1777

#Taxes

CPI Adjusted Dollars:

http://www.measuringworth.com/uscompare/

http://www.dollartimes.com/calculators/inflation.htm

Taxing the Rich – 1765 to 2011, Part I

War and Taxes: 1765 to 1872

– By: Larry Walker, Jr. –

“There is a limit to the taxing power of a State beyond which increased rates produce decreased revenue. If that be exceeded intangible securities and other personal property become driven out of its jurisdiction, industry cannot meet its less burdened competitors, and no capital will be found for enlarging old or starting new enterprises. Such a condition means first stagnation, then decay and dissolution. There is before us a danger that our resources may be taxed out of existence and our prosperity destroyed.” ~Calvin Coolidge

From Taxing the Rich

The American Revolution was the product of war and taxes. There are few topics more cantankerous, for war has oft been used as an excuse to enslave a populace through taxation, and unfair over-burdensome taxes have oft led to war. With the United States government’s passage of the quixotic Affordable Care Act of 2010, which would regulate the lives of every man, woman and child from cradle to grave, and add a new set of taxes and mandates; the Tea Party revolution was reborn. Elected officials who take the movement flippantly are likely to find themselves buried in the trash heap of human history.

In 1765, Great Britain imposed a series of taxes upon the American Colonies, in order to pay for its lengthy French and Indian War (1754-1763). After the war, the British forced upon the Colonies, the Stamp Act of 1765, requiring the purchase of tax stamps for any printed documents including newspapers, legal documents, marriage licenses and more. This was followed by the Townshend Acts of 1767 which were passed: to raise revenue in order to pay the salaries of governors and judges so that they would be independent of colonial rule; to create a more effective means of enforcing compliance with trade regulations; to punish the province of New York for failing to comply with the 1765 Quartering Act; and to establish as precedent the British Parliament’s right to tax.

Just like the Tea Party Movement of today, our founding fathers resented insidious taxes and regulations imposed upon them without their consent. Then as now, it is simply a matter of ‘taxation without representation’, an act which early Americans likened to tyranny. By 1773, when the East India Company was granted a virtual monopoly on the importation of tea, it was the last straw. In protest, a group of Boston citizens disguised as Mohawk Indians boarded a ship and dumped 342 chests of tea into Boston harbor. The Revolutionary War ensued, and the United States of America was born. Today, the Affordable Care Act is only a symptom of the disease. The disease being: over-regulation, over-burdensome covert and overt taxes, unsustainable federal debt, and a small minority of ideologues with socialist tendencies forcing its will upon the people.

“Collecting more taxes than is absolutely necessary is legalized robbery.” ~Calvin Coolidge

Far-left demagogues often speak in platitudes, but the utopian paradise they seek, through raising taxes on millionaires and billionaires, is a myth. Behind closed doors, they secretly plot to raise taxes on every soul, from the bottom up. They seem to have no recollection of American history, a history in which Americans have only been subject to an income tax for 110 out of 236 years. The United States has only endured an income tax between the years of 1862 to 1872, and 1913 through 2011. The income tax was initially spawned to fund the Civil War, errantly raised during the Great Depression, hiked to the max during both World Wars, and is today being exploited by left-wing politicians whose only goal is to reduce American exceptionalism to a failed, redistributive, collectivist state.

Ever since the income tax was introduced in the United States, the balance has tilted between having no income tax at all, to a top marginal rate of 94.0% (1944); and from a top tax bracket of $15,200 in 1867, to $79,412,681 in 1936 (in today’s dollars). In this series, we will examine the tax rate schedules in use from 1861 through 2011, and in so doing, will uncover the rates levied on incomes of $250,000, $1,000,000, and $10,000,000, throughout U.S. history. We will discover how the purpose of the income tax has shifted from a means to fund war, to an apparatus of wealth redistribution.

We will determine the average historical tax rates, and weighted average tax rates imposed upon upper incomes. We shall learn that throughout American history, an income of $250,000 has been taxed at an average historical rate of 23.6%. We shall hopefully gain some sense of what the term “fair tax” really means, as for some no income tax at all is considered fair, while for others a tax of 94.0% upon the rich is deemed just. Yet we believe as Calvin Coolidge, John F. Kennedy, Ronald Reagan, and George W. Bush believed, that ‘there is a limit to the taxing power of a State beyond which increased rates produce decreased revenue, and that if taxes are too high America’s resources may be taxed out of existence and our nation’s prosperity destroyed’.

The Revenue Act of 1861

The first income tax levied by the United States Government was imposed to fund the Civil War (1861). Prior to this, the government was funded strictly through customs duties, tariffs levied on imported goods. During the War of 1812, the government experimented briefly with excise taxes on certain goods, commodities, housing, slaves and land, but a tax on income was out of the question. What is significant is that prior to 1861, or for the first 86 years of American history, whether a citizen had an annual income of $800, $250,000, $1,000,000 or $10,000,000, every dime was considered to be private property of the individual, and not subject to any federal claim.

The Revenue Act of 1861 included the first U.S. Federal income tax statute. It introduced the federal income tax as a flat rate tax. The income tax was to be “levied, collected, and paid, upon the annual income of every person residing in the United States, whether such income is derived from any kind of property, or from any profession, trade, employment, or vocation carried on in the United States or elsewhere, or from any other source whatever”. Rates under the Act were 3.0% on income above $800 ($20,400 in 2011 inflation adjusted dollars) and 5.0% on income of individuals living outside the country.

From Taxing the Rich

Under the 1861 Act, a married couple earning the equivalent of $250,000 (in 2011 dollars) would have paid a tax of just 2.8%; those earning $1,000,000 would have paid 2.9%; and those earning $10,000,000 would have incurred a tax rate of just 3.0% (see table above).

It is important to note that: (1) America’s first income tax was a flat rate tax, (2) it was meant to be temporary, with the proceeds used solely to fund the Civil War; (3) for the preceding 86 year period, personal income of American citizens was not subject to any federal tax; and (4) that no revenue was ever raised under the 1861 Act, because it was revised (on June 30, 1862) before any tax was due.

The Revenue Act of 1862

In 1862, the initial Revenue Act was revised to reflect the first progressive rate tax in U.S. history. The office of the Commissioner of Internal Revenue was established. The Act specified that the Federal income tax was a temporary measure that would terminate in the year 1866. Annual income of U.S. residents, to the extent it exceeded $600 ($13,400 in 2011 dollars), was taxed at a rate of 3.0%; those earning over $10,000 per year ($224,000 in 2011 dollars) were taxed at a 5.0% rate. With respect to the income tax liability generated by the salaries of “officers, or payments to persons in the civil, military, naval, or other employment or service of the United States, including senators and representatives and delegates in Congress,” the law also imposed a duty on paymasters to deduct and withhold the income tax, and to send the withheld tax to the Commissioner of Internal Revenue.

Under the Revenue Act of 1862, a married couple earning the equivalent of $250,000 (in 2011 dollars) would have paid a tax of just 3.4%; those earning $1,000,000 would have paid 4.6%; and those earning $10,000,000 would have incurred a tax rate of just 5.0% (see table below).

From Taxing the Rich

The Revenue Act of 1864

Since in 1862 the Union War Debt stood at $505 million, and since the income tax only raised $2.7 million in 1862 and $20.2 million in 1863, rates were raised in 1864. The 3.0% tax on incomes above $600 ($8,590 in 2011 dollars due to devaluation) was increased to 5.0%, a new 7.5% rate was introduced on incomes over $5,000 ($71,600 in 2011 dollars), and the old rate of 5.0% on incomes above $10,000 ($143,000 in 2011 dollars) was raised to 10.0%.

Under the Revenue Act of 1864, a married couple earning the equivalent of $250,000 (in 2011 dollars) would have paid a tax of just 7.7%; those earning $1,000,000 would have paid 9.4%; and those earning $10,000,000 would have incurred a tax rate of just 9.9% (see table below).

From Taxing the Rich

Ending the Income Tax (1865 to 1872)

When the Act finally expired, the United States was again without an income tax; a condition that would last from 1873 until 1912, adding another 40 years to our tax-free heritage. By 1865, the 7.5% rate was increased to 10.0% leading to the highest tax rates for the period. By the end of 1866, when it was to have expired, the income tax was instead gradually phased out. The top rate was lowered to 5.0% between 1867 and 1869, and then to 2.5% from 1870 to 1872 (see tables below).

Between 1865 and 1866, a married couple earning the equivalent of $250,000 (in 2011 dollars) would have paid a tax of 8.4%; those earning $1,000,000 would have paid 9.6%; and those earning $10,000,000 would have incurred a tax rate of 10.0% (see table below).

From Taxing the Rich

Summary

“The freedoms won by Americans in 1776 were lost in the revolution of 1913.” ~Frank Chodorov

During the first 137 years of American history (1776 – 1912), the income tax only existed for 11 years, while no income tax was imposed upon private citizens for 126 years. The highest tax rate assessed on married couples occurred between 1865 and 1866, when those earning the equivalent of $250,000 (in 2011 dollars) paid a tax of 8.4%, those earning $1,000,000 paid 9.6%, and those earning $10,000,000 incurred a tax rate of just 10.0%. In the current tax debate, those caterwauling for higher taxes on the wealthy should, if it is within them, remember their own heritage. An understanding of the origin of the American income tax system, its original intent and early rates, is essential to any meaningful dialogue.

To be continued… Taxing the Rich – 1765 to 2011, Part II

References / Related:

Spreadsheets: Historical Income Tax Data

Images: Tax Tables and Charts

Tax Foundation – Income Tax Tables: 1913 to 2011

Tax Acts of the United States, 1861 through 2010

The Origin of the Income Tax

Quick Revolutionary War Tour 1765-1777

#Taxes

CPI Adjusted Dollars:

http://www.measuringworth.com/uscompare/

http://www.dollartimes.com/calculators/inflation.htm

Four More Trillion | Not Change

What? Obama Borrowed $4 Trillion in 2 1/2 Years?

By: Larry Walker, Jr. –

It was back on July 3, 2008 when Barack Obama exclaimed, “The problem is, is that the way Bush has done it over the last eight years is to take out a credit card from the Bank of China in the name of our children, driving up our national debt from $5 trillion for the first 42 presidents – #43 added $4 trillion by his lonesome, so that we now have over $9 trillion of debt that we are going to have to pay back — $30,000 for every man, woman and child. That’s irresponsible. It’s unpatriotic.”

Now, just two and a half years into his one-term proposition, Barack Obama has added $4 trillion to the national debt by his lonesome. So what does that make him? Today we have a national debt of $14.6 trillion that we are going to have to pay back — that’s $46,935 for every man, woman and child, and $130,786 for every U.S. taxpayer. It may be stated that Obama’s record on the national debt is 320 times more irresponsible, and 320 times more unpatriotic, no? But let’s just call it, “Not Change”. I know, I know, I can “go straight to Hell”, right Maxine Waters?

“You hypocrite, first take the plank out of your own eye, and then you will see clearly to remove the speck from your brother’s eye.” – Matthew 7:5

From Point of No Return

So what’s the plan, Stan? More ‘temporary’ shovel ready jobs? Overthrow another Libya? Form a government-run infrastructure bank (LOL)? Add another 99-weeks to unemployment benefits? Raise taxes on $250,000-aires? Form another debt commission? Raise the debt ceiling, raise the debt ceiling, raise the debt ceiling? Create a super-committee? Build a bullet train to nowhere? Tighten the noose around Gadaffi? Fix health care again? Another temporary Social Security tax cut? Extend the 100% bonus depreciation write-off on corporate jets and SUVs? Blame the Tea Party and Republicans? Give another speech? Take another bus tour to nowhere? Play another four-year round of golf?

Nah! I don’t think so. Looks like a one-term proposition to me, if that. Now it’s Obama vs. Obama. A kind of lose-lose hypothesis. Heck, this guy couldn’t even beat himself. We might as well bring Bush back. Or maybe we’d be better off without a President at all. How about a “none of the above” bubble on the next ballot? I’d rather have no President at all than four more years of misery. Hey Obama, why don’t you just do us all a favor by resigning right now?

It’s time for serious solutions. Give me something to die for. Give me a candidate I can stake my name and reputation on. Dazzle me with common sense. Show me how it’s really supposed to work. Rock my free-market world. Naturally, we independent small business types will be placing principles above personalities, so you best watch what you say, and do.

“A bill will be presented to the Congress for action next year. It will include an across-the-board, top-to-bottom cut in both corporate and personal income taxes. It will include long-needed tax reform that logic and equity demand … The billions of dollars this bill will place in the hands of the consumer and our businessmen will have both immediate and permanent benefits to our economy. Every dollar released from taxation that is spent or invested will help create a new job and a new salary. And these new jobs and new salaries can create other jobs and other salaries and more customers and more growth for an expanding American economy.”John F. Kennedy, Aug. 13, 1962, radio and television report on the state of the national economy.

Related:

Read more: John F. Kennedy on taxes

What Austerity? – Federal spending will hit a new record this year.

Just What We Need, A Government Bank – Outrage

Conn Carroll: Infrastructure bank is just another stimulus boondoggle

Obama’s Failed Jobs Subsidy | 99 Weeks

Photo via: http://ibloga.blogspot.com/2009/02/new-one-trillion-dollar-bill.html

Solving the Debt Crisis | A Catch-22

~ Pass The Monetary Reform Act ~

By: Larry Walker, Jr. ~

The Obama administration’s solution for the nation’s impending destruction, due to out-of-control deficit spending, is to increase the debt ceiling now, and worry about spending cuts later. The Obama administration is under the impression that more borrowing power will enable the nation to maintain its AAA Credit rating. The Catch-22 is that an instant increase in the debt ceiling will result in an instant downgrade to the nation’s credit rating. You see, the problem is not the level of the nation’s debt ceiling; the problem is America’s debt-to-GDP ratio. If raising the debt ceiling by $2.5 trillion would result in an equal increase in gross domestic product, then the problem would be solved. However, there is no verifiable link between government spending and economic growth.

The following passage, from Joseph Heller’s book, “Catch-22”, about sums up the whole zero-sum debt dilemma: “There was only one catch and that was Catch-22, which specified that a concern for one’s safety in the face of dangers that were real and immediate was the process of a rational mind. Orr was crazy and could be grounded. All he had to do was ask; and as soon as he did, he would no longer be crazy and would have to fly more missions. Orr would be crazy to fly more missions and sane if he didn’t, but if he was sane he had to fly them. If he flew them he was crazy and didn’t have to; but if he didn’t want to he was sane and had to.” The solution to Orr’s problem would be to simply end the war. Similarly, the solution to the National Debt problem is to simply end the Fed.

Obama and his supporters are basically saying, “You have to buy more government bonds, otherwise the bonds you already own will go into default.” In other words, the only way the government can continue to pay the interest on its $14.5 trillion National Debt is through incurring more debt. Like Orr in Heller’s Catch-22, Obama must be thinking: I have bankrupted the federal government and need to borrow more to keep from going broke. If we don’t raise the debt ceiling, the National Debt will be contained, but we will not be able to pay the interest on the current debt. If we raise the debt ceiling, we will increase our debt thus ensuring our demise, but if we don’t raise the debt ceiling then we must declare bankruptcy. If we raise the debt ceiling we will be bankrupt, and if we don’t raise the debt ceiling we will be bankrupt.

What AAA Rating? – While American politicians claim that their intention is to preserve the nation’s alleged AAA credit rating, Dagong Global Credit Rating Co., Ltd. (Dagong), China’s credit rating service, has already lowered its rating to A+/negative. Dagong initially assigned the United States a sovereign credit rating of AA in July 2010, but lowered this rating on November 3, 2010, when the U.S. Federal Reserve announced its QE2 monetary policy. In Dagong’s opinion, QE2 was “aimed at stimulating the U.S. economy through issuing an excessive amount of U.S. dollars”, which it saw as a sign of “the collapse of the U.S. government’s ability to repay its debt and a drastic decline of its intention to repay”. Dagong therefore downgraded the U.S.A.’s credit rating to A+/negative, and has since placed the sovereign credit rating of the United States on its Negative Watch List. But who cares about China’s credit rating service, right? After all, we only acknowledge Moody’s and S&P in the West, because we can always borrow from Europeans, right?

Unasked Questions – The questions that politicians have failed to consider in this entire futile debate are as follows:

Why is the government in debt? – The federal government is in debt because it has given its ability to create money over to the privately owned Federal Reserve, and to privately owned National Banks. Every time the government needs money, it must first borrow it from the Federal Reserve by exchanging bonds for cash. Why? If the government were to simply print its own currency, similar to Lincoln’s Greenbacks, then there would be no National Debt at all. So why not change this first? If the federal government were to pass the Monetary Reform Act, it would be able to payoff the entire National Debt within a year, and would simultaneously extinguish from its budget $400 billion per year in interest payments.

Where will the money come from? – When the Obama administration proposes to increase the National Debt by another $2.5 trillion, it’s most profound that no one is asking where the money will come from. So where will the money come from? The answer is out of thin air. That’s right. The money the government borrows is created out of thin air. But creating money out of thin air has consequences, namely inflation. When the Fed prints money and exchanges it for government bonds, the existing money supply is diluted, in other words, worth less. Who needs QE3, when you’ve got Obama-Year-3?

Dazed and Confused – Many, so called, conservatives seem to be confused on the matter of Monetary Reform. When we say, “Who cares about the banks, let them go broke”, they reply, “but banks are businesses and what you are proposing is anti-capitalism.” It’s funny that when it came to big bank bailouts, the same crowd who was chanting, “Let them go broke,” is now saying, “Don’t take away our precious banks.” I maintain that banks are not businesses. Banks produce no real goods or services; they merely buy, sell and hold debt. They also receive the largest government subsidy there is, the ability to create money out of thin air and to loan it out at interest.

Real businesses produce real products and services such as oil companies. Oil companies drill for oil and natural gas, and then refine it into tangible products sold to the public for profit. When politicians speak of taking away, so called, tax subsidies for oil companies, what they are really saying is that U.S. citizens should pay more in energy costs, not that oil companies should pay more in taxes. When we say, “End the Fed,” what we are really saying is, “End the National Debt”. When we say, “Raise bank reserve ratios from 0% to 10%, to 100%”, what we are saying is, “Take away the national banking system’s ability to create and loan out money that it doesn’t have.”

The Only Solution – Cutting taxes, reducing spending, raising taxes, and increasing spending are proposals which no matter how you structure them will not solve the real problem. Borrowing more to keep from going broke is not only absurd, it’s insane. So who’s kidding who? Passing the Monetary Reform Act will solve the National Debt problem and place America firmly on the road to recovery. In my opinion, there is no other solution.

Until there is reform, “Render unto Caesar the things which are Caesar’s, and unto The United States the things that are the Federal Reserve Bank’s.”

Photo Credit: World Crisis by Petr Kratochvil

The Monetary Reform Act of 201X | Authentic

The Two Step Plan to National Economic Reform and Recovery

Step 1: Directs the Treasury Department to issue U.S. Notes (like Lincoln’s Greenbacks; can also be in electronic deposit format) to pay off the National debt.

Step 2: Increases the reserve ratio private banks are required to maintain from 10% to 100%, thereby terminating their ability to create money, while simultaneously absorbing the funds created to retire the national debt.

These two relatively simple steps, which Congress has the power to enact, would extinguish the national debt, without inflation or deflation, and end the unjust practice of private banks creating money as loans (i.e. fractional reserve banking). Paying off the national debt would wipe out the $400+ billion annual interest payments and thereby balance the budget. This Act would stabilize the economy and end the boom-bust economic cycles caused by fractional reserve banking.

Monetary Reform Act – Summary

This proposed law would require banks to increase their reserves on deposits from the current 10%, to 100%, over a one-year period. This would abolish fractional reserve banking (i.e., money creation by private banks) which depends upon fractional (i.e., partial) reserve lending. To provide the funds for this reserve increase, the US Treasury Department would be authorized to issue new United States Notes (and/or US Note accounts) sufficient in quantity to pay off the entire national debt (and replace all Federal Reserve Notes).

The funds required to pay off the national debt are always closely equivalent to the amount of money the banks have created by engaging in fractional lending because the Fed creates 10% of the money the government needs to finance deficit spending (and uses that newly created money to buy US bonds on the open market), then the banks create the other 90% as loans (as is explained on our FAQ page). Thus the national debt closely tracks the combined total of US Treasury debt held by the Fed (10%) and the amount of money created by private banks (90%).

Because this two-part action (increasing bank reserves to 100% and paying off the entire national debt) adds no net increase to the money supply (the two actions cancel each other in net effect on the money supply), it would cause neither inflation nor deflation, but would result in monetary stability and the end of the boom-bust pattern of US economic activity caused by our current, inherently unstable system.

Thus our entire national debt would be extinguished – thereby dramatically reducing or entirely eliminating the US budget deficit and the need for taxes to pay the $400+ billion interest per year on the national debt – and our economic system would be stabilized, while ending the terrible injustice of private banks being allowed to create over 90% of our money as loans on which they charge us interest. Wealth would cease to be concentrated in fewer and fewer hands as a result of private bank money creation. Thereafter, apart from a regular 3% annual increase (roughly matching population growth), only Congress would have the power to authorize changes in the US money supply – for public use -not private banks increasing only private bankers’ wealth.

Support the Monetary Reform Act – write your Congressman today!

Read the full version of the Monetary Reform Act here.

If not now, when?

“I am a firm believer in the people. If given the truth, they can be depended upon to meet any national crisis. The great point is to bring them the real facts.” ~ Abraham Lincoln

“The ignorance of one voter in a democracy impairs the security of all.” ~ John F. Kennedy

Debt Mayhem | End Fractional-Reserve Banking

An Empire Built on Sand ~

~ By: Larry Walker, Jr. ~

Those of us who lived through the financial crisis of 2008 are most familiar with the drawbacks of fractional-reserve banking. It’s core theory, that wealth is created through debt, is now so ridiculously out of control, that every newborn American citizen today enters this world more than $46,000 in debt. Those naive enough to think that America’s most pressing problem started in January of 2001, or some other arbitrary date, need to look back a bit further, to 1913 to be precise. In America, taxpayers have been the suckers, while the “middle class” have been lulled into serfdom. But since we the people are no longer willing to perpetuate this fraud, the federal government, on our behalf, and at our expense, has volunteered to further prop up a broken and obsolete monetary system, yet the days of fractional-reserve banking are numbered.

What is fractional-reserve banking? – Fractional-reserve banking is a type of banking whereby a bank does not retain all of a customer’s deposits within the bank. Funds received by the bank are generally loaned out to other customers. This means that the available funds, called bank reserves, are only a fraction (reserve ratio) of the quantity of deposits at the bank. As most bank deposits are treated as money in their own right, fractional reserve banking increases the money supply, and banks are said to create money, literally out of thin air.

Fractional-reserve banking is prone to bank runs, or other systemic crisis, as anyone who has studied the American economy since 1913 is well aware. In order to mitigate this risk, the governments of most countries, usually acting through a central bank, regulate and oversee commercial banks, provide deposit insurance and act as a lender of last resort. If the banking system could only find a big enough sucker, one dumb enough to borrow say $14.4 trillion or more indefinitely, its prospects would be unlimited.

How does it work? – As an example, let’s say you work hard and are able to deposit $100,000 into Bank A. What does the bank do with your money? I mean if you wanted to withdraw it all in the following week, would it still be there? The answer is yes, and no. You see once you deposit your money, the bank immediately loans it out to someone else, likely keeping none of it in reserve, or at the most 10%. Let’s assume that Bank A is one of the mega-banks subject to the maximum bank reserve requirement of 10%. What happens is that the bank will hold $10,000 of your money either in its vault, or in a regional federal reserve bank, and will loan the other $90,000 to someone else.

Let’s say that Joe, a borrower, walks in to Bank A and applies for a $90,000 home loan on the day after you make your deposit. Bank A gladly gives Joe the $90,000 loan, at 5% interest over 30 years. When Joe closes on the loan, the $90,000 is paid to Jenn, the seller of the home. Jenn then deposits the $90,000 into her account at Bank B. Bank B keeps $9,000 of her money in reserve while lending out the other $81,000. Now let’s say that Jack comes along and secures an $81,000 business loan from Bank B on the day after Jenn makes her deposit. Now Jack deposits the $81,000 into his account with Bank C, and the cycle continues.

Bank A counts the $100,000 in your account as a liability, because it owes this amount back to you, and at the same time counts the $90,000 loan made to Joe, and the $10,000 held in reserve as assets. In effect Bank A has created a $90,000 loan asset for itself out of thin air. Fractional-reserve banks count loans as assets, and then earn their money through charging interest on this fictitious money. They also make money through repackaging loans as investments and selling them on the open market, potentially creating an even bigger fraud.

Following the money, your bank statement shows a balance of $100,000 at Bank A, Jenn’s bank statement reveals a balance of $90,000 with Bank B, and Jack has a balance of $81,000 on deposit with Bank C. The money supply has amazingly increased by $171,000 (90,000 + 81,000), through very little effort. Amazing, considering that the only real money introduced into the system was your initial $100,000 deposit. Through the system of fractional-reserve banking your original $100,000 has been magically transformed into $271,000 of liquid cash, while at the same time creating $171,000 of debt.

So what happens if you come back the following week to withdraw all of your money? Well first of all, Bank A will likely tell you that you need to give them several days notice before making such a large withdrawal, because in reality, they don’t have your money anymore. Bank A is then forced to do one of three things: borrow the money overnight from the Federal Reserve, or another member bank; sell some of its loans on the secondary market; or wait until another customer makes a $100,000 deposit – using $90,000 of that plus the $10,000 it held in reserve for you. If this sounds like a Ponzi scheme, it just might be.

Creating Wealth through Debt – The table below displays how loans are funded and how the money supply is affected. It shows how a commercial bank creates money from an initial deposit of $100,000. In the example, the initial deposit is lent out 10 times with a fractional-reserve rate of 10% to ultimately create $686,189 of commercial bank money. Each successive bank involved in this process creates new commercial bank money (out of thin air) on a diminishing portion of the original deposit. This is because banks only lend out a portion of the initial money deposited, in order to fulfill reserve requirements and to allegedly ensure that they have enough reserves on hand to meet normal transaction demands.

The model begins when the initial $100,000 deposit of your money is made into Bank A. Bank A sets aside 10 percent of it, or $10,000, as reserves, and then loans out the remaining 90 percent, or $90,000. At this point, the money supply actually totals $190,000, not $100,000. This is because the bank has loaned out $90,000 of your money, kept $10,000 of it in reserve (which is not counted as part of the money supply), and has substituted a newly created $100,000 IOU for you that acts equivalently to and can be implicitly redeemed (i.e. you can transfer it to another account, write a check on it, demand your cash back, etc.). These claims by depositors on banks are termed demand deposits or commercial bank money and are simply recorded on a bank’s books as a liability (specifically, an IOU to the depositor). From your perspective, commercial bank money is equivalent to real money as it is impossible to tell the real money apart from the fake, until a bank run occurs (at which time everyone wants real money).

At this point in the model, Bank A now only has $10,000 of your money on its books. A loan recipient is holding $90,000 of your money, but soon spends the $90,000. The receiver of that $90,000 then deposits it into Bank B. Bank B is now in the same situation that Bank A started with, except it has a deposit of $90,000 instead of $100,000. Similar to Bank A, Bank B sets aside 10 percent of the $90,000, or $9,000, as reserves and lends out the remaining $81,000, increasing the money supply by another $81,000. As the process continues, more commercial bank money is created out of thin air. To simplify the table, different banks (A – K) are used for each deposit, but in the real world, the money a bank lends may end up in the same bank so that it then has more money to lend out.

Although no new money was physically created, through the process of fractional-reserve banking new commercial bank money is created through debt. The total amount of reserves plus the last deposit (or last loan, whichever is last) will always equal the original amount, which in this case is $100,000. As this process continues, more commercial bank money is created. The amounts in each step decrease towards a limit. This limit is the maximum amount of money that can be created with a given reserve ratio. When the reserve rate is 10%, as in the example above, the maximum amount of total deposits that can be created is $1,000,000 and the maximum increase in the money supply is $900,000 (explained below).

Fractional reserve banking allows the money supply to expand or contract. Generally the expansion or contraction is dictated by the balance between the rate of new loans being created and the rate of existing loans being repaid or defaulted on. The balance between these two rates can be influenced to some degree by actions of the Fed. The value of commercial bank money is based on the fact that it can be exchanged freely as legal tender. The actual increase in the money supply through this process may be lower, as at each step, banks may choose to hold reserves in excess of the statutory minimum, or borrowers may let some funds sit idle, or some people may choose to hold cash (such as the unbanked). There also may be delays or frictions in the lending process, or government regulations may also limit the amount of money creation by preventing banks from giving out loans even though the reserve requirements have been fulfilled.

What are the Fed’s current reserve requirements? – According to the Federal Reserve, banks with less than $10.7 million on deposit are not required to reserve any amount. When deposits reach $10.7 to $58.8 million the requirement is just 3%. It’s only when deposits exceed $58.8 million that a 10% reserve requirement applies. The table below was extracted from the Federal Reserve’s website.

How much money can our banking system create out of thin air? – The most common mechanism used to measure the increase in the money supply is typically called the money multiplier. It calculates the maximum amount of money that an initial deposit can be expanded to with a given reserve ratio.

FormulaThe money multiplier, m, is the inverse of the reserve requirement R:

Examples

A reserve ratio of 10 percent yields a money multiplier of 10. This means that an initial deposit of $100,000 will create $1,000,000 in bank deposits.

A reserve ratio of 3 percent yields a money multiplier of 33. This means that an initial deposit of $100,000 will create $3,300,000 in bank deposits.

A reserve ratio of 0 percent yields a money multiplier of ∞ (infinity). This means that an initial deposit of $100,000 will create an unlimited amount of bank deposits.

What’s the problem? – The system works fine as long as everyone plays along. The biggest problem is that it’s a system by which wealth is only created through debt. Through this system, the lender always wins; while debtors – nowadays referred to as the middle class – always lose. As long as there are willing borrowers, our economy grows. When consumers, businesses, and the federal government stop borrowing, the system shuts down. But one cannot very well borrow into infinity; after all, life itself is finite. “There is a time to borrow, and a time to repay; a time to live and a time to die.” One definitely cannot borrow while lacking the means of repayment, unless of course, it has a seeming unlimited ability to tax.

The next biggest problem is that of absurdly low bank reserve requirements. With bank reserve requirements set at 0% to 10%, what could possibly go wrong? I mean besides banks having the ability to create an infinite supply of make-believe money through debt. The modern mainstream view of reserve requirements is that they are intended to prevent banks from:

  1. Generating too much money by making too many loans against the narrow money deposit base;
  2. Having a shortage of cash when large deposits are withdrawn (although the reserve is thought to be a legal minimum, it is understood that in a crisis or bank run, reserves may be made available on a temporary basis).

Let’s face the facts. Our present monetary policy is a disaster. When too many players wish to withdraw their money to hold as cash, or too many purchases are made overseas, or an excessive amount of loan defaults occur, the house comes crashing down. When all three events occur at the same time, as actually happened in 2008, it should have spelled the end of fractional-reserve banking. But instead, our leaders are in denial. Now “wealthy” U.S. taxpayers are being called upon to bailout the federal government, while at the same time, the government seeks more borrowing power. But when all our wealth is gone, who will rescue us then? And if the entire global monetary system has likewise been built on the same sinking sand, who will rescue them?

Well, hopefully you now have a better understanding of why our present monetary system is dysfunctional, why the federal government wants you to borrow more, and why it wants to borrow more itself. We are a nation built on a Ponzi scheme; one which cannot grow without incurring further debt. But as I said before, growth through debt amounts to nothing more than spending next year’s income today. Man does not live by debt alone.

What’s the solution? – We have to put an end to fractional-reserve banking. It should be clear, to all those with understanding that we need to get off of this merry-go-round. The first step is for the Federal government to take the power of money creation away from the Federal Reserve and from commercial banks by both issuing and controlling the quantity of its own currency (rather than Federal Reserve Notes). The second step is to increase bank reserve requirements to 100%, as banks should never again be allowed to loan out more money than actually on deposit. If there was a way to end the debt-money system and to payoff the national debt within a year or two, wouldn’t you want to know? For the details on how to accomplish this, I implore you to watch Bill Still’s full video entitled, The Secret of Oz (preview).

“Therefore everyone who hears these words of mine and puts them into practice is like a wise man who built his house on the rock. The rain came down, the streams rose, and the winds blew and beat against that house; yet it did not fall, because it had its foundation on the rock. But everyone who hears these words of mine and does not put them into practice is like a foolish man who built his house on sand. The rain came down, the streams rose, and the winds blew and beat against that house, and it fell with a great crash.” ~ Matthew 7:24-27 (NIV)

References:

Fractional-Reserve Banking

Principles of Monetary Reform

Federal Reserve: Monetary Policy