Obama Stumbles on Glass-Steagall

How Novel!

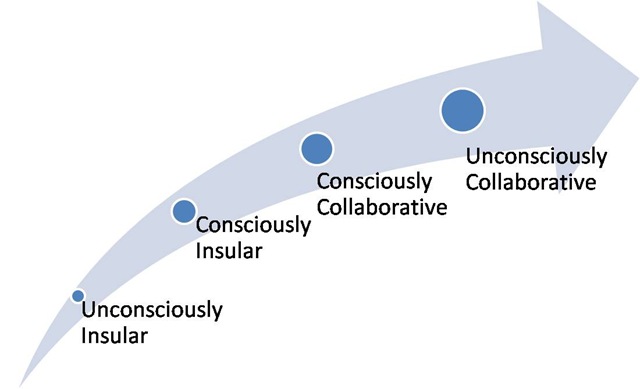
It looks like Barack Obama has reverted back to stage one of the Obama Learning Curve, ‘unconsciously insular’.

Click to Enlarge


His latest bright idea involves re-instituting the Glass-Steagall Act of 1933. Could this possibly be the same kind of overreaction which helped to prolong the Great Depression? After all, the Depression didn’t officially end until 1941. Obama constantly blames the 8 year Presidency of George W. Bush for our current economic woes, yet Glass-Steagall was repealed in 1999. I mean all you hear from this guy is the same tired whine about the ‘failed policies of the Bush Administration’. But then what does he do? He reverts to the failed policies of the FDR Administration.

Background

“In 1933, in the wake of the 1929 stock market crash and during a nationwide commercial bank failure and the Great Depression, two members of Congress put their names on what is known today as the Glass-Steagall Act (GSA). This act separated investment and commercial banking activities. At the time, “improper banking activity”, or what was considered overzealous commercial bank involvement in stock market investment, was deemed the main culprit of the financial crash. According to that reasoning, commercial banks took on too much risk with depositors’ money…”

I thought our current dilemma was caused by a housing related bubble, not by commercial banks investing too much money in the stock market. In our time, banks took on too much risk by investing in risky home loans. Loans which were promoted by ‘liberal’ politicians under the false ideology that it was somehow a Natural, God-given, Right for everyone to own a home.

Reasons for the Act – Commercial Speculation

“Commercial banks were accused of being too speculative in the pre-Depression era, not only because they were investing their assets but also because they were buying new issues for resale to the public. Thus, banks became greedy, taking on huge risks in the hope of even bigger rewards. Banking itself became sloppy and objectives became blurred. Unsound loans were issued to companies in which the bank had invested, and clients would be encouraged to invest in those same stocks.”

Hmmm. This doesn’t even sound remotely related to our present woes.

Effects of the Act – Creating Barriers

“Senator Carter Glass, a former Treasury secretary and the founder of the U.S. Federal Reserve System, was the primary force behind the GSA. Henry Bascom Steagall was a House of Representatives member and chairman of the House Banking and Currency Committee. Steagall agreed to support the act with Glass after an amendment was added permitting bank deposit insurance (this was the first time it was allowed).”

It is interesting to note that even Glass himself moved to repeal the GSA shortly after it was passed, claiming it was an overreaction to the crisis.

An Overreaction to the Crisis?

It seems to me that all Obama has done is to stumble upon a method of prolonging the economic crisis. Instead of embracing obvious policies which have helped America out of every single recession since World War II (i.e. across the board tax cuts, and allowing the free market to correct itself), Obama has not only failed to come up with new ideas, he has ‘dug up’ the old tried and failed policies of the 1930’s. And this is the guy you were waiting for?

Barack ‘Carter Glass’ Obama could do us all a favor by just getting out of the way. If he would just sit down and hush up, the free market will eventually reach equilibrium. Sometimes it’s best not to meddle. You know what they say, “Jack of all trades; Master of none.”

Finally, what was it again which finally broke the Great Depression?

“Only when the federal government imposed rationing, recruited 6 million defense workers (including women and African Americans), drafted 6 million soldiers, and ran massive deficits to fight World War II did the Great Depression finally end.”

Is it possible that the War on Terror was our salvation, and not a mistake?

____________________________________

http://www.nps.gov/archive/elro/glossary/great-depression.htm

http://www.investopedia.com/articles/03/071603.asp

Capital Homestead Act: A Plan for 2012

By: Larry Walker Jr.

“For a binary solution needed to restore free markets, private property and limited government, why not focus on getting political leaders to pass a Capital Homestead Act by 2012, the 150th anniversary of Lincoln’s Homestead Act?” – Norm Kurland

We have to cast down this insidious idea that a socialist (anti-free market) system is best, lest there be no free market left with which to institute Capital Homesteading. It is clear from the policies being implemented by the current administration, that Mr. Obama will not be our ally. We must work to defeat these anti-free market ideals in the 2010 and 2012 elections. And we will defeat them, one brick at a time.

But what do conservatives have to offer? There is a solution for saving Social Security and Medicare, for eliminating payroll taxes, and which will help all Americans to be able to provide for themselves. It’s called the Capital Homestead Act.

Summary

The Capital Homestead Act is a comprehensive national economic strategy for empowering every American citizen, including the poorest of the poor, with the means to acquire, control and enjoy the fruits of productive corporate assets.

This long-range agenda involves major restructuring of our tax system and our Federal Reserve policies to lift unjust artificial barriers to more equitable distribution of future corporate capital and faster growth rates of private sector investment. It would shift primary national income maintenance policies from inflationary wage and unproductive income redistribution expedients to market-based ownership sharing and dividend incomes.

The Capital Homestead Act’s central focus is the democratization of capital (productive) credit. By universalizing citizen access to direct capital ownership through access to interest-free productive credit, it would close the power and opportunity gap between today’s haves and have-nots, without taking away property from today’s owners.

The Goals of the Capital Homestead Act

As summarized below, the Capital Homestead Act is designed to:

  1. Generate millions of new private sector jobs by lifting ownership-concentrating Federal Reserve credit barriers in order to accelerate private sector growth linked to expanded ownership opportunities, at a zero rate of inflation.

  2. Radically overhaul and simplify the Federal tax system to eliminate budget deficits and ownership-concentrating tax barriers through a single rate tax on all individual incomes from all sources above basic subsistence levels. Its tax reforms would:

    • eliminate payroll taxes on working Americans and their employers;

    • integrate corporate and personal income taxes; and

    • exempt from taxation the basic incomes of all citizens up to a level that allows them to meet their own subsistence needs and living expenses, while providing “safety net” vouchers for the poor.

Read More Here…

The Real November Job Loss Number Was 255,000

Joe Weisenthal Dec. 4, 2009, 2:56 PM

Source: BusinessInsider.com

Just about every time the monthly jobs numbers comes out, economic research firm TrimTabs comes out and slams the government’s methodology, usually honing in on the Birth/Death model of new businesses entering the market.

This week is no exception.

Frankly, we’re not sure what to make of their arguments. We’ve been hearing about this Birth-Death issue for a long time, but unless you believe they’re changing their methodology from month to month, then that issue only goes so far.

We welcome your thoughts.

————

TrimTabs’ Estimates 255,000 Jobs Lost in November, While BLS Reports a Decline of Only 11,000

BLS Revises September and October Results Down a Whopping 45%

Something’s Not Right in Kansas!

TrimTabs employment analysis, which uses real-time daily income tax deposits from all U.S. taxpayers to compute employment growth, estimated that the U.S. economy shed 255,000 jobs in November. This past month’s results were an improvement of only 10.2% from the 284,000 jobs lost in October.

Meanwhile, the Bureau of Labor Statistics (BLS) reported that the U.S. economy lost an astonishingly better than expected 11,000 jobs in November. In addition, the BLS revised their September and October results down a whopping 203,000 jobs, resulting in a 45% improvement over their preliminary results.

Something is not right in Kansas! Either the BLS results are wrong, our results are in error, or the truth lies somewhere in the middle.

We believe the BLS is grossly underestimating current job losses due to their flawed survey methodology. Those flaws include rigid seasonal adjustments, a mysterious birth/death adjustment, and the fact that only 40% to 60% of the BLS survey is complete by the time of the first release and subject to revision.

Seasonal adjustments are particularly problematic around the holiday season due to the large number of temporary holiday-related jobs added to payrolls in October and November which then disappear in January. In the past two months, the BLS seasonal adjustments subtracted 2.4 million jobs from the results. In January, when the seasonal adjustments are the largest of the year, the BLS will add anywhere from 2.0 to 2.3 million jobs. In our opinion, trying to glean monthly job losses numbering in the tens of thousands or even in the hundreds of thousands are lost in the enormous size of the seasonal adjustments.

In November, the BLS revised their September and October job losses down a surprising 44.5%, or 203,000 jobs. In the twelve months ending in October, the BLS revised their job loss estimates up or down by a staggering 679,000 jobs, or 13.0%. Until this past month, these revisions brought the BLS’ revised estimates to within a couple percent of TrimTabs’ original estimates.

The large divergence between the two results begs the question of what is causing the difference. While we don’t have an answer today, we will be poring over the data in an attempt to answer that question.

A comparison of TrimTabs’ employment results versus the BLS’ results from January 2008 through November 2009 is summarized below.

click to enlarge

Source: TrimTabs Investment Researchhttp://www.trimtabs.com/ and Bureau of Labor Statistics – http://www.bls.com/

Several other employment related data statistics support the conclusion that the labor market is not as robust as the BLS is reporting:

  • Automatic Data Processing reported on Wednesday that 169,000 jobs were lost in November.
  • The Institute of Supply Management (ISM) Non-Manufacturing Survey reported that the majority of companies surveyed were still shedding employees.
  • The ISM Manufacturing Survey reported weaker employment conditions in November.
  • Weekly unemployment claims were 457,000 in the week ended November 27, 2009. While last week’s results were below the important psychological level 500,000, the weekly claims are still uncomfortably high and point to a contracting labor market.
  • The TrimTabs Online Jobs Index reported lower online job availability in the past three weeks.
  • The Monster Employment Index declined in November.

We will have the opportunity to truth our employment model estimates at the end of January 2010 when the BLS releases its annual benchmark revisions. The BLS revisions are based on actual payroll data for March 2009. The BLS revision is then divided by twelve to correct prior month’s data back to April 2008. We also use the March 2009 revisions to adjust our model inputs and make any necessary corrections.

For a complete analysis of the current employment situation and economic conditions, refer to TrimTabs Weekly Macro Analysis published this coming Tuesday, December 8, 2009

The Raw Truth: GDP vs National Debt

GDP vs National Debt – The Raw Truth

I am still mulling over the Bureau of Economic Analysis’ recent, erroneous, GDP projection after my last post Gross Domestic Product (GDP) Mumbo Jumbo. One aspect that was not addressed previously was the pace at which our National Debt is catching up to annual GDP.

The question for today is what will Gross Domestic Product need to be in 2019 in order to keep pace with the Federal Government’s ruinous spending? And based on the answer to that, at what pace must the economy grow annually?

click to enlarge

If we add the CBO’s 2010 to 2019 projected budget deficit of $7,137.0 billion to our current national debt of $12,087.3 billion, then the National Debt will total $19,224.3 billion by the year 2019. At the same time, GDP is averaging $14,198.5 billion annually. Thus, if our economy does not grow over the next 10 years, the National Debt will soon exceed GDP. [Note: GDP represents the amount that our economy can produce in a year.]

I know that the ‘hope and change’ crowd will say, “So what, It does not matter as long as the interest payments don’t exceed GDP”, or some other lame reasoning. However, I choose to look back to the days when the economy was growing at 5% per year with low unemployment. After all, surely America had some banner years in the past. The question should be, “how do we return to a more reasonable Debt-to-GDP ratio?” Not, “how far can we go before the economy breaks?”

Thus, the first scenario, below, determines the rate of growth necessary in order for GDP to match our projected debt. The second scenario determines the rate of growth needed in order to return to the 2003 debt-to-GDP ratio of 62.8%. Finally scenario three simply states the obvious.

Scenario #1 – The Road to Nowhere

GDP must grow from $14,198.5 to $19,224.3 billion in order to equal the National Debt by 2019. In other words, GDP must increase by $5,025.8 over the ten year period. This represents an increase of 35.4% for the period. That means that GDP must grow at a rate of 3.54% per year in order to equal our National Debt by 2019. As I clarified in my last post, GDP is currently declining at the rate of 1.21% per year, so although this is achievable, we still have a ways to go on this road to nowhere.

click to enlarge

Scenario #2 – Back to 2003

In order to return to the more prosperous, albeit not the most optimal, 2003 Debt-to-GDP ratio of 62.8%, annual GDP must grow to $30,611.9 by 2019. In other words, GDP must increase by $16,413.4 billion, over 10 years, in order for the National Debt to equal 62.8% of GDP. That equals a percentage increase of 116.0% over the 10 year period. In other words GDP must grow at the rate of 11.6% per year, over the next 10 years in order to return to the 2003 Debt-to-GDP ratio.

Scenario #3 – Stop Spending Money that we don’t have.

Of course there are many possible scenarios. One common sense scenario would be to stop spending money that we don’t have. I don’t think it’s possible to grow the economy at 11.6% per year. At least I don’t see any plans from the Congress, the Senate, or Obama that would come anywhere close. In fact, their current plans do nothing to increase GDP, but rather are focused shamefully on doubling the National Debt. And you know what that means: higher taxes, and higher interest rates, leading to less economic growth.

Conclusion

GDP must grow at an annual rate of 3.54% in order to equal the National Debt by 2019, a road to nowhere. GDP must grow at an annual rate of 11.6% in order to return to the 2003 Debt-to-GDP ratio of 62.8% by 2019. Government spending needs to be cut dramatically, and immediately. Any plan that falls short of scenarios #2 and #3 is not a plan. That’s the raw truth.

Sources:

GAO FINANCIAL AUDIT Bureau of the Public Debt’s Fiscal Years 2007 – 2008

CBO Budget Projections through 2019

Treasury Direct – Historical National Debt

Gross Domestic Product (GDP) Mumbo Jumbo

Give me a break!

by: Larry Walker, Jr.

Worthless Government Statistics

It was just back on November 3rd when the Bureau of Economic Analysis (BEA), a division of the U.S. Commerce Department, declared that Gross Domestic Product grew at an annual rate of 3.5% during the 3rd quarter of 2009. Then on November 23rd, the Bureau declared that the revised rate of growth for the 3rd quarter was only 2.8%. The question that came to mind, right away, was: What exactly does this mean?

Click to Enlarge

First of all what it does NOT mean is that the economy grew at the rate of 2.8% during the 3rd quarter of 2009. The rate of 2.8% is derived by taking the rate of increase from the 2nd quarter to the 3rd quarter of 0.70% and assuming that this will stay constant for the next 3 quarters (0.70% times 4). Why is this a bogus way of measuring the economy?

When I open my quarterly 401K statement and it reads that my portfolio has increased by 8.0% during the recent period, I don’t automatically assume that my annual rate of return is 32.0% (8.0% times 4). No, on the contrary, I look at the past four quarters to determine my annual return. If I lost 8.0% in the previous three quarters combined, and then gained 8.0% in the most recent quarter, then I am close to breaking even. But have I broken even? No.

To demonstrate, let’s assume my portfolio was valued at $100,000 at the end of the previous fiscal year. After declining by 8.0% in the succeeding three quarters, the value had dropped to $92,000 ($100,000 times 0.92). Now, after gaining 8.0% in the most recent quarter, the value of my portfolio has increased to $99,360 ($92,000 times 1.08). You will note that I have yet to break even. I am in fact still down by 0.64% ($640 divided by $100,000) having started with $100,000 and declined to $99,360 over the past four quarters. So much for growth. Now back to GDP.

GDP has declined by 1.42% over the past four quarters

Now when it comes to GDP, a more reasonable way to look at our present rate of growth, similar to measuring an investment portfolio, is to look at the past 4 quarters. Since the BEA only publishes figures in annual terms, I will approach this by using their figures, but keep in mind that the quarterly GDP figures are shown as annual amounts (in billions).

  • 4th Quarter 2008 – $14,347.3

  • 1st Quarter 2009 – $14,178.0

  • 2nd Quarter 2009 – $14,151.2

  • 3rd Quarter 2009 – $14,266.3

Dividing the above by four, the average GDP over the past four quarters is $14,235.7 billion. The final GDP figure for all of 2008 was $14,441.4. So GDP has dropped by $205.7 billion ($14,441.4 minus $14,235.7) over the past four quarters. That equals a percentage drop of 1.42% ($205.7 divided by $14,441.4) since 2008.

GDP has declined at the rate of 1.21% since 2008

An even more accurate way to look at this is to start with the 2008 total GDP of $14,441.4 billion and to measure the decline over the next three quarters. In this respect GDP declined by 1.82% in the 1st quarter of 2009, by another 0.19% in the 2nd quarter of 2009, and then improved by 0.80% in the 3rd quarter of 2009. Overall GDP has declined by 1.21% since 2008. This is the statistic that’s most meaningful to me.

GDP has declined at the rate of 1.21% since 2008. In dollar terms that’s $175.1 billion per year in lost production in our economy. That’s the equivalent of losing 3.5 million jobs paying $50,000 per year. That’s more meaningful to me than the BEA’s mumbo jumbo.

GDP growth averaged 4.93% per year from 2003 to 2008

While we are at it, you will note on the chart above that GDP was $11,142.1 billion in 2003 and grew to $14,441.4 billion in 2008. That’s an increase of 29.6% over the six-year period, or an average of 4.93% per year. It also represents an increase of $3,299 billion in U.S. production over the period. That’s the equivalent of an increase of around 65.9 million jobs paying $50,000 per year.

So wake me up when Obama’s economy killing policies have created 65.9 million jobs, or when GDP reaches $18,490.7 billion (an increase of 29.6% from today’s level), whichever comes first, but don’t bother me with meaningless government statistics.

Sources:

http://www.bea.gov/newsreleases/national/gdp/gdpnewsrelease.htm

http://www.bea.gov/newsreleases/national/gdp/2009/xls/gdp3q09_2nd.xls

Obama’s Cluelessian Economics – Obamanomics

By: Larry [Update: below in red]

As economists from across the globe are grappling to find a new name for Barack Obama’s economic policies, I have beat them to the punch. Cluelessian is Obama’s new model for future economic (failures). Thus, in an effort to ensure that others do not slip and fall down into the same bottomless pit, let me help you define the difference between Free Market Economics and Cluelessian Economics.

The two most basic concepts in free market economic theory are the laws of supply and demand. Under the law of supply as prices increase the quantity of goods and services increases, as additional investment is attracted into the market. Under the law of demand as prices decrease, the quantity of goods and services demanded increases, because more consumers are able to afford these goods and services. Where supply and demand meet is at the prevailing market price.

Now when a price is set below the prevailing market price in order control prices, less investment is attracted to produce the supply. Where the price is fixed as in the graph below, the quantity demanded is higher than the quantity supplied, thus creating excess demand, better known as shortages. And shortages lead to rationing.

On Health Care Reform

Under Cluelessian Theory, the laws of supply and demand didn’t work for everyone. Thus, what is being proposed with health care reform is an increase in the number of people covered by insurance through a legal mandate (demand), without increasing the price. This is only possible under the Cluelessian Model. In fact, under the new theory demand will increase, prices will decline, supply will decline (as insurance companies go bankrupt) and higher income taxes will make up the difference.

Under Cluelessian theory you actually wind up paying more for less, but that’s all right because higher taxes don’t count towards the price of health insurance, right? Also by following the Cluelessians we can get rid of all those evil, greedy doctors and insurance companies at the same time. So under Cluelessian theory it would appear that we would actually destroy the free market system, and create not only government run health insurance, but also government doctors and hospitals.

On Climate Change

Now when it comes to making an impact on the effects of that evil, and relentless Sun, that sits in the middle of our solar system spewing out all that heat, the laws of supply and demand just don’t quite cut it. So it will be necessary to dramatically reduce the supply of electricity, coal, natural gas, and gasoline; meaning that prices will necessarily ‘skyrocket’ (a Cluelessian axiom).

Cluelessian policies will necessarily call for a dramatic decline in the demand for energy. As the supply declines and businesses begin to lay off workers and shutter plants, and as people begin to freeze to death in their homes and to die of heat stroke, the Cluelessians will compensate by _______? (I don’t think they have thought this one all the way through.)

A. Raising taxes to help those who can no longer afford their energy bills?

B. Coming up with a nifty formula to demonstrate how many human beings they saved, or how many years of life they added to Planet Earth?

On Jobs

Under Cluelessian law, a job saved (or created) is equal to giving a pay raise to existing employees. Contemporary economists thought that a job saved entailed cancelling a layoff, or recalling laid off workers; and that a job created meant hiring new employees on top of the existing workforce. However, under Cluelessian theory, whatever makes you look good counts. As we saw recently in the news, the Southwest Georgia Community Action Council was able to save 935 jobs by providing a cost of living increase for only 508 people. (See the last post: Jobs and O-bonics Interpreted).

The Cluelessians haven’t yet been able to formulate a way to actually create jobs so please check back for updates over the next three (3) years.

[Update: The Cluelessians have just stated that a key part of their plan for job creation will involve housing Guantanamo terrorism detainees in U.S. prisons. Cluelessian economists are talking to Illinois officials about buying the Thomson Correctional Center, a maximum-security prison about 150 miles west of Chicago. A limted number of the remaining 215 Guantanamo detainees would be housed there which some Cluelessians are claiming could create up to 2,000 jobs. So now we have an even better understanding of how Cluelessian policies will impact future economic and social deterioration.]

Conclusion

So in conclusion it’s not very hard to understand Cluelessian Economics. Simply throw away the idea of a free market system. Forget about the laws of supply and demand. Under this new theory the Government will take care of all of us. The Government will supply our health care, energy, and employment needs. The Government will take the place of the free market. The Government is good, and we are bad. The Government knows all. And when the Government runs out of money, then under Cluelessian law, they will make up another lie (i.e. blame Bush).

Now if you want some real answers, you should check out The Just Third Way Blog, or The Center for Economic and Social Justice. You may even want to read, Capital Homesteading for Every Citizen or Binary Economics: The New Paradigm.

Related to and inspired by John Galt at: John Galt’s Wisdom Blog

3.5% Growth in the 3rd Quarter? No! Try 0.87%

Source: Trade and Taxes

Raymond L. Richman

The U.S. Bureau of Economic Analysis issued a misleading report when it announced October 29, 2009, that annualized Gross Domestic Product, measured in 2005 prices, increased 3.5 percent from the 2nd quarter 2009 to the 3rd Quarter of 2009. The fact is that annualized GDP in the 3rd quarter was $13,014 billion compared with $12,901 in the 2nd quarter , an increase of 0.872, less than one percent. The number, 3½ , asserted by the BEA was obtained by multiplying 0.872 by 4, in other words by extrapolating the rate of increase in the 3rd quarter for three additional future quarters, hardly a scientific way of prediction . What is worse, analysis of the data indicates no reason to expect any future growth of the economy at all.

Net private non-residential investment, the key to a growing economy, declined in the 3rd quarter. So did net exports. Exports increased but imports increased even more, resulting in a drag on the economy. Personal Consumption increased but that was due principally to a non-recurring factor, the “klunkers” rebate, a costly exercise in subsidized consumption which did more economic harm than good. We already have evidence that it was at the expense of sales in the succeeding period. Thus, it will contribute to a decline in the current quarter. And it will no doubt have a negative effect on auto repairs and maintenance expenditures. Although the administration claimed that it was intended as a stimulus to the economy, it was done at the urging of environmentalists wanting to reduce carbon emissions in the atmosphere. Personal Consumption may increase in the future but there was nothing in the 3rd quarter data to give any assurance that it will.

Personal consumption may grow if expectations about the future of the economy improve. Unfortunately, the data do not lend to the expectation of the economy’s growth. The real growth of the economy is dependent on fixed private investment. Private non-residential fixed investment fell, -1.88 percent in current dollars and -.636 percent in 2005 dollars. Multiply those by four!

The other principal contributor to economic growth is positive net exports. While exports of goods rose 4.65 percent in current dollars and 3.49 percent in 2005 dollars, imports increased faster, 6.43 percent and 3.86 percent respectively. This occurred in spite of a falling dollar which is supposed to increase exports and reduce imports. Multiply those numbers by four, too!

For years we have been warning that the growing trade deficits of the U.S. were a threat to the health of the U.S. economy. It caused the loss of millions of industrial jobs, depressed wages as the laid off industrial workers sought jobs in the service sector, and worsened the American distribution of income. It is urgent that we get trade into reasonable balance. If we succeed, the economy has a chance of recovering quickly because it would stimulate private investment , growth, and employment. These and other measures appear in our book, Trading Away Our Future (2008), which deals with the causes of and cures for the trade deficits.

The stock markets boomed on the news that GDP had grown at an annual rate of 3.5 percent. Pres. Obama and Dr. Romer, Chairwoman of the President’s Council of Economic Advisors, repeated the number. The latter should have known better. What should have been reported is that in the third quarter GDP rose, compared with the 2nd quarter, 1.06 percent in current dollars and 0.87 percent in 2005 dollars. The next day, after investors had time to read the release and the accompanying tables, the stock markets collapsed.

We have great respect for the Bureau of Economic Analysis and their statistical methods. But the extrapolation of the rate of growth into the future serves no purpose and adds nothing to the data and should be abandoned.

__________________________________________________

Link to BEA Report: http://www.bea.gov/newsreleases/national/gdp/gdpnewsrelease.htm

Note: It says, “Real gross domestic product…increased at an annual rate of 3.5 percent in the third quarter of 2009…” The use of the term Annual Rate means that GDP actually only rose by 0.87% during the 3rd Quarter of 2009. Thus, I concur. This is a shameful deception by the Obama Administration and he needs to be called on it.

It’s also debatable whether when annualizing GDP growth one should take the previous three quarters plus the current one, or as makes no sense here, take the current quarter and expand it out by three future quarters at the same rate.

I don’t see any consistency with this even with the BEA. In checking the BEA’s 2nd quarter report, for example, GDP decreased by -0.8% in the 2nd Quarter but the annualized decrease was stated as minus -1.0%, not minus -3.2% as would be apples to apples. So what’s up with that?

http://www.bea.gov/newsreleases/national/gdp/2009/gdp2q09_adv.htm