2011 Tax Increase : A Reality Check

Income Tax Reality Check

Compiled by: Larry Walker, Jr.

“If you make less than $250,000, you will not see your taxes increase by one dime.” ~ B. H. Obama

Left-wing pundits are claiming that the Bush tax cuts were for the wealthy, which is simply not true. Next year when the 10% tax bracket disappears, and tax rates return to pre-2001 levels, will represent an across the board tax increase affecting every American. In addition, the child tax credit will return from $1,000 (per child under age 17) to $500 representing a tax increase for everyone who has children, not the wealthy. The fact is that the Bush tax cuts applied to every American at every level of income, and when they expire taxes will rise from the bottom up.

In 2011, if you make over a nickel in taxable income, your taxes will increase a minimum of 9%, and as much as 50%. Since our tax rates are progressive, taxes on the first $16,750 for couples ($8,375 for singles) will increase by 50%. Taxpayers who make under $8,375 in taxable income will see the largest tax increase at 50%. Middle income earners will see their taxes rise by no less than 9%. The contention that the Bush tax cuts only affected the wealthy is a bald-faced lie. Similarly, the contention that Obama’s tax increases will only affect the wealthy is nothing but a fairy tale. Americans are educated and can comprehend income tax tables. You can choose to believe whatever you want, but reality should not be optional.

2010 Tax Brackets

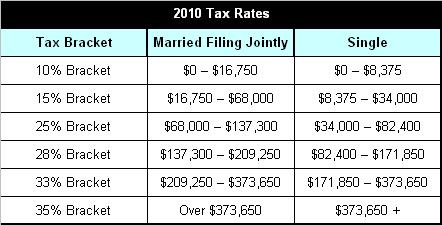
Nickel over at fivecentnickel.com has projected how the 2011 income tax brackets may look. The commentary below is attributed to Nickel. I have retouched his 2011 table (below), and added the 2010 table (above) for comparison.

Income tax bracket changes for 2011 – In case you weren’t aware, the Bush tax cuts of 2001 and 2003 are set to expire at the end of 2010. Thus, if Congress doesn’t act, the relatively low income tax rates that we’ve been enjoying (hah! enjoying?) will soon be a thing of the past. They will be replaced by the pre-2001 tax brackets.

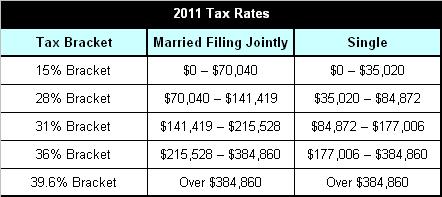
In other words, the 10%, 15%, 25%, 28%, 33% and 35% tax brackets that we’ve grown accustomed to will be replaced by 15%, 28%, 31%, 36%, and 39.6% brackets. It’s hard to say exactly where the income cutoffs will lie, but if we base the numbers on the 2010 income tax brackets and add 3% for inflation, the 2011 tax brackets might look something like this:

2011 Projected Tax Brackets

Capital gains tax changes in 2011 – Beyond the increased federal income tax brackets, the capital gains tax rates will also be changing (and not for the better). The top rate for long-term capital gains will be rising from 15% to 20%, and the 0% rate for those in the lowest tax brackets will be replaced by a 10% long-term capital gains rate.

Why worry about 2011 income tax changes? – Since the 2011 tax year is so far off, you might be wondering why we’re even talking about it right now. Well, as I noted above, the time to be planning for things like this is right now – before the changes go into effect as these potential income tax rates have the potential to take a big bite out of your savings account.

What sort of planning should you be doing? I can think of several things off the top of my head. For starters, if you’re in a position to accelerate income from 2011 into 2010, you might want to do so. In many cases this is easier said than done, but it’s worth exploring if you’d like to shield your income from the potentially higher rates.

Also, if you’re anything like me, you may wait until the end of the year to make your charitable donations. If so, then by waiting just a few more days (until January 1, 2011) to write that check, you could net a substantial tax savings. While you’d have to wait longer to claim the deduction, it might be worth it.

Similarly, if you anticipate selling investments to generate cash during 2011, you might consider moving that up to the end of 2010 to get in on the (presumably) lower capital gains tax rates.

Reference: http://www.fivecentnickel.com/2010/02/15/2011-federal-income-tax-brackets-irs-income-tax-rates/

Recovery (dot) Fail | Not Jobs

Wrong Track

Employment Situation Worse: Year-Over-Year

By: Larry Walker, Jr.

The Bureau of Labor Statistics (BLS) released their employment situation report on Friday July 2, 2010. My analysis is meant to expose facts that most casual observers ignore. Instead of the general month-to-month comparison, I am assessing changes in the employment situation over the last twelve months. This expanded view will tell us whether or not the Recovery Act is working. I will begin with my conclusions, followed by excerpts from the BLS report, and end with my analysis.

Conclusion: The employment situation is worse than it was a year ago. Although the U-6 unemployment rate stood unchanged at 16.5%, the population increased by 2.0 million, while the labor force fell by 1.0 million, making the employment situation unsustainable. The number of marginally attached and discouraged workers rose to 2.6 million, an increase of 415,000 year-over-year. The number of unemployed persons rose by 317,000. There are 919,000 fewer jobs than there were a year ago.

So much for, “the recovery is working.” So much for Progressive-Economics, the main tenets of which appear to be:

  1. Borrow huge sums of money from taxpayers and foreigners.

  2. Spend it in ways that won’t necessarily lead to job creation (i.e. tax cuts for all except for those who would use it to create jobs; more government jobs; mandatory health care; etc…)

  3. Raise taxes on the remaining smaller pool of workers who survive Steps 1 and 2, in order to pay for Step 1.

  4. Repeat Steps 1 through 3 (if you manage to survive after Step 2).

The following excerpts are from the latest BLS report entitled, THE EMPLOYMENT SITUATION — JUNE 2010:

Total nonfarm payroll employment declined by 125,000 in June, and the unemployment rate edged down to 9.5 percent, the U.S. Bureau of Labor Statistics reported today. The decline in payroll employment reflected a decrease (-225,000) in the number of temporary employees working on Census 2010. Private-sector payroll employment edged up by 83,000….

Both the number of unemployed persons, at 14.6 million, and the unemployment rate, at 9.5 percent, edged down in June….

In June, the number of long-term unemployed (those jobless for 27 weeks and over) was unchanged at 6.8 million. These individuals made up 45.5 percent of unemployed persons….

In June, about 2.6 million persons were marginally attached to the labor force, an increase of 415,000 from a year earlier. (The data are not seasonally adjusted.) These individuals were not in the labor force, wanted and were available for work, and had looked for a job sometime in the prior 12 months. They were not counted as unemployed because they had not searched for work in the 4 weeks preceding the survey….

Among the marginally attached, there were 1.2 million discouraged workers in June, up by 414,000 from a year earlier. (The data are not seasonally adjusted.) Discouraged workers are persons not currently looking for work because they believe no jobs are available for them. The remaining 1.4 million persons marginally attached to the labor force had not searched for work in the 4 weeks preceding the survey for reasons such as school attendance or family responsibilities….


Table A (click to enlarge)

A Year-over-year Analysis of the Employment Situation (Table A)

Unemployment Rate – The official unemployment rate has changed by 0.0%, from 9.5% in June of 2009 to 9.5% in June of 2010. This can be attributed to the success of the Economic Recovery Act, if you call ‘no change’ a success. However, according to table A-15, counting all marginally attached and discouraged workers, the U-6 unemployment rate, currently 16.5% was also unchanged year-over-year. (U-6 takes into consideration the total that BLS considers unemployed, plus all persons marginally attached to the labor force, plus total employed part time for economic reasons, as a percent of the civilian labor force plus all persons marginally attached to the labor force.)

The U-6 unemployment rate stood unchanged at 16.5% year-over-year.

Table A-15, click to enlarge

Civilian Labor Force – According to the BLS, the civilian labor force has declined by a little over 1 million workers, from 154.8 million in June of 2009 to 153.8 million in June of 2010. From table A-16 we learn that out of the 1 million who disappeared, 415,000 are no longer being counted because they are considered to be marginally attached (i.e. persons who want a job, have searched for work during the prior 12 months, and were available to take a job during the reference week, but had not looked for work in the past 4 weeks). Once identified, marginally attached workers are no longer counted as part of the labor force. Out of the 415,000, 414,000 are considered to be newly discouraged workers.

The number of persons no longer counted as part of the labor force, because they have stopped looking for work, increased by 415,000 year-over-year.

Civilian non-institutional population – The civilian population increased by slightly more than 2 million, from 235.6 million in June of 2009 to 237.7 million in June of 2010. So while the population increased by a little over 2 million, the labor force shrunk by 1 million, which is clearly unsustainable.

The employment situation is unsustainable.

Persons no longer in the labor force – The number of persons no longer in the labor force increased by 3.0 million, from 80.9 million in June of 2009 to 83.9 million in June of 2010. We learn from Table A-16 (below) that out of this 3.0 million, 415,000 more than a year ago are considered marginally attached (i.e. persons who want a job, have searched for work during the prior 12 months, and were available to take a job during the reference week, but had not looked for work in the past 4 weeks). We also learn from Table A-16 that a total of 6.5 million Americans who want jobs are not counted as part of the labor force, an increase of 7,000 year-over-year.

The number of marginally attached and discouraged workers rose to 2.6 million, an increase of 415,000 year-over-year.

Table A-16, click to enlarge

Number of unemployed – According to the BLS, the number of unemployed persons fell by 98,000 from 14.7 million in June of 2009 to 14.6 million in June of 2010. However, this figure ignores the increase in those considered marginally attached, so in reality the number of unemployed persons increased by 317,000 (415,000 more marginally attached minus 98,000 fewer unemployed persons) year-over-year. See Civilian Labor Force (above).

The number of unemployed persons rose by 317,000 year-over-year.

Number of employed – The number of persons employed fell by 919,000, from 140.0 million in June of 2009 to 139.1 million in June of 2010. In other words, there are 919,000 fewer people working than there were a year ago. I don’t know why Obama is out boasting about the success of his ‘Recovery Program’ when it is clearly a dud. Speaking in plain English, since there are currently 919,000 fewer jobs than there were a year ago, no jobs have been created or saved within the last twelve months (see Table A above).

There are 919,000 fewer jobs than there were a year ago.

Data Sources:

BLS Employment Situation: http://bls.gov/news.release/empsit.toc.htm

BLS Employment Summary: http://bls.gov/news.release/empsit.nr0.htm

Table A: http://bls.gov/news.release/empsit.a.htm

Table A-15: http://bls.gov/news.release/empsit.t15.htm

Table A-16: http://bls.gov/news.release/empsit.t16.htm

Obama on Jobs: Reality is Not Optional

Reality is not optional

To: Obama and other Quasi-Socialist Progressive Fundamentalist Racism Chasers

In response to various comments regarding my last blog post: Obama on Jobs: Worst Track Record in History.

By: Larry Walker, Jr.

Actually the full quote as attributed to Economist, Thomas Sowell was: “Hope is not reality, and reality is not optional.”

Of all the jobs created, and recovered before progressives co-opted the Democrat party, how many were created by the lie that it is up to the Government to borrow money and use it to provide economic stimulus? The answer is none. The old liberal policy used to be called tax and spend (i.e. get the money first and then spend it). The tried and true conservative policy is to cut taxes and let the people spend their own money (i.e. let the free market dictate). The progressive slant has regressed into a new policy called, borrow and spend (i.e. borrow money by the trillion, spend it first, and then tax the hell out of anyone who survives).

We know that the first two methods worked to some degree, although we often disagreed on which was better. All we have to do is go back in history to measure their results. The goal has always been to grow our economy in line with the population, with limited inflation and full employment. But under this new borrow and spend philosophy, all we have is the hope that, if you are ever able to get your head above water, you will be taxed back into oblivion to pay for all the money spent to get you there. In the meantime you just hope that the $250 or $400 per year government handout is enough to get you by.

The hope that an unproven policy will be able to produce the same result as proven methods is not only uncertain, but in this matter impossible. Uncertainty is optional, but reality is not.

Joe Biden recently stated, “We will never be able to recover the eight million jobs that were lost.” Why would he say that? Because there is no way that it can be done under progressive ideology. It doesn’t take a rocket scientist to figure that out.

Under progressive ideology, the economy is something that will continue to function efficiently no matter which policies are crammed down its throat: stimulus, health care, energy policy, financial reform, etc… All of which may be noble goals in a fictitious world, but neither has anything to do with economic growth, nor job creation. True, each may create a few (net) jobs in the next 20 to 40 years, but there may not be any need by that time. In the end, you may be able to force all of these wonderful policies upon the peons, but by then no one will care because the great economy that once existed will be no more.

We need an economy that works for us today, not 20 years from now.

In reality, mandatory health insurance won’t do much good if there are no doctors or hospitals to visit. And where will one go to purchase it when all the insurance companies are gone? Renewable energy and carbon taxes won’t do much for the masses then living in cardboard boxes. Financial reform will be for naught if no one has any money left to save or invest. You can’t have it both ways. Either you put jobs and the economy first, or you fail on all counts.

Hoping that an unproven set of policies will work is not reality. We gave it a shot by spending well over $1 trillion, and it didn’t work. The national debt is now almost 100% of GDP and there is nothing to show for it. So what do you want to do? Do you want to keep on borrowing and stimulating until there’s nothing left? Or should we perhaps pause and consider making a u-turn? I say we heed the warning and make a u-turn before it’s too late.

We know what works, all we have to do is look back in our history at the policies that made America great.

“Reality is not optional.”

___________________________

My previous blog post may also be found at the following sites:

http://www.bookerrising.net/2010/06/larry-walker-jr-commentary-obama-on.html and,

http://aipnews.com/talk/forums/thread-view.asp?tid=15308&posts=1#M40159

Did GDP Fall by 2.4% in 2009?

More B.S. from D.C.

By: Larry Walker, Jr.

According to the Bureau of Economic Analysis (BEA’s) second release regarding – the 4th quarter 2009 GDP, issued earlier today, GDP increased at an annual rate of 5.9% in the 4th quarter of 2009. That is the rate of increase from the 3rd to the 4th quarter, expressed as an annualized percentage rate. The BEA also stated that, in the 3rd quarter, real GDP increased 2.2%. Sounds good, right? Woo-hoo!

“Real gross domestic product — the output of goods and services produced by labor and property located in the United States — increased at an annual rate of 5.9 percent in the fourth quarter of 2009 (that is, from the third quarter to the fourth quarter) according to the “second” estimate released by the Bureau of Economic Analysis. In the third quarter, real GDP increased 2.2 percent.”

But if you read down a little further into the report, the part where the BEA re-enters the atmosphere, you will discover that real GDP fell by (2.4%) in 2009. That is the rate of decline from the 2008 level to the 2009 level. So, is this good, or bad?

[2009 GDP] “Real GDP decreased 2.4 percent in 2009 (that is, from the 2008 annual level to the 2009 annual level), in contrast to an increase of 0.4 percent in 2008.”

Like I said in a previous post, it’s like telling me that my IRA account grew at an annual rate of 5.9% in the 4th quarter, but when I look at my statement I find that my account balance has actually declined by (2.4%) from 2008. So am I better off? No. Are you?

The next time Obama & Company start boasting about 4th quarter 2009 GDP, I wish someone would stand up and say, “but, sir, GDP actually fell by 2.4% under your watch”. Put that in your tea and drink it!

Click to Enlarge

Reference:

http://www.bea.gov/newsreleases/national/gdp/gdpnewsrelease.htm