Kicking Common Sense Down the Road
– By: Larry Walker, Jr. –
When one of today’s most brilliant liberal economists recently mentioned the European fiscal crisis, he said, “Spain is suffering the hangover from a huge housing bubble, which caused both an economic boom and a period of inflation that left Spanish industry uncompetitive with the rest of Europe. When the bubble burst, Spain was left with the difficult problem of regaining competitiveness, a painful process that will take years.”
Yet, when far less knowledgeable left-wingers, including the President, speak of America’s economic woes, they routinely regurgitate the meaningless thread, “We are suffering from 8 years of failed Bush policies.” But what does that mean? Aside from a flawed monetary policy which bails out cronies while treading on everyone else, and an out of control government which has become accustomed to borrowing and spending 50% more than its revenue, are we not also suffering the hangover from a huge housing bubble, which caused both an economic boom and a period of inflation that has left us uncompetitive with the rest of the world?
If it were possible for left and right to agree on our most pressing problems, perhaps we would have a chance of solving them, but when one ideology slovenly blames everything on the sum total of one man’s policies without distinguishing between what works and what doesn’t, we are condemned to the same infinite loop occurring in Europe. The only difference being that their fate ends with austerity, while ours ends with a plunge into a hyperinflationary abyss.
When referring to Europe’s current morass, economist Paul Krugman says, “But the truth is that the protesters are right. More austerity serves no useful purpose; the truly irrational players here are the allegedly serious politicians and officials demanding ever more pain.” Wait, austerity serves no useful purpose? It sounds like Mr. Krugman is saying that the protestors, fire bombers, and destroyers of personal property are the rational players, while serious politicians and officials seeking austerity are among the irrational. So what is austerity, and why would anyone in their right mind side with the protestors while deeming such measures irrational?
Austerity
In economics, austerity refers to a policy of deficit-cutting by lowering spending via a reduction in the amount of benefits and public services provided. Austerity policies are often used by governments to try to reduce their deficit spending and are sometimes coupled with increases in taxes to demonstrate long-term fiscal solvency to creditors. However, austerity policies don’t have to include tax hikes, and in fact as we shall see the optimal austerity policy actually involves a combination tax cuts paired with deficit reduction.
The key phrase above is “to demonstrate long-term fiscal solvency to creditors”. If there were no creditors, then politicians and government officials wouldn’t have to worry about austerity. If there were no creditors, nations could simply print their own currencies on an unlimited basis, and spend without consequence. But in the real world, since creditors exist, some measure of austerity is required no matter what emotions dictate. Besides, history itself teaches us that printing money without restraint is the surest path to the vicious spiral of hyperinflation, a large increase in the money supply not supported by gross domestic product (GDP) growth, which leads to rapid erosion of a nation’s currency and ultimately to ever more pain.
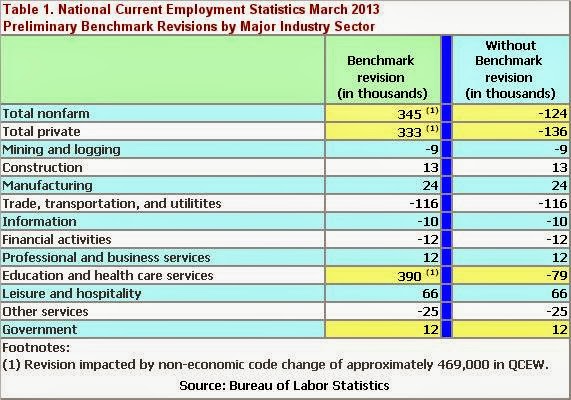
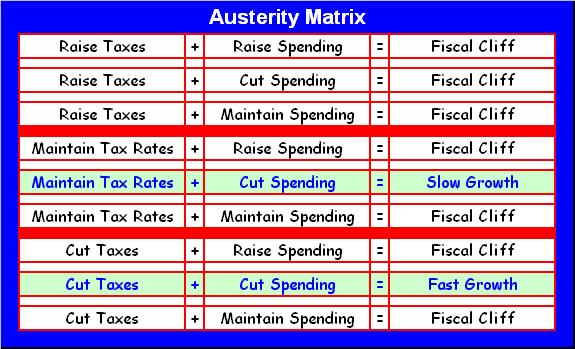
In the table below, I have summarized all the possible fiscal austerity combinations available to the United States and Europe. When viewed graphically the optimal policy choice should be clear. Although many Americans, including the President, think the way forward should involve some combination of spending cuts and tax hikes, credit ratings agencies disagree. For example, according to Fitch Ratings Co., “Fiscal Indecision Threatens US ‘AAA’ – Under current law, tax increases and spending cuts equivalent to about 5% of GDP will take effect in 2013 – if permanent, such a “fiscal cliff” could derail the US economic recovery…” Yet it’s not the spending cuts that are problematic, deficit reduction is a must, but rather the combination of tax hikes and spending cuts.

Following the Austerity Matrix, it turns out that:
-
Tax hikes lead to the fiscal cliff no matter what happens with spending. Why? Because tax hikes lead to private sector austerity, resulting in job and benefit cuts, which leads to lower tax revenues and less economic output. So tax hikes should be off the table. The only reason they’re still being discussed in the United States is because of Obama’s “fairness doctrine”, which if you ask me is total nonsense. Besides, raising taxes on 1% of taxpayers won’t change anything for the other 99%, where the main problem is the lack of opportunities.
-
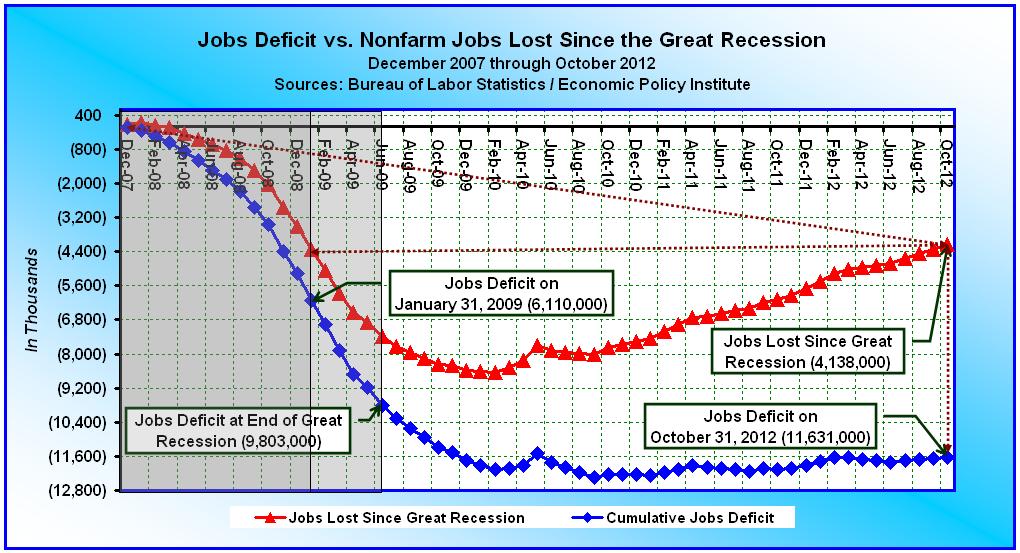
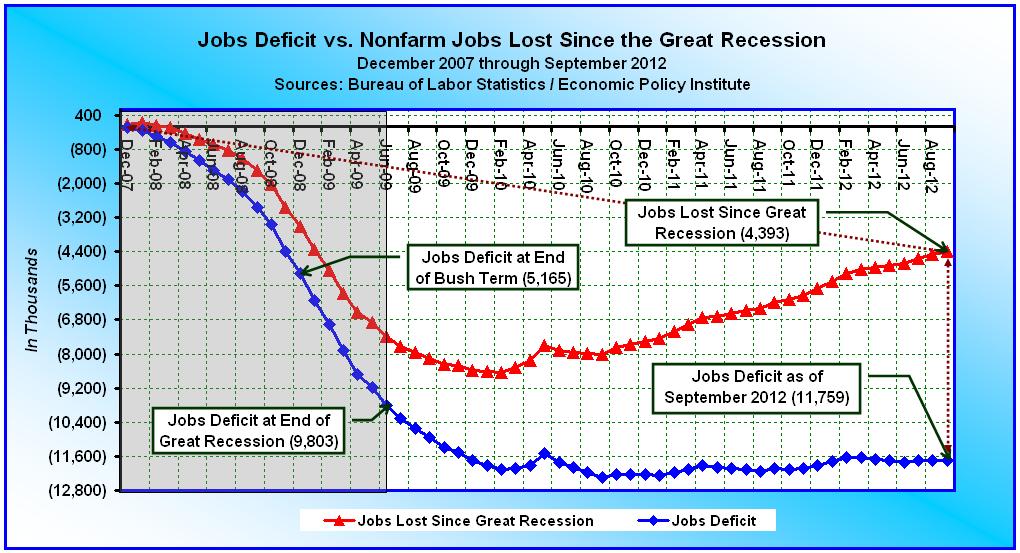
Maintaining current tax rates can work, but only in conjunction with spending cuts. However, this only leads to slow growth, which is basically what we have now. Our current real gross domestic product (GDP) annual growth rate of 1.3% is not enough to change the trajectory of our ever increasing jobs deficit. If tax rates are maintained while spending levels are maintained or raised, we still wind up plunging over the fiscal cliff.
-
The optimal fiscal austerity policy involves a combination of tax cuts and deficit reduction, which leads to rapid growth, or exactly what is needed following an economic crash. But, cutting taxes while maintaining or increasing spending levels only hurtles us over the fiscal cliff.
So there is only one viable fiscal austerity alternative: Cut taxes and reduce government spending. But this always brings up the same old moth-eaten question from faithless do nothings. How will you pay for the tax cuts? The apparently not so obvious answer is — with jobs.
Did you get that? Cutting tax rates across the board, which incidentally is included in the Romney-Ryan Plan, is not a way of giving anyone anything, since the government is merely enabling everyone to keep more of their own money. The dirty little secret is that this is how you grow an economy. When the government confiscates less money from the private sector, the economy eventually finds its footings and will dig its own way out of any hole. I challenge anyone to show me when this form of austerity has ever been implemented and failed to deliver greater revenues and higher levels of economic growth.
Because strait is the gate, and narrow is the way, which leads to life, and few there be that find it. ~ Matthew 7:14
At this point you’re probably thinking, “Well, Bill Clinton raised taxes and cut spending and everything was copacetic.” But according to history, that’s actually incorrect. Although it’s true that President Clinton raised taxes during his first term, government spending also increased, that is until 1995 when his Democrat party lost control of both Houses of Congress. It was actually during his second term when the austerity policy I’m talking about took place. That’s when Republicans passed the Taxpayer Relief Act of 1997, a reconciliation bill that reduced taxes and hence increased the deficit, paired with the Balanced Budget Act of 1997 (H.R. 2014 and H.R. 2015 respectively), each signed by President Clinton. Thus, it was actually tax cuts in conjunction with deficit reduction which produced the boom of the 1990’s, not the Clinton tax hikes.
The only differences between 1997 and today are that the United States wasn’t teetering on the edge of a fiscal cliff in the late 1990’s, and Republicans don’t currently control both Houses of Congress, but the solution to greater revenues, less spending and higher economic growth is the same.
Sophism
Austerity measures are the only way to avoid the bitter lessons of the Weimar Republic, and Zimbabwe. In this sense, serious politicians and government officials recommending the correct form of austerity, a combination of tax cuts and deficit reduction, are among the World’s most rational. But where are they? I actually agree with Mr. Krugman when he infers that the brand of austerity being practiced in Spain, tax hikes in conjunction with spending cuts, is detrimental, but that’s only one of nine possible fiscal austerity combinations, and as shown above — it’s one that doesn’t work. But, although Mr. Krugman has rightly identified the problem, his solution — printing money, and continuing to borrow and spend — is even more irrational.
Not all austerity programs are bad. Tax cuts paired with deficit reduction is the only austerity plan that works, and the only one any nation will ever need. Egging on protestors and attempting to create rifts between Germans and Spaniards solves nothing, nor does begging creditors to pour billions of dollars into a bottomless pit. Thus madmen like Mr. Krugman and those swigging from the same jar of Kool-Aid may be viewed as nothing more than facetious enablers of irrational whiners, crybabies and in some cases common criminals.
On June 7, 2012, Fitch Ratings downgraded Spain’s credit rating by three notches from A to BBB, or to just above junk bond status. So Spain skipped A (-), BBB (+) and sank straight to BBB with a negative outlook. This means that its borrowing costs went up, as investors demand higher and higher interest rates to compensate for the increased risk of default. It also means that fewer and fewer investors are inclined to funnel their savings into such improvidence, at least not until they see the fruits of a serious and meaningful austerity plan.
In the meantime, Spain’s loan delinquencies as a percentage of all loans continues to spike, its housing prices continue to deteriorate adding to the spike in loan delinquencies, and its unemployment remains at 24.63% further adding to its woes and the stressed loan market. If Spain follows the advice of Mr. Krugman, and rejects some form of austerity, it will continue on the course of a fourth-rate, junk bond servant, destined to borrow more and more simply to cover its debt service until it is eventually toppled by an adversary, plunges back into the Stone Ages, or otherwise succumbs to extinction.
Wrap
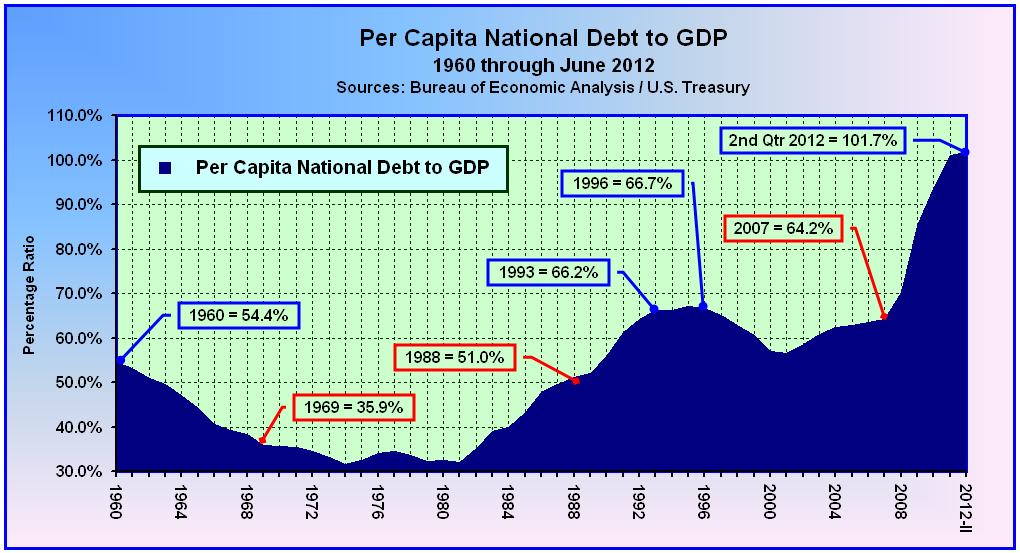
On September 14, 2012, Egan-Jones Ratings Co. downgraded its United States sovereign rating to AA (-) from AA on concerns that the Fed’s new round of quantitative easing, or QE3, will hurt the U.S. economy. In a note, the ratings agency said, “From 2006 to present, the US’s debt to GDP rose from 66% to 104% and will probably rise to 110% a year from today under current circumstances; the annual budget deficit is 8%. In comparison, Spain has a debt to GDP of 68.5% and an annual budget deficit of 8.5%.”
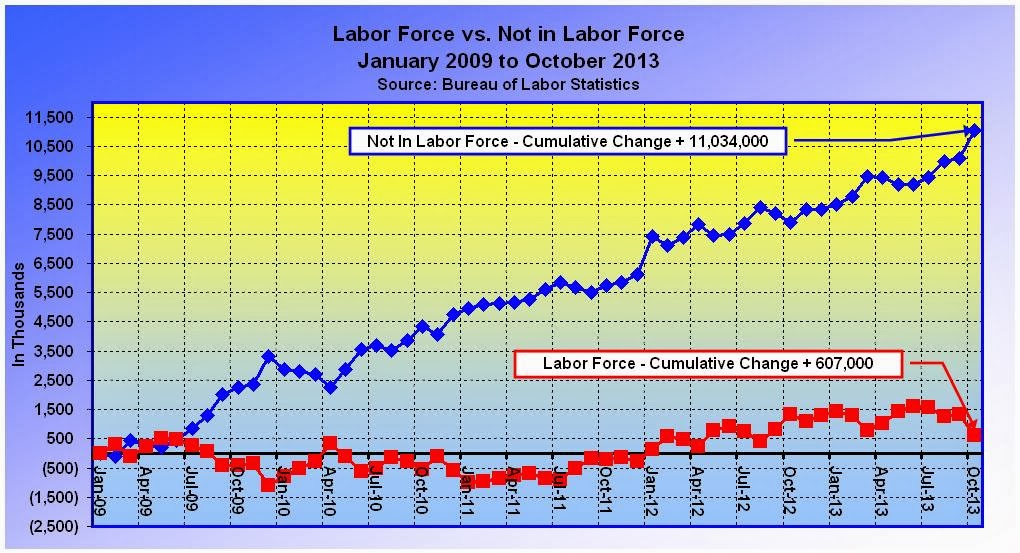
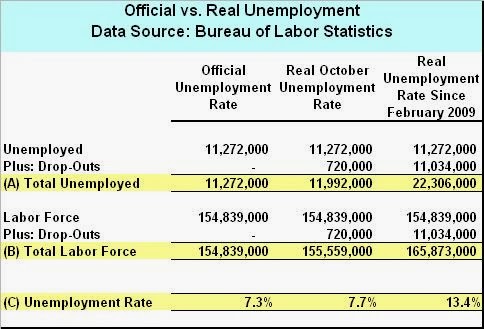
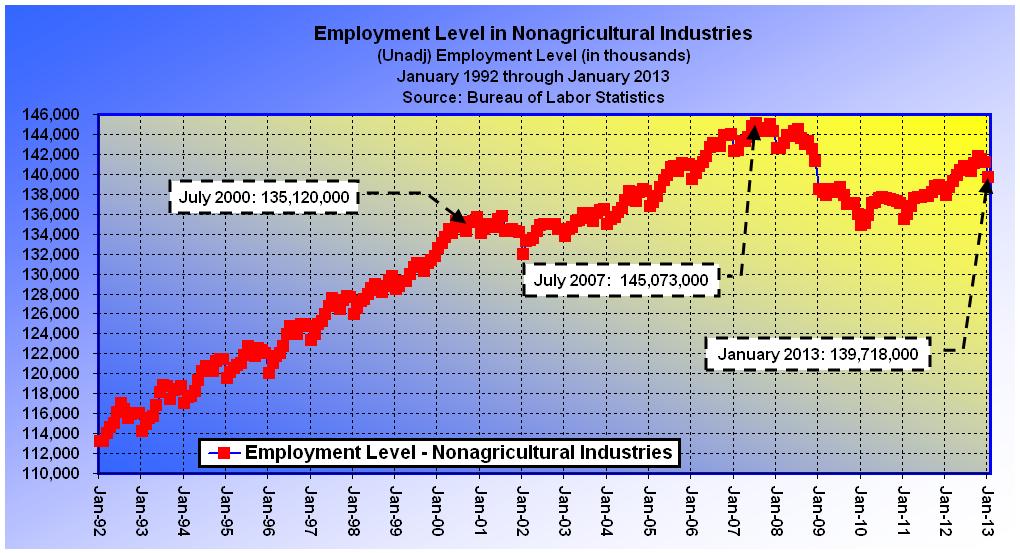
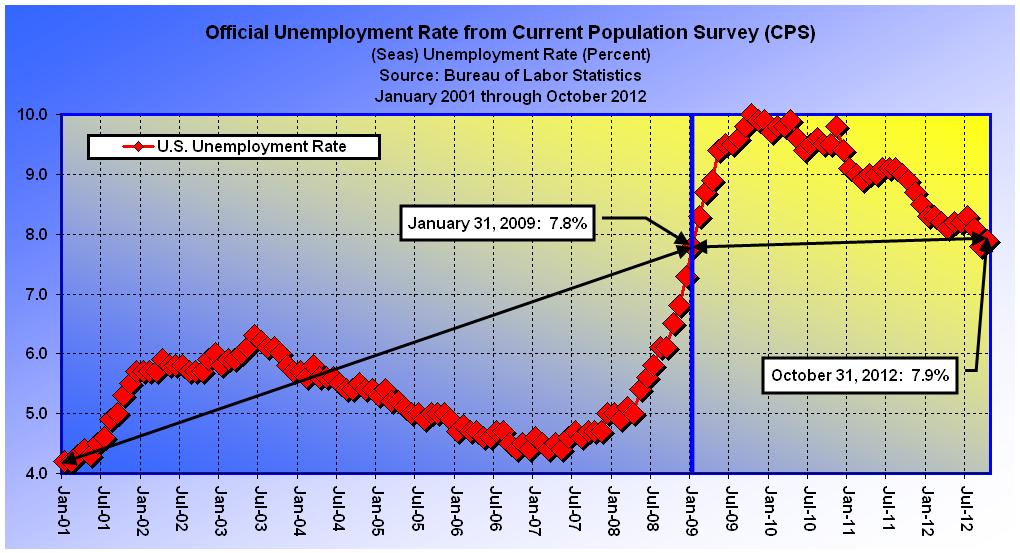
Technically, the United States is worse off than Spain; the only consolation being a lower unemployment rate. But then again we don’t count all of our unemployed. In the United States persons are classified as unemployed if they do not have a job, have actively looked for work in the prior 4 weeks, and are currently available for work. Thus, when someone is unemployed but wants to work, if they have not looked for work in the last 4 weeks they are no longer counted (i.e. not in labor force). In fact, according to the Bureau of Labor Statistics – Table A-16, a total of 7,018,000 working age persons have dropped out of the labor force since January of 2009. If they were counted, the number of unemployed would be 19,562,000, and the official unemployment rate would be 12.1% (19,562,000 / 161,663,000).
From my perspective, despite all of the distractions, the Romney-Ryan ticket is more serious about tackling the nation’s deteriorating debt and employment trajectories, than the Obama-Biden road show, which continues to make promises it knows it can’t deliver. Obama-Biden had a fair shot and only made our fiscal situation worse than it was four years ago. It was on Obama’s watch that, the United States sovereign credit rating was downgraded for the first time in history (with a negative outlook). Although not every ratings agency participated in the downgrade, those that haven’t are simply waiting for the outcome of the November elections.
What should be clear is that another four years of irrational fiscal policies won’t make things better. There are only so many combinations of fiscal austerity measures, and only one leads to rapid economic growth. The Romney-Ryan Plan, which involves a combination of across-the-board tax cuts paired with deficit reduction fits the bill. In contrast, the Obama-Biden script, which by law is already fixed on a Grecian-Spaniard style combination of tax hikes and spending cuts doesn’t. Vote Romney-Ryan for serious-minded fiscal leadership, or vote Obama-Biden for irrational, Weimarian, sophistic, subordination.
References:
Paul Krugman: Europe’s Austerity Madness – Here’s why the protesters in Spain and Greece are right that inflicting more and more pain serves no useful purpose.
Anthony B. Sanders: Spain’s Loan Delinquency Spike as House Prices, Unemployment Continue to Deteriorate
Photo Credit:
Mount Holyoke College – The Weimar Republic and Revolt 1918-23 – The photograph shows children playing with bundles of worthless money.