Upside Down In America

~ By: Larry Walker, Jr. ~

Obama’s economic theory appears to be a hodgepodge of both supply-side and demand-side theory based primarily on a belief that if the government rewards special interest groups who vote for the chief executive’s political party, then said party will get re-elected.

In other words, Obamanomics is nothing more than a selfish power play. Missing from its objectives are the goals of economic growth and wealth creation. Inherent in its objective is the idea that there is already enough wealth in the nation to divide many times over until everyone is on an equal playing field. Once met, this objective will lead to the end of all economic activity in the United States.

Obamanomics is a theory that works best if the employees of an automaker are its only customers. It also works well if unionized school teachers are the only taxpayers within their respective school districts. In other words, Obamanomics works if the same money earned by an entity’s employees is reinvested in full back into the same entity. If giving incentives to employees is better than giving them to employers, then Obamanomics has nailed it. One can only wonder why those gosh darned employees aren’t hiring more workers.

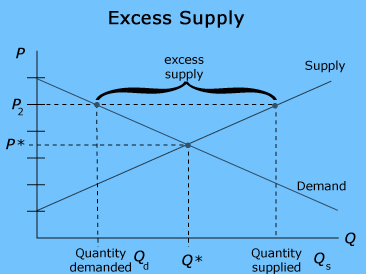
For example, the Obamanomics version of auto industry bailouts was made with the assumption that if the government helped automakers, then they would produce more and better quality cars which someone would buy, thus returning the industry to profitability. What the theory failed to consider was that the reason American automakers were facing bankruptcy was due to the lack of demand, not supply. It wasn’t that U.S. automakers weren’t producing enough, or the right cars, it was that no one was buying them. And why did the demand for automobiles suddenly come to a screeching halt?

Upside Down

There’s a lot of talk these days about the decline in housing prices, but what does that really mean at a personal level? What are its effects on the economy as a whole? I’ll tell you how I feel about it.

Every waking day, I feel as though I’m mortgaged to the hilt, which is, through no fault of my own, a fact. It’s not a good feeling knowing that it will take many, many years, if ever, for the value of my home to return anywhere close to the amount I owe. What this does to me psychologically is make me not want to spend a dime on anything other than bare necessities.

Everything is basically on hold until my personal debt-to-equity ratio returns to a healthy level. This spills over into decisions I make for the business. ‘If it ain’t broke, don’t fix it.’ That means purchasing a new vehicle, new equipment, new appliances, or for that matter anything related to the house is out of the question.

Wants are out of the question; needs are the priority. They say, “Cheer up, live a little, go out and spend some money and don’t worry about it so much.” I say, ‘Mind your own blanking business.’ For me, until this situation is corrected I will continue to live below my means, and if you mess with me, you do so at your own risk.

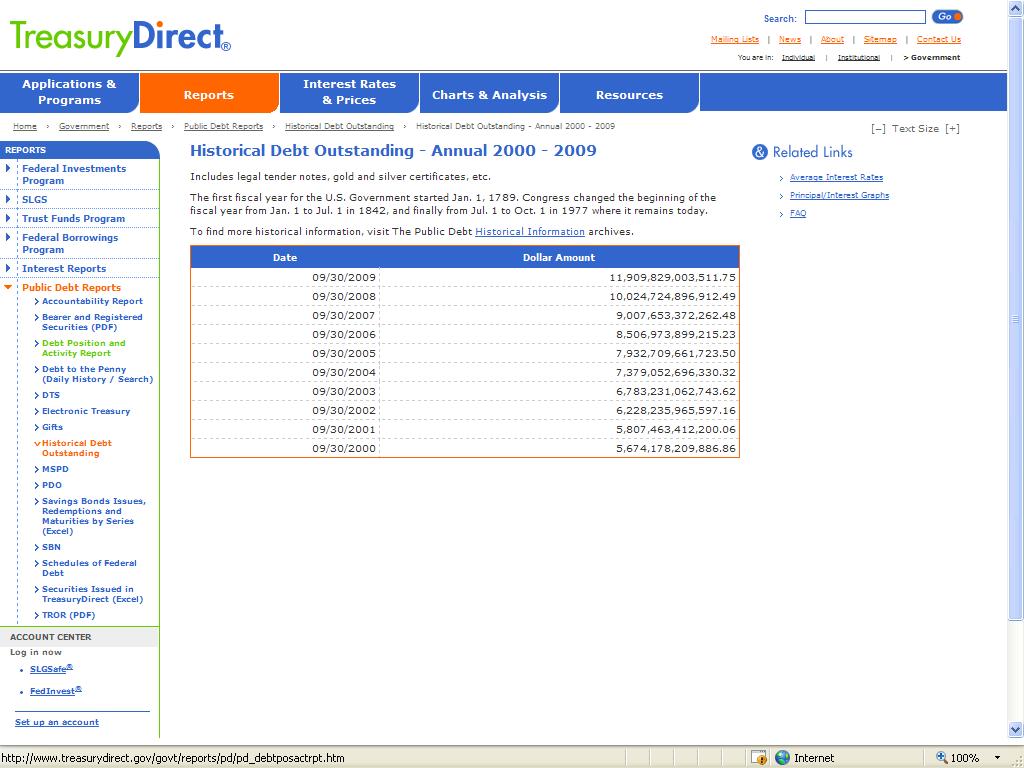
Meanwhile, the U.S. government continues to spend us all into oblivion, thus assuring that if I ever do get my head above water again, the government will be there to make sure I drown. What politicians don’t realize is that none of their spending has done anything to improve the personal debt-to-equity ratio of any American, but has rather destroyed that of the entire nation.

As politicians from both major parties stare hopelessly into the abyss on a daily basis, none of them seem to have a clue as to how to fix the real problem. Some politicians have become so discouraged that they have resorted to exhibitionism, while others have convinced themselves that the way back is through incurring more debt. It doesn’t get any more delusional than, “We have to spend more to keep from going broke.” While many have chosen the path of insanity, that’s not the way for me.

Let’s face facts, when the amount of ones debt exceeds a healthy level (a debt-to-equity ratio of 0.5 to 1.5 being deemed healthy) there are only two ways out. (A) Reduce all unnecessary expenditures to a bare minimum applying the savings toward debt reduction. (B) File for bankruptcy and make a fresh start.

Some have chosen the latter, while I choose the former. Others don’t own a home and thus have no idea what I’m even writing about, which is the dilemma of most politicians. Most politicians don’t feel as though they own the national debt, and they plan on being long gone before any tough decisions have to be made. However, most of them will find themselves long gone by November of next year, if a serious effort isn’t undertaken soon.

It doesn’t take three years to solve America’s most pressing problem. I made my decision as soon as the crisis hit. There are only two options: A or B. No. Increasing income taxes on an upside down citizenry, increasing the amount of government regulations upon them, and imposing new health insurance mandates will not solve the real problem.

It’s time to fix the problem of this era. It’s time to pass a budget. It’s time to pay down the national debt. It’s time to reduce the size of government. It’s time to end excessive government regulation. It’s time to overthrow an unconstitutional government mandate. It’s time to make a decision, or get out of Dodge.

“If you’re not part of the solution, you’re part of the problem.”

Point of No Return | National Debt Tops Personal Income

Warning - No Return

~ By: Larry Walker, Jr. ~

For the first time since World War II, the National Debt of the United States has exceeded personal income, on a per capita basis. The point of no return was breached in 2010, during Barack Obama’s second year in office, and the derangement continues to spin hopelessly out of control. This means that every dollar earned by an American citizen is now owned by the federal government, and then some. That’s right, the average annual income of most working-class Americans now belongs to the federal government. The warning of Thomas Jefferson has come to pass, “A government big enough to give you everything you want, is big enough to take away everything you have.”

Meanwhile, no senators voted for Barack Obama’s 2012 budget when it came up for a vote in the Senate on Wednesday. A procedural vote to move forward on the president’s plan failed 0 – 97, proving that Obama is basically a lame duck president, with no viable plan for resolving the government-manufactured fiscal crisis.

Historical Per Capita National Debt, Personal Income and GDP

In the year 1929, per capita personal income was $697, while each citizen’s portion of the national debt was $139. The federal government’s debt represented just 16.3% of gross domestic product, and 19.9% of personal income. Although not incurring any national debt at all would have been ideal, the percentage of debt to personal income was at least somewhat bearable back in the day; but this was about to change for the worse.

From Point of No Return

The point where a citizen’s per capita share of the national debt exceeded personal income first occurred at the height of World War II. In 1944, per capita personal income was $1,199, while each citizen’s share of the national debt reached $1,452. At the time, the national debt represented 91.5% of gross domestic product and 121.1% of personal income, on a per capita basis. Per capita national debt would continue to exceed personal income through the end of 1950, five years after the end of the war.

From Point of No Return

The point of no return was decisively breached in the year 2010 (see chart above). Although per capita personal income had grown to $40,441, each citizen’s portion of the national debt soared to $43,732. The national debt represented 92.5% of gross domestic product and 108.1% of personal income, on a per capita basis. The situation has worsened through the end of the first quarter of 2011 with per capita personal income of $41,486, versus per capita national debt of $45,782. Through March of 2011, the national debt now represents 95.1% of gross domestic product and 110.4% of personal income, on a per capita basis.

[In contrast, at the end of 2008 per capita personal income stood at $40,469, while each citizen’s share of the national debt was $32,886. In 2008, the national debt represented 69.8% of GDP and 80.9% of personal income, on a per capita basis. Although the United States government was dangerously close in 2008, it had not yet surpassed the point of no return.]

This might not be as big of a deal if the United States ever paid down its debt, but I can only find six years since 1929 where this actually occurred – 1930, 1947, 1948, 1951, 1956, and 1957. There is no chance of fiscal recovery with a president who, in the face of financial disaster, dares to submit a budget containing multi-trillion dollar per year deficits into the future. Until the right leadership is in place, you, I, our children and our grandchildren can look forward to living in a nation which basically owns us. Is this the same Republic that we inherited from our forefathers? I think, not.

Barack Obama has taken this nation in precisely the wrong direction; he has taken us beyond the point of no return. Yet there is still hope, but such hope, of necessity, lies beyond the realm of partisan politicians. Faith without works is dead. This isn’t World War II. It’s time to dramatically reduce the federal government’s footprint. It’s time to cut government spending. It’s time to lower (not raise) the debt ceiling. Tomorrow will be too late.

References:

Rejected! Senate Votes Unanimously To Ignore Obama’s Budget

Treasury Direct: Historical Debt Outstanding – Annual

Treasury Direct: Debt to the Penny through 3/31/11

Bureau of Economic Analysis: Table 7.1. Selected Per Capita Product and Income Series in Current Dollars (A)

Data Tables:

From Point of No Return

Link to All Data Tables and Charts

Link to Original Excel Spreadsheet

PUBLIC-sector Union Fallacy II | Capitalizing on Ignorance

Union Lap Dogs

“Before making a donation to any organization, be sure to review how it spends its money.”

~ By: Larry Walker, Jr. ~

The American Federation of Teachers, AFL-CIO of Madison, Wisconsin (AFT-WISC) is a tax exempt organization which is primarily funded by union dues paid by its mostly state and local government employee members. In the fiscal year ended June 30, 2009, AFT-WISC took in 91.5% of its revenue or a total of $3,358,143 from membership dues. On its latest Form 990, Return of Organization Exempt from Income Tax, while all of the revenue reported was identified as having been related to its exempt purpose, none of its expenditures were reported as such. So just how much of this money was actually used to improve the lives of its members?

According to page 10 of its latest Form 990 tax return, none of the $3,808,451 of expenditures was related to its exempt purpose. In fact, AFT-WISC spent $2,369,114, or 70.5% of member’s dues, on salaries, pensions, other benefits and payroll taxes for its 44 employees. Furthermore, due to reckless management, AFT-WISC posted a net loss of $(137,113) for fiscal year 2009. Union dues will therefore most likely increase in the near future.

In fiscal year 2009, AFT-WISC paid its president, Bryan Kennedy, total compensation of $164,781. The only problem with this is that he was only paid $56,913 in fiscal year 2008, leaving some to wonder what would justify a 190% pay raise in a year when the organization suffered a net loss. While Mr. Kennedy celebrated a $107,868 pay hike, AFT-WISC members were left bloodied by a $(137,113) net loss.

Aside from compensating its own employees, AFT-WISC squandered a total of $535,021 on political campaigns and lobbying activities. Among these activities, $20,000 was contributed to Progressive Wisconsin; $237,021 was spent on mailings containing information about legislative and electoral issues, and get out the vote events such as town hall meetings and phone banks; and the remaining $278,000 was sent to other organizations.

It appears that the difference between this particular union and a political party is very slim. Other than communicating a tiny bit of information to the public about issues affecting its members, AFT-WISC’s main accomplishments appear to be: (1) an ability to collect money from its members, (2) to compensate its own employees, (3) to support progressive organizations, (4) and to persuade people to vote for the candidates of its choosing. AFT-WISC, like most other public-sector employee unions, functions more like a political party than an association dedicated to the needs and concerns of its members. Teachers and public employees are free to join the political party of their choosing, and to direct their money to whomever they choose. So why do they need a middle-man? Public employees should be ashamed. Substituting a middle-man to make political choices for them is the antithesis of freedom and democracy.

Perhaps instead of jumping through hoops whenever the union bell tolls, teachers and other public servants should pay more attention to where their union dues are going. Then and only then will the rest of society believe you are more than just feeble lap dogs. As for the American Federation of Teachers, AFL-CIO of Madison, Wisconsin… it’s “Not Just No, But HELL NO!”

Reference:

http://www2.guidestar.org/organizations/39-0963086/american-federation-teachers.aspx#

PUBLIC-sector Union Fallacy I

Union Nazis

Where Solidarity Ends

~ By: Larry Walker, Jr. ~

Thank God for Governor Walker and the Wisconsin legislature. Clearly there is a line of demarcation between the rights of public-sector and private-sector workers. Patrick J. Wright, a director of the Mackinac Center Legal Foundation, breaks it down in his latest post, Public-Sector Bargaining Privileges Are Not Inalienable Rights.

Mr. Wright concludes with, “the power of government employee unions in collective bargaining necessarily amounts to power over the people themselves, therefore the people’s representatives must periodically scrutinize that power and curb excess. Why that’s pure natural law, and if you stop to think about it, just plain old common sense. But perhaps public-sector union donors and their supporting dunderheads need a less sophisticated explanation. What follows is an uncomplicated lesson in fiscal logic, just for you:

Point #1 – If you work for a state, local or federal government agency, and your employer’s treasury is tapped, you are most likely a part of the problem. Job security eludes you.

Point #2 – If you’re going around spouting off that a certain governmental entity isn’t broke, and you’re not one of its top executives, then you might not know what in the hell you’re talking about. Your beliefs are based on conspiracy, not facts.

Point #3 – If you have a government job paying 40% more than the private sector, with Cadillac benefits, then you’re not likely one who’s losing their home and going through financial hell. You’ve been brainwashed.

Point #4 – If you’re having $1,000 per year in union dues deducted automatically from your paycheck and sent to your government masters (politicians), and now complain about having to pay more toward pension and health costs, you might be better off dumping that worthless union. Perhaps union dues are a luxury you can ill afford.

Point #5 – If you think that private citizens exercising their right to trim some of the liberties that government workers take with their money is a form of class warfare, then which class are you – government or the people? You’re confused.

Point #6 – If you think that the way to effectively engage in political debate is by marching in mobs and shouting in unison, “shame, shame, shame…,” you might be mentally ill. You need a check up from the neck up.

To summarize, if you are still offended by the law that was just passed in Wisconsin, then :

  • Job security eludes you,

  • Your beliefs are based on conspiracy rather than facts,

  • You’ve been brainwashed,

  • Union dues are a luxury you can ill afford,

  • You are confused, and

  • You need a mental health check up.

Well, if that’s the case, then you better check yourself before you wreck yourself. If the glove fits, you must admit. My recommendation: Quit that cushy government gig and get a real job. And as far as private-sector unions supporting public-sector unions in so-called solidarity; can you say, “brainwashed“. Sorry but I can’t ride with you on that bucket of bolts. Sometimes you just have to surrender and face reality. Public-sector unions are the enemy of both private-sector unions, and of we the people.

Public sector – The area of the nation’s affairs under governmental rather than private control.

Private sector – The area of the nation’s economy under private rather than governmental control.  

References:

http://supreme.justia.com/us/431/209/case.html

http://www.mackinac.org/14734

http://www.mackinac.org/13741

Vaporizing PUBLIC Employee Unions

Ray-Gun

Hasta La Vista!!!

” Wisconsin is not broke. “ ~ Some Rich Fat Guy ~

Whatever rich fat guy, but who asked you anyway. The election is over. You lose, we win.

~ By: Larry Walker, Jr. ~

While state and local government employee unions (aka. public unions) clutch desperately to what they falsely perceive to be a God-given right to organize, pro football players are planning to de-unionize. You see, the National Football League Players Association (NFLPA) has legal options under federal law, while state and local government workers have none. Public workers exist to serve the public, and are compensated from tax dollars, not from profits earned in the private sector.

“The National Labor Relations Act or Wagner Act (P.L. 74-198, 49 Stat. 449, codified as amended at 29 U.S.C. § 151–169) is a 1935 United States federal law that limits the means with which employers may react to workers in the private sector who create labor unions, engage in collective bargaining, and take part in strikes and other forms of concerted activity in support of their demands. The Act does not apply to workers who are covered by the Railway Labor Act, agricultural employees, domestic employees, supervisors, federal, state or local government workers, independent contractors and some close relatives of individual employers.”

As for NFL players, decertifying the union means firing the NFLPA as their bargaining agent, which will prevent NFL owners from locking out the players when the existing collective bargaining agreement expires. Any lockout at that point would be a violation of federal antitrust law. Decertifying will also allow individual players to sue the NFL and their respective teams. The tactic has worked before, resulting in NFL players gaining free agent rights.

On the other hand, state and local government servants in Wisconsin and other states don’t have this option or any others. You see, public servants are not covered by federal labor relations laws. They have only been allowed to unionize under state laws granting them make-believe rights. In reality, all it would take to completely do away with public employee unions is a determined state house majority, duly elected by a base of overburdened taxpayers. And that’s where things stand. Hasta la vista!

AFTER HAVING DONE ALL STAND! ~ Eph 6:10-20

BTW: The word fat was directed at Moore in the sense of his reasoning being “practically nonexistent” (i.e. a fat chance).

Public Union Membership in Numbers

Eating Dots

~ By: Larry Walker, Jr. ~

In terms of raw numbers, local government union members stand to be crushed, or perhaps just eaten. There are roughly 14 million unemployed Americans who would love to have local government service jobs, minus collective bargaining. Perhaps the media should poll the unemployed. The bottom line is that it’s better to be gainfully employed than unemployed. Advice to local government employed union members: Work with your duly elected government officials, or kiss your jobs goodbye.

Out of 124 million Americans who are still employed (excluding the incorporated self-employed), only 14.7 million (or 11.9%) are members of unions.

Total Non-Union vs. Union Employees

Out of the 14.7 million union members, 7.6 million (or a majority of 51.8%) are government employees.

Government Sector Union Members

Out of the 7.6 million government employees who are members of unions, 4.7 million (or a majority of 61.3%) are local government employees, while 1.9 million (or 25.8%) are state government employees.

State & Local Government Union Members

Out of 124 million Americans who are still employed (excluding the incorporated self-employed), only 4.7 million (or just 3.8%) are local government employed union members.

Local Government Union Members

In terms of numbers, local government employed union members, those who are complaining the most, only represent 3.8% of all American workers (excluding the incorporated self-employed), 3.0% of the roughly 151 million American taxpayers, and 1.5% of the total population. We believe there is more empathy among Americans for the 9.0% of the labor force who are unemployed, and the millions more who have dropped out of the workforce, than there is for local government employed union members. In other words, the pink slips are in the mail.

“Every goodbye makes the next hello closer.” ~ Anonymous Unemployed

Related: Union Label : Owned by China & Liberty VS Union Power

Reference: U.S. Bureau of Labor Statistics

Table 3. Union affiliation of employed wage and salary workers by occupation and industry (Jan. 21, 2011 Report)

Table 3. Union affiliation of employed wage and salary workers by occupation and industry (Historical Data)

Union Label | Owned by China

Owned by China

When ‘Made In China’ Isn’t Enough ~

“Every once and awhile you need to get out on the streets and get a little bloody when necessary.” ~ Rep. Mike Capuano (D-Ma.) ~

Made in China wasn’t enough, now union minions want to be owned by China as well. ~

So far all I see is a bunch of snot-nosed, deficit-financed, government employed, union slugs spewing nonsense, but not one drop of blood. Hey union guys, this isn’t 1945, except maybe in terms of the National Debt. Back in the day, American unions used to fight so-called greedy capitalists for higher pay, greater benefits, and better working conditions, but that was then, and this is now. Today, almost all union members are government employees. What’s up with that? Who are these guys fighting against? Can American taxpayers who pay your salaries really be equated to the so-called ‘robber barons’ of the past? I don’t think so. Most of us are just fighting for survival. By us, I mean the other 88.1% of the workforce who are not union members. When a small minority (11.9% of loud-mouthed, snot-nosed, whiny, union cry babies) can impose its will upon the majority (88.1% of responsible, hard-working, non-union juiced, taxpayers) – that’ll be the day. Good luck with that fight.

Back in 1945, almost 36% of American workers were represented by unions, but according to the U.S. Bureau of Labor Statistics, that number had dwindled to just 11.9% by the end of 2010. Although there has been a noted increase in the number of public employee unions since the 1960s, the decline in private-sector union membership has been most telling. If union membership was worth its weight in dues, then most of the goods that America purchases today wouldn’t be stamped “Made in China”.

Union Membership Plummets

At the height of union popularity in the 1940s, only about 9.8% of government slugs were represented by unions, versus 33.9% of private sector workers. However, by the end of 2010, those proportions had flipped. Today 36.2% of public workers are represented by unions while private sector union membership has plummeted to a mere 6.9%. The U.S. Bureau of Labor Statistics most recent survey indicates that union membership in the U.S. has fallen to just 11.9% of the total workforce.

I’m sorry, but all of you public union slugs need to shut the hell up and accept what we decide. We don’t work for you; you work for us.

References:

Blindsided | White House Fiscal Lunacy

Back in the Ditch

2016 GDP vs. National Debt

– By: Larry Walker, Jr. –

We will not be adding more to the national debt.” ~ Barack Obama ~

Say what? You must mean that you will not be adding more to your national debt, because I know that I certainly won’t be adding to the national debt, so you need to take the we out of that statement buddy. The real question is how are you going to pay back the trillions of dollars that you have already squandered? And here’s another riddle – What will the U.S.A.’s gross domestic product (GDP) need grow to by the year 2016 in order to keep pace with the present White House occupant’s irrationally exuberant spending spree? And based on the answer to that question, at what annual rate must our economy grow?

If we add the inexperienced CEO’s 2011 to 2016 projected annual budget deficits to fiscal year 2010’s ending national debt balance of $13.6 trillion, then the national debt will equal $19.0 trillion by the year 2016. And you call that “not adding more to the national debt”? So is this guy a pathological liar, or what?

At the end of 2010, the Bureau of Economic Analysis (BEA) reported that gross domestic product (GDP) for the year was $14.6 trillion. So depending on the rate of economic growth over the next 6 years, the national debt may sooner or later exceed GDP. Although even the present White House occupant once stated that the national debt is unsustainable, the question is – as juxtaposed to what? If we take a look back to the days when our debt was sustainable, when the economy was growing at roughly 5% per year with low unemployment, such as in 2003, we will discover that the debt-to-GDP ratio back then was 60.9%. So the question is what do we need to do in order to reduce our debt-to-GDP ratio from its present level of 92.8% back down to 60.9%?

In Scenario #1 (below) we will determine the rate of economic growth necessary in order for GDP to equal our projected debt by the year 2016. In Scenario #2 we will discover the rate of economic growth needed to return to a more healthy debt-to-GDP ratio of 60.9%. Finally, in Scenario #3 we reveal what the debt-to-GDP ratio will be by 2016 if GDP maintains its present growth rate of 3.2% per annum.

Scenario #1 – The budget to nowhere

Gross domestic product must grow from $14.6 to $19.0 trillion in order to equal the National Debt by 2016. In other words, GDP must maintain an average sustained growth rate of 4.5% per year, over the next 6 years, in order to achieve a debt-to-GDP ratio of 100%. This represents ‘the budget to nowhere’. Although, the Bureau of Economic Analysis reports that GDP grew at the rate of 3.2% in the 4th quarter of 2010, as you can deduce, this will not be sufficient to reach the current White House occupant’s pitiful goal of a 100% debt-to-GDP ratio.

Scenario #2 – Back to sanity

In order to return to the more prosperous 2003 debt-to-GDP ratio of 60.9%, GDP must grow at a sustained annual rate of 13.5% over the next 6 years. How likely is this? In order to achieve such a rate of growth, our economy would need to expand at the pace of an emerging market economy, a feat which is hardly doable. This is precisely why the Debt Commission recently stated that we will never grow our way out of this fiscal disaster.

Scenario #3 – Your new reality

Finally, if GDP maintains the present annual growth rate of 3.2%, then our debt-to-GDP ratio will have reached 107.4% by 2016. Welcome to reality, and to a future of bonded labor. This doesn’t look like winning the future to me, it looks more like a donkey in a quagmire.

Conclusion

The present White House occupant’s budget plan leads to disaster. What most of us wanted to hear was a plan for paying off the debt which he alone has run up over the last two years, not more debt evasion. Face it, there is only one way out of this mess. The first thing we need to do is to derail all of this administration’s reckless spending initiatives. Secondly, government spending must be cut, slashed, and cut again. And finally, we must get this fiscally bankrupt pathological liar out of the White House, by any means necessary. By any means necessary. And as far as who will be the next POTUS; throw a dart. While I am not certain about who it will be, I definitely know who will be packing up at the end of 2012, if not sooner.

Sources:

http://www.whitehouse.gov/sites/default/files/omb/budget/fy2012/assets/hist01z1.xls

http://www.bea.gov/newsreleases/national/gdp/2011/xls/gdp4q10_adv.xls

http://www.treasurydirect.gov/NP/NPGateway

The Progressive Slide to 2020 | GDP vs. Debt

2020 GDP vs. National Debt

By: Larry Walker, Jr.

The question of the day is what will the USA’s Gross Domestic Product (GDP) need grow to by the year 2020 in order to keep pace with the Progressive’s ruinous spending? And based on the answer to that, at what annual rate should our economy be growing?

If we add the CBO’s 2010 to 2020 projected estimate of the president’s budget deficit to the current national debt of $12,948.7 billion (as of 4/30/2010), then the National Debt will total $23,170.0 billion by the year 2020.

click to enlarge

click to enlarge

click to enlarge

As of the end of the 1st quarter of 2010, based on the Bureau of Economic Analysis (BEA’s) latest preliminary estimate, GDP is averaging $14,601.4 billion annually.

click to enlarge

Depending upon the rate of growth of our economy over the next 11 years, our National Debt will exceed GDP, sooner or later. We know that even the Progressive’s say that our National Debt is unsustainable, but the question is just how unsustainable? If we take a look back to the days when our debt was sustainable and the economy was growing at roughly 5% per year with low unemployment, for example 2003, we will discover that our Debt to GDP ratio was 60.9%.

Scenario #1, below, determines the rate of growth necessary in order for GDP to match our projected debt by the year 2020. Scenario #2 determines the rate of growth needed in order to return to the 2003 debt-to-GDP ratio of 60.9%. Finally, Scenario #3 reveals what the debt-to-GDP ratio will be by 2020 if GDP maintains its current pace.

click to enlarge

Scenario #1 – The road to nowhere

GDP must grow from $14,601.4 to $23,170.0 billion in order to equal the National Debt by 2020. In other words, GDP must maintain an average sustained growth rate of 5.3% per year for the next 11 years, in order to achieve a Debt to GDP ratio of 100%. This represents ‘the road to nowhere’. Although, per the BEA, GDP grew at a rate of 3.2% in the first quarter of 2010, as you can see, this will not be enough to reach the destructive Progressive goal of a 100% debt-to-GDP ratio.

Scenario #2 – The way back to 2003

In order to return to the more prosperous 2003 Debt-to-GDP ratio of 60.9%, GDP must grow at a sustained annual rate of 14.1% for the next 11 years. In order to achieve such a rate of growth, our economy would have to grow at the pace of an emerging market, a feat which is clearly impossible for an industrialized nation. This is precisely why the president’s debt commission has stated publicly that, we will never grow our way out of this ‘man-made disaster’.

Scenario #3 – The Hellenistic toboggan slide

If GDP maintains its present annual growth rate of 3.2%, then by the year 2020 our debt-to-GDP ratio will reach 117.4%. Welcome to the Progressive Utopia. Welcome to the Republic of Greece.

Conclusion

The end of the Progressive trail leads to Greece. What you are seeing in Greece today is precisely where Progressive ideology will take us. Prepare for riots, violence, chaos, class warfare, and national bailouts. If that’s what you want, then support Barack Obama, and his Progressive entourage, and vehemently defend all of their policies. But, if this is not where you want to be in 2020, then identify and support true fiscal conservatives. Join with independents and moderates, and let’s elect responsible mainstream leaders who will lead us out of the wilderness, through sound fiscal policy, and free-enterprise solutions. It’s time to put the Progressives in their place: prison.

Sources:

http://www.bea.gov/newsreleases/national/gdp/2010/txt/gdp1q10_adv.txt

http://www.treasurydirect.gov/govt/reports/pd/histdebt/histdebt_histo5.htm

http://www.treasurydirect.gov/NP/BPDLogin?application=np

http://www.cbo.gov/ftpdocs/112xx/doc11231/frontmatter.shtml

click to enlarge

click to enlarge

Bail and Fail | Obama’s Bank Rescue Sham

On Friday, April 30th, the FDIC reported 7 additional bank closings including three banks in Puerto Rico. It’s ironic that Congress passed a bill asking Puerto Rico if it wants statehood on the same day.

This brings the total number of bank failures under Obama to 204. The total number of bank failures in April was 23, and the year-to-date figure is 64. You can thank left-wing Progressives like Obama, Pelosi, Reid, and some on the right for the continued destruction and consolidation which is happening in the banking sector. I am now projecting that 195 banks will fail this year.

Meanwhile, approximately $370 billion of the $700 billion TARP fund sits on the sidelines, while troubled assets remain on many bank’s balance sheets dragging them under. Wasn’t that money supposed to be used to get rid of toxic assets? Well, if Progressives are going to sit idly by and watch banks fail, then they need to give us back our $370 billion. The other $330 billion appears to be a total loss. Obama and his Progressive entourage should claim it, cut their (our) losses, and prepare for defeat at the polls.

Remember that these are the same Progressives who hate banks and corporations and who will stop at nothing in their efforts to destroy our free enterprise system and turn America into a state run socialist utopia. They must be defeated.

click to enlarge

Below is a list of the 23 banks that failed in April of 2010.

click to enlarge

Below is a comprehensive listing of the 204 banks that have failed since Obama took the reigns. There were 25 bank failures in 2008, and 3 in 2007 making the total for the present crisis 232. In contrast, during the S&L Crisis of the 1980’s and 1990’s there were 747 S&L failures at a total cost of $160.1 billion.

click to enlarge

Source: http://www.fdic.gov/bank/individual/failed/banklist.html