The Private Sector is NOT Doing Fine | How’s the Federal Government Doing?

* By: Larry Walker, Jr. *

“The Private Sector is doing fine.” ~ Barack Obama *

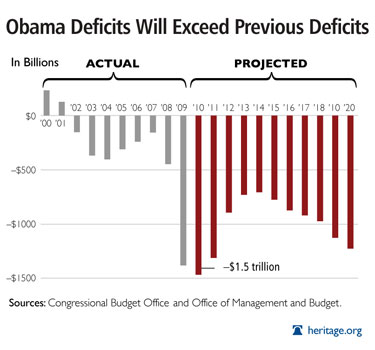
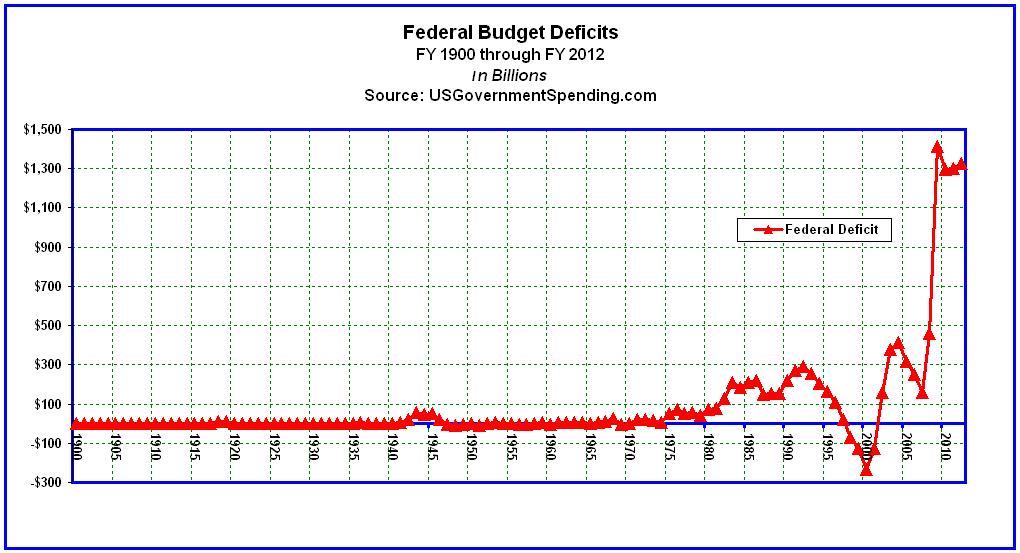
A couple days ago, Joe Weisenthal wrote an article, inappropriately entitled, “Here’s What’s Really Happened to the Private Sector Under Obama”, in which he sought to prove why Mr. Obama will be reelected. His premise, like Obama’s, is that the Private Sector is doing fine, but State and Local governments aren’t. There was no mention at all of how the Federal government, the part of the economy Mr. Obama actually influences, is doing (see the chart above). However, what Mr. Weisenthal actually did was highlight the main reasons why Mr. Obama should not be reelected, and should lose by a landslide in November. I hate to burst Mr. Weisenthal’s bubble, but he’s in La-La Land if he thinks his 24 chart presentation will convince even Mr. Obama to defend his own senseless remark.

First of all, Mr. Weisenthal’s article was inappropriately titled because by definition, the “Private Sector” is not “under Obama”, as he so implies. To the contrary, the only part of the economy Mr. Obama presides over is the Federal government, whose $16 trillion debt, $5.3 trillion of which has been added by Obama himself, actually imposes a drag on the private economy. Yet, Mr. Weisenthal supports Mr. Obama’s plea for more Federal borrowing, to be expended at the State and Local level. Secondly, Mr. Weisenthal doesn’t provide any benchmarks. It’s as if he’s comparing the pre-2010 Obama to the post-2009 Obama. That’s all well and good, but if this were baseball, Mr. Obama would be heading back to the Minor Leagues (and so he is).

Here’s a brief summary of Mr. Weisenthal’s main points (in bold type) and my comments. You may view his 24-chart catastrophe here.

  1. ‘Corporate profits after tax are higher than ever.’ – I concur. But this is primarily due to corporate austerity, which has nothing at all to do with Mr. Obama. Although some corporations have been able to increase sales, most all of them have actually improved profitability through reductions in labor and other operating costs. We call this productivity, which is something Mr. Obama could learn from, but not something he practices within his sphere of influence.

  2. Rental Income is higher than ever. – I agree. But, the fact that more than 3.3 million families lost their homes since September of 2008, and are now forced to rent, is hardly anything to boast about. Could there be any other reason for the 125% increase in rental income since the recession began, such as some program implemented by Mr. Obama? The claim that rental income has reached a new record, under the policies of Barack Obama, is more of an admission of failure than anything else.

  3. ‘Gross private domestic investment is coming back nicely.’ – If you consider a rebound to 1999 levels a nice comeback, that’s all fine and well, but I think it’s rather pathetic. By the way, this particular chart has actually moved sideways and to the right since 1999, not upwards. So far in 2012, it looks like most of what should go towards gross private domestic investment is actually being invested into U.S. Treasury’s. After all, someone has to buy all of the newly created Federal debt, and the Federal Reserve appears to be closed for business, at least for the time being.

  4. ‘The private sector has been adding jobs steadily since the end of Obama’s first year, and today there are more private sector jobs than there were before Obama took office.’ – Did he say, ‘since the end of his first year’? Of course no good Democrat should ever discuss Obama’s first year in office. It’s as if he took over the reigns in January of 2010, instead of 2009. In reality, the Private Sector lost a total of 5,051,000 jobs between January of 2009 and February of 2010, before things started to turn around. Even still, the Private Sector has only gained 55,000 jobs over the last three years and four months (not including the 839,000 jobs lost in January of 2009). This represents an annual growth rate of just 0.015%, and a total growth rate of a mere 0.050%.

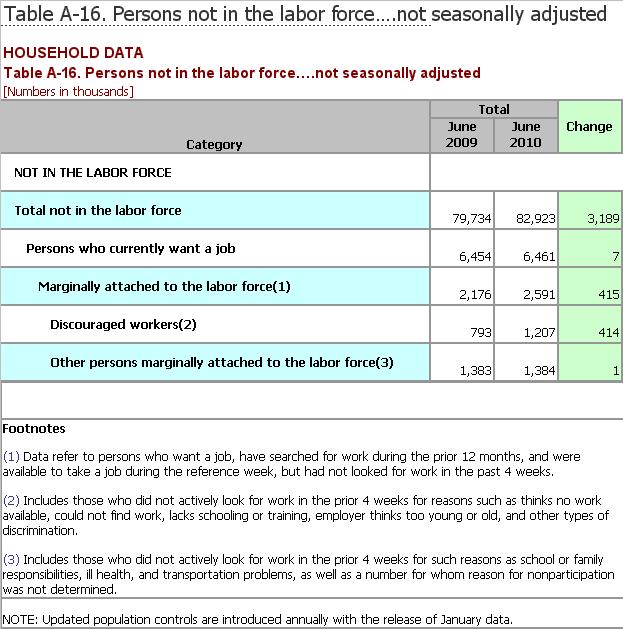
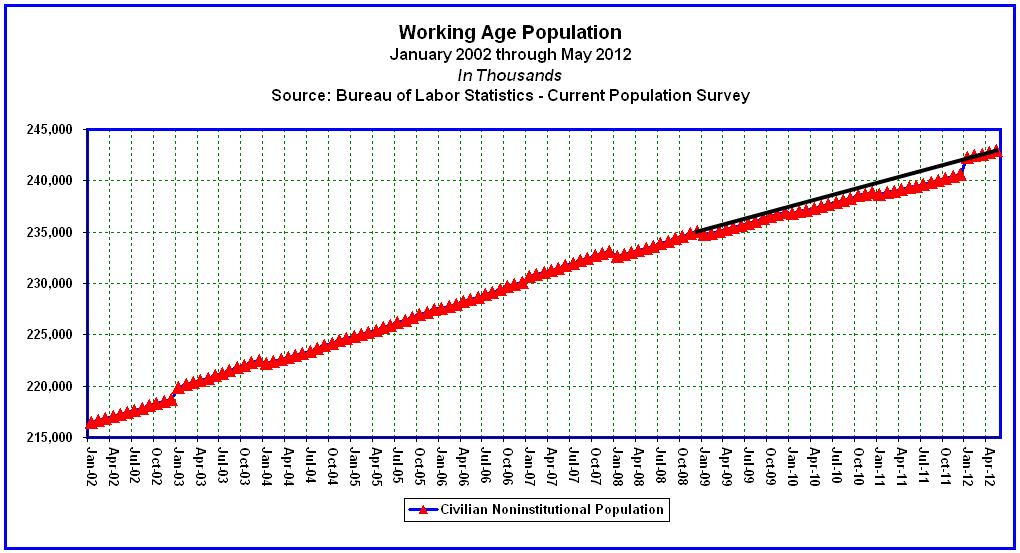
    Meanwhile, the Working Age Population increased by more than 8.2 million over the same period. So let’s see, that’s 55,000 private sector jobs created since Obama took office, for 12.2 million unemployed workers (4.0 million who had already lost their jobs before Obama took office, and another 8.2 million who reached working age during his term). That’s gotta be a record alright, but it’s not exactly the kind of record either Mr. Weisenthal, or Mr. Obama should be ginning up.

  5. ‘It would be great if the [Private] Sector were stronger, but things are going up and to the right in these charts.’ – Yes, and things are going up and to the right in some other charts as well. For example, Federal budget deficits (shown below) are far outpacing any of the statistics above. The fact that a chart is moving upwards and to the right doesn’t mean anything on its own merits. The following questions come to mind. Is this good or bad? What’s the trend? What’s the growth rate? Is it keeping pace with population growth? How is its performance against other benchmarks? Comparing the last two years and five months of Obama to his first year in office, and then drawing conclusions, is like saying that a baseball player with a batting average of .000 in his first year and who is now batting .00015 has improved. Yeah, he’s improved alright, but he won’t be playing in the Majors next year.

  6. ‘Total government employment is far below where it was when Obama started office.’ – This is true, and it’s actually a good thing. Who can afford to pay for more public sector workers when more than 23 million Americans are either unemployed or underemployed? Mr. Weisenthal and Mr. Obama seem to think that more State and Local government hiring will solve our unemployment problem. What they really mean is that the Federal government should take more money from a shrunken private sector labor force to pay others. What planet have they been living on? Apparently neither one of them received the memo issued in November of 2010.

  7. ‘Why is employment going down? Because state and local government spending growth has hit its lowest level ever.’ – The first part of this statement is false; the second part is true. To say that the decline in State and Local government spending is causing the decline in employment may fire the emotions of a few State and Local government workers, but it’s simply untrue. State governments employed a record 5,198,000 workers in January of 2009, versus 5,073,000 today. Local governments employed a record 14,588,000 in January of 2009, versus 14,077,000 today. So State and Local government employment is only off the mark by 636,000 from an all time high in January of 2009. If all 636,000 workers were rehired tomorrow, how would that solve the problem for the 23 million Americans who are either unemployed or underemployed?

    Although it’s true that State and Local government spending has declined, the reason is that revenues have plummeted. Unlike the Federal government, State and Local governments can’t spend money they don’t have. Nor should they borrow what they can’t repay. The decline in revenues is due to the downturn in real estate values, high unemployment, and the need to cover unfunded pension liabilities. With legal requirements to balance their budgets and an inability to print their own currencies, State and Local governments are prohibited from implementing the disastrous borrow-and-spend policies of Washington, DC.

  8. During the crisis, the state & local pain was mitigated by aid from the Federal Government, but that has since dropped off dramatically. – He’s referring to the part of Obama’s $831 billion Stimulus Program that went to State and Local governments in 2009/2010. Remember that? The problem is that it didn’t work then, and it won’t work now. The reason it didn’t work the first time is because it’s not the Federal government’s job to tell State and Local governments what to do. The Federal government is not in charge of State and Local budgets and thus cannot mandate more hiring.

    State and Local governments legislate according to the desire of their residents; they don’t take orders from Washington. State and Local government officials actually have to live under the policies they implement. They are in-touch with their constituents, while Mr. Obama seems to be completely out-of-touch with most of America. Even if the Federal government handed State and Local governments another $1.0 trillion to hire more workers, how would they pay those same workers in subsequent years? And if they have to pay the money back as well, how will they be able to pay the additional workers while repaying the loans? Ideas that make sense to a desperate reelection campaign are not always practical in the real world, or in the best interests of anyone other than the candidate. Think about it.

Monetizing the Debt

Mr. Obama presides over the Federal government, whose $16 trillion national debt imposes a drag on the Private Sector. For example, in 2011 the Federal Reserve monetized 77% of the Federal deficit (see chart below). By the way, that’s the opposite of what it said it would do. Eventually the Fed will have to reduce its Treasury holdings, and as you can see, the last time it did so the economy went straight into recession. Maybe the Fed can afford to sit on piles and piles of low interest Federal debt forever, but that doesn’t mean everyone else can, or will. The question Mr. Weisenthal ought to be asking himself is where will the Federal government get the money to repurchase this debt? It will ultimately come out of the Private Sector, through higher taxes, fees, and fines. The prospects for additional Federal borrowing are growing slim.

Private Sector Employment Benchmarks

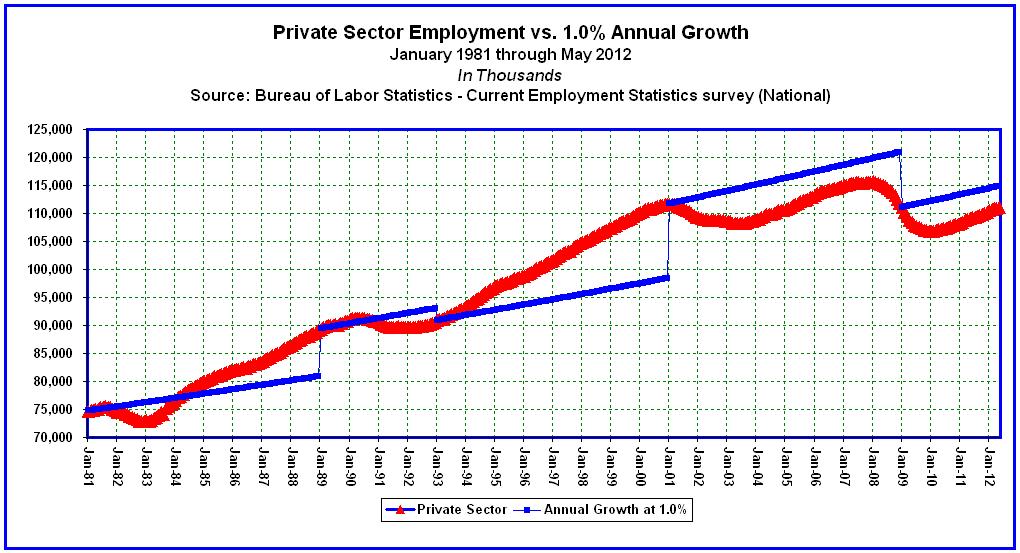
Mr. Weisenthal’s charts don’t provide any benchmarks, so I will. Assuming that Private Sector Employment should grow at the same rate as the working age population, approximately 1.0% annually, the chart below compares actual Private Sector jobs growth to a 1.0% benchmark, beginning with the terms of the last 5 presidents.

  • By the end of Ronald Reagan’s first term, Private Sector Employment beat the benchmark by 2,088,000 jobs. He was reelected based on his pro-business policies.

  • By the end of Reagan’s second term, Private Sector Employment had topped the benchmark by 8,248,000 jobs.

  • By the end of George H.W. Bush’s only term, Private Sector Employment fell behind the benchmark by 2,466,000 jobs.

  • By the end of Bill Clinton’s first term, Private Sector Employment beat the benchmark by 6,901,000 jobs. He was reelected based on small government, pro-business policies.

  • By the end of Clinton’s second term, Private Sector Employment had topped the benchmark by 13,291,000 jobs.

  • By the end of George W. Bush’s first term, Private Sector Employment had fallen behind the benchmark by 5,562,000 jobs. He was reelected based upon his strong defense and anti-terrorism policies, not for his economic record. Were it not for the War on Terror, Mr. Bush would have lost his reelection bid.

  • By the end of W’s second term, Private Sector Employment had fallen behind the benchmark by 9,100,000 jobs.

  • After three years and five month’s of Barack Obama, Private Sector Employment has fallen behind the benchmark by 3,801,000 jobs. Short of finding another reason, such as convincing Americans that the killing of thousands of innocent civilians in drone attacks is important to their security, Obama’s anti-business policies should make this his final term.

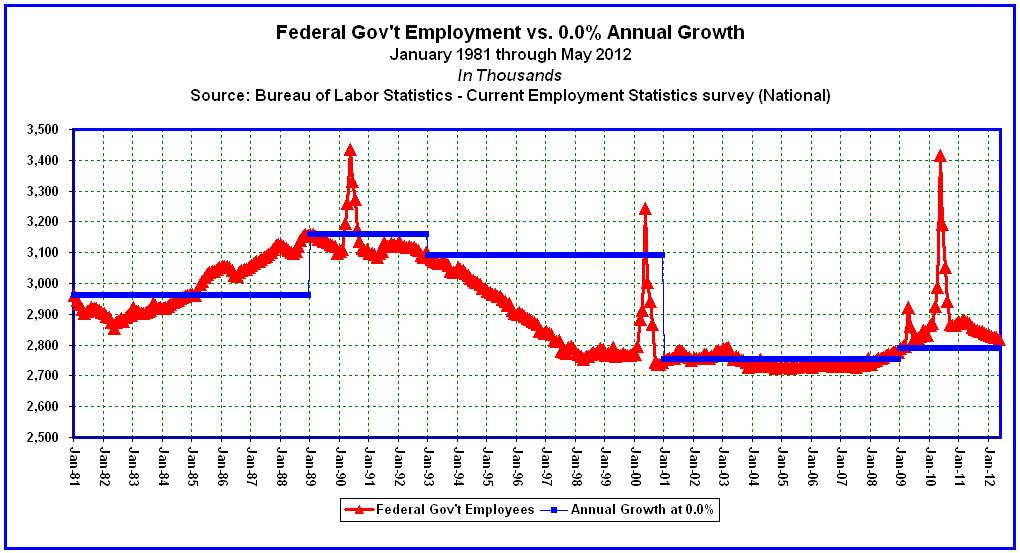
Federal Government Employment Benchmarks

Who wants more Federal workers? Instead of telling State and Local governments what to do, Barack Obama should spend some time figuring out how to shed the 29,000 Federal positions added under his administration. Assuming that Federal Government Employment should grow at 0.0% or less, the chart below compares actual Federal government jobs growth to a 0.0% benchmark, beginning with the terms of the last 5 presidents.

  • By the end of Ronald Reagan’s first term, Federal Employment exceeded the benchmark by 3,000 jobs.

  • By the end of Reagan’s second term, Federal Employment exceeded the benchmark by 195,000 jobs.

  • By the end of George H.W. Bush’s only term, Federal Employment dropped below the benchmark by 57,000 jobs.

  • By the end of Bill Clinton’s first term, Federal Employment dropped below the benchmark by 253,000 jobs.

  • By the end of Clinton’s second term, Federal Employment was below the benchmark by 347,000 jobs.

  • By the end of George W. Bush’s first term, Federal Employment dropped below the benchmark by 25,000 jobs.

  • By the end of W’s second term, Federal Employment exceeded the benchmark by 24,000 jobs.

  • After three years and five month’s of Barack Obama, Federal Employment has exceeded the benchmark by 29,000 jobs.

State Government Employment Benchmarks

Not that the Federal government has any control, but assuming that State Government Employment should grow at the same rate as the working age population, approximately 1.0% annually, the chart below compares actual State government jobs growth to a 1.0% benchmark, beginning with the terms of the last 5 presidents.

  • By the end of Ronald Reagan’s first term, State Government Employment dropped below the benchmark by 5,000 jobs.

  • By the end of Reagan’s second term, State Government Employment exceeded the benchmark by 183,000 jobs.

  • By the end of George H.W. Bush’s only term, State Government Employment exceeded the benchmark by 149,000 jobs.

  • By the end of Bill Clinton’s first term, State Government Employment dropped below the benchmark by 56,000 jobs.

  • By the end of Clinton’s second term, State Government Employment was below the benchmark by 9,000 jobs.

  • By the end of George W. Bush’s first term, State Government Employment dropped below the benchmark by 6,000 jobs.

  • By the end of W’s second term, State Government Employment was below the benchmark by 16,000 jobs.

  • After three years and five month’s of Barack Obama, State Government Employment has fallen behind the benchmark by 306,000 jobs.

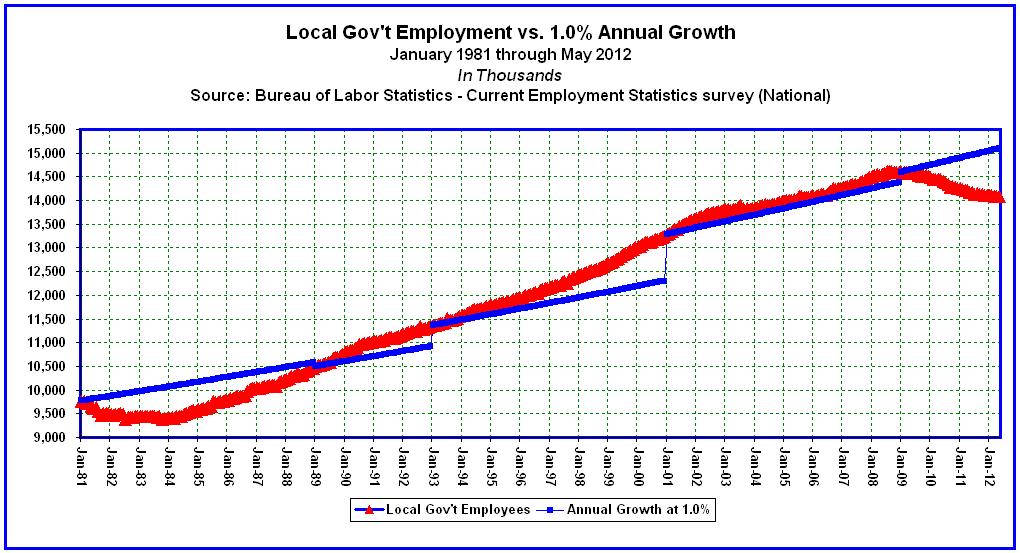
Local Government Employment Benchmarks

The Federal government has no jurisdiction over Local governments, but assuming that Local Government Employment should grow at the same rate as the working age population, approximately 1.0% annually, the chart below compares actual Local government jobs growth to a 1.0% benchmark, beginning with the terms of the last 5 presidents.

  • By the end of Ronald Reagan’s first term, Local Government Employment dropped below the benchmark by 622,000 jobs.

  • By the end of Reagan’s second term, Local Government Employment was below the benchmark by 118,000 jobs.

  • By the end of George H.W. Bush’s only term, Local Government Employment exceeded the benchmark by 416,000 jobs.

  • By the end of Bill Clinton’s first term, Local Government Employment exceeded the benchmark by 334,000 jobs

  • By the end of Clinton’s second term, Local Government Employment was above the benchmark by 943,000 jobs.

  • By the end of George W. Bush’s first term, Local Government Employment exceeded the benchmark by 151,000 jobs.

  • By the end of W’s second term, Local Government Employment was above the benchmark by 207,000 jobs.

  • After three years and five month’s of Barack Obama, Local Government Employment has fallen behind the benchmark by 1,018,000 jobs. This is certainly not due to any lack of Federal spending.

The bottom line:

If the creation of 55,000 net Private Sector jobs, over 40 months, for 23 million unemployed or underemployed Americans, is considered “doing fine”, then Mr. Obama’s prospects for a second term, one in which another 8.0 million plus will reach working-age, should be nipped in the bud right now. Mr. Obama had a fair shot and his policies failed. If he is so concerned about State and Local government employment now, then why didn’t he focus his stimulus plan on this sector back in 2009? Instead he placed the emphasis on extending unemployment benefits, which actually exacerbated the problem. And why did he focus so much of his time on passing Obamacare, instead of worrying about how 23 million unemployed and underemployed Americans would be able to afford it? This isn’t Little League. When you’re batting .00015 in the Major’s, the chances of keeping your job are pretty much nonexistent.

If Barack Obama wants to control State and Local government budgets, then perhaps he should be running for Governor, Mayor, State Senator, County Commissioner, or City Councilman. If he wants to take credit for improvements in the Private Sector, then perhaps he should take a shot at running a corporation, in his next career. But if he wanted to continue as President of the United States, he should have paid more attention to the Federal budget while he had the job. There’s an old saying, “If you want a different result, try something different.” So make up your mind today, do you want more insanity, or something different?

References:

Here’s What’s Really Happened To the Private Sector Under Obama

U.S. Government Spending

Data: Spreadsheets

Black Employment | Back to the 1970s

– Halfway to Nowhere

– Larry Walker, Jr. –

One of the figures that stood out in the July 2011 Employment Situation Report was that Black labor force participation had declined to 60.4%, or to the same level attained in March of 1973, from a rate of 63.2% in January of 2009. The rate has fluctuated between a record low of 58.5% during 1975, to a record high of 66.4% in 1999. It stood at 63.4% in December of 2007, the first month of the Great Recession, and clocked in at 62.6% when the recession ended in June of 2009. In fact, the rate hasn’t dropped below 62.0% since May of 1984. But since February of 2009, the Black labor force participation rate has declined by 2.8 percentage points, and most of that decline, 1.7 points to be precise, has occurred since the beginning of 2011. So why did Black labor force participation suddenly plummet during Obama’s 3rd year in office, over two years after the recession ended?

Black labor force participation rate – The labor force participation rate measures the labor force as a percent of the civilian non-institutional population.

From Black Employment – July 2011

Why hasn’t a Black White House resident correlated with improvement in the lives of Black and African American people, or anyone else for that matter? It’s one thing to be giddy that a Black man made it into the White House, but entirely another when you take a look around the community. The fact that the Black labor force participation rate has fallen back to 1970s levels, and exclusively on Obama’s watch, either means that his policies aren’t working; or that they are, but just in reverse.

For example, does the act of extending unemployment benefits to an historic 99-weeks mesh with increasing labor force participation? Is the act of handing out record amounts in government food stamps somehow in lock-step with prosperity? Does legislation providing a $50,000, per unemployed household, government subsidy to cover mortgage payments for up to two years help get folks back to work? Will Obama’s policies of doling out record amounts of unemployment, food stamps, and $50,000 per household mortgage subsidies, concurrently, lead us out of the ditch, or over a cliff? When ‘shovel ready’ turned out not be so shovel ready, it appears that this was Obama’s Plan B.

The Black employment-population ratio is also at 1970s levels; while the Black unemployment rate, although not the worst ever recorded, has averaged 15.6% since February of 2009.

Black employment-population ratio (Current Population Survey) – The proportion of the civilian non-institutional population aged 16 years and over that is employed.

The Black employment-population ratio has fluctuated between a record low of 48.8% from December of 1982 through January of 1983, to a record high of 61.4% in April of 2000. It stood at 57.7% in December of 2007, the first month of the Great Recession, was 55.2% in January of 2009, and clocked in at 53.3% when the recession ended in June of 2009. It has since declined to 50.8% as of July of 2011, a decline of 4.4 percentage points since Obama’s inauguration.

From Black Employment – July 2011

Black unemployment rate – The unemployment rate represents the number unemployed as a percent of the labor force.

The Black unemployment rate has fluctuated between a record low of 7.0% in April of 2000, to a record high of 21.1% in January of 1983. It stood at 9.0% in December of 2007, the first month of the Great Recession, was 12.7% in January of 2009, and clocked in at 14.9% when the recession ended in June of 2009. It has risen to 15.9% as of July of 2011, an increase of 3.2 percentage points since Obama’s inauguration.

From Black Employment – July 2011

At a fundraiser in Chicago on August 3, 2010, Barack Obama remarked, “…But the thing that we all ought to remember is that as much as good as we have done, precisely because the challenges were so daunting, precisely because we were inheriting so many challenges, that we’re not even halfway there yet. When I said ‘change we can believe in’ I didn‘t say ’change we can believe in tomorrow.’ Not change we can believe in next week.”

Well, it’s been about two and a half years already, so if they’re not even halfway “there” yet, does that mean it will take another 3, 4, 5, or 40 years? And exactly what does Obama mean by, “we’re” and “there”? Who is we, and where is there? It looks to me like our nation is around three-fourths of the way to declaring bankruptcy; the economy is maybe four-fifths of the way towards a depression, and the labor force statistics for Black and African Americans have receded to levels not seen since the 1970s and early 1980s.

So if I’m reading this correctly, as long as Obama has the bully pulpit, change will kick-in after my girls graduate from college, but not right now when it’s needed? Just wait a few more years, after my twin granddaughter’s start pre-school, but not now, two month’s before their birth, when my son needs it, eh? Heck, it may take another 40 years just to fill in the trench Obama has dug. I guess since ‘shovel ready’ wasn’t as shovel ready as he thought, and since “we’re not even halfway there”, unemployment benefits will have to be extended for another 99 weeks, while those who are able to endure carry the water. Heck, we might as well extend unemployment benefits for the rest of Obama’s term, since according to most of today’s Democrat Party, unemployment compensation and food stamps add more to the economy than the private sector anyway?

Obama has turned this economy around alright — back to the 1970s. Now he wants another four years, after he campaigns his way through the remainder of this term? Thanks, but no thanks. Every policy he’s put on the table has failed. The fact that he lost the USA’s triple-A credit rating, through devil-may-care spending, ought to say it all. What would the USA’s credit rate be after another term, since he’s only halfway there, BBB? Four more years to bobble his head from one teleprompter to the other, lecturing us on bugged out Socialist ideals from decades past, yeah right! If his plans don’t work in the real world, it may be that they are simply outdated. I say it’s time for Conservatives to take the horns of this democracy, and make a quick U-turn.

Halfway to nowhere – Heck, Obama’s policies might be succeeding beyond our wildest dreams, but we just can’t see it. Maybe where we get confused is when we open our eyes and look around. After all, he never said it was change we would be able to see, or change that would actually occur. He merely said it would be something intangible, an idea that we could believe in. In other words, a fairy tale, a chimera of the way we wish things were, but know they could never be. A world where electricity is generated without power plants, where heating oil rains down like manna from heaven, and where a big government hands us everything we need. But when we keep it in the day, and open our eyes, what do we see? – An incompetent, partisan, rascal, spouting half-truths, and railing away at his enemy, which turns out to be at least half of America.

“The best social program is a good job.” ~Bill Clinton

“I do not believe we can repair the basic fabric of society until people who are willing to work have work. Work organizes life. It gives structure and discipline to life.” ~Bill Clinton

“Nothing in this world can take the place of persistence. Talent will not; nothing is more common than unsuccessful people with talent. Genius will not; unrewarded genius is almost a proverb. Education will not; the world is full of educated derelicts. Persistence and determination alone are omnipotent. The slogan ‘press on’ has solved and always will solve the problems of the human race.” ~Calvin Coolidge

———————————————–

Definitions:

  • Labor force (Current Population Survey) – The labor force includes all persons classified as employed or unemployed in accordance with the definitions contained in this glossary.

  • Civilian non-institutional population (Current Population Survey) – Included are persons 16 years of age and older residing in the 50 States and the District of Columbia who are not inmates of institutions (for example, penal and mental facilities, homes for the aged), and who are not on active duty in the Armed Forces.

  • Employed persons (Current Population Survey) – Persons 16 years and over in the civilian non-institutional population who, during the reference week, (a) did any work at all (at least 1 hour) as paid employees; worked in their own business, profession, or on their own farm, or worked 15 hours or more as unpaid workers in an enterprise operated by a member of the family; and (b) all those who were not working but who had jobs or businesses from which they were temporarily absent because of vacation, illness, bad weather, childcare problems, maternity or paternity leave, labor-management dispute, job training, or other family or personal reasons, whether or not they were paid for the time off or were seeking other jobs. Each employed person is counted only once, even if he or she holds more than one job. Excluded are persons whose only activity consisted of work around their own house (painting, repairing, or own home housework) or volunteer work for religious, charitable, and other organizations.

  • Unemployed persons (Current Population Survey) – Persons aged 16 years and older who had no employment during the reference week, were available for work, except for temporary illness, and had made specific efforts to find employment sometime during the 4-week period ending with the reference week. Persons who were waiting to be recalled to a job from which they had been laid off need not have been looking for work to be classified as unemployed.

  • Not in the labor force (Current Population Survey) – Includes persons aged 16 years and older in the civilian non-institutional population who are neither employed nor unemployed in accordance with the definitions contained in this glossary. Information is collected on their desire for and availability for work, job search activity in the prior year, and reasons for not currently searching. (See Marginally Attached Workers.)

  • Marginally Attached Workers (Current Population Survey) – Persons not in the labor force who want and are available for work, and who have looked for a job sometime in the prior 12 months (or since the end of their last job if they held one within the past 12 months), but were not counted as unemployed because they had not searched for work in the 4 weeks preceding the survey. Discouraged workers are a subset of the marginally attached. (See Discouraged Workers.)

  • Discouraged Workers (Current Population Survey) – Persons not in the labor force who want and are available for a job and who have looked for work sometime in the past 12 months (or since the end of their last job if they held one within the past 12 months), but who are not currently looking because they believe there are no jobs available or there are none for which they would qualify.

References:

Data Tables

http://www.bls.gov/bls/glossary.htm

http://stats.bls.gov/news.release/empsit.t02.htm

http://stats.bls.gov/webapps/legacy/cpsatab2.htm

[D]issing America: The Looming [R]esurgence

D is for Dissing America

The Case for Further Tax Cuts

Ranted By: Larry Walker, Jr.

Obama’s progressive form of economic change is destroying America. Not only does he threaten to hoard the keys, but to thrust the car over a cliff. Specifically, the effect of his policies on productivity, government subsidies, tax credits, class warfare, income taxes, and government spending is doing more harm to America than the Great Recession ever could.

Taking Away the Incentive

In the private sector, when you want to motivate a workforce you offer them things like more time off, bonuses, or stock ownership. In other words you offer them something in exchange for something. The Obama administration offers nothing for those who work hard. With Obama, if you work hard, you receive the reward of paying higher taxes, fees and fines to support those who don’t work as hard, or at all. If I told my employees that next year, the lowest paid would be getting a 50% decrease in pay, and the more highly paid would receive a 10% pay cut, would they work harder? No. In the real world they would quit immediately, hang around while looking for another job, or simply decrease their performance in line with the coming downgrade. Isn’t this what Obama is doing by proffering a tax hike for those who are working hard, paying their bills on time, and in essence supporting everyone else?

The Failure Subsidy

Now let’s take a person who has been unemployed for a year and is about to lose their home. They haven’t really looked for work because they’re on 99 weeks of unemployment, courtesy of Obama, and they expect the government to step in and make up the back payments on their home. Why should this person work when they can live off of less and still get by? Their plan is to start looking for work again when all the free government benefits run out. This person has in effect been given a government subsidy not to work, at the expense of those who are working. When my teenagers can go out and find jobs in this economy, I find it hard to believe that there are no jobs. One of them gets up at 5:00 AM and goes off to bake bread, while moochers stay home to collect free checks. Why do my kids work? Because their mother told them they must either work, or get out of the house. That’s the kind of incentive that will either make you or break you. Implying that we somehow need illegal immigrants to perform undesirable work, because Americans won’t is a sad, sad excuse.

Breaking the Free-Market

At a time when home prices had fallen between 30 to 50% in some Georgia communities, in stepped the federal government with an $8,000 refundable tax credit for first time homebuyers. Initially the credit was only $7,500 and had to be repaid over a 15 year period. People were already buying houses at the time, and were turning down the initial credit because it had to be repaid, so the government, in its wisdom, made it a giveaway. Did potential buyers really need an additional incentive beyond the existing 30-50% discount? What about the hardworking folks down the street who were left paying for their largest, and now most devalued, asset? Prices may have eventually recovered on their own had fewer houses been sold in the trough, but through government intervention, now all of our houses have been hopelessly devalued. Those who received the tax credit also received the bonus of equity in their homes, while those who hung on through tough times got screwed.

The Victims

The Obama administration talks a lot about the “haves” and “have-nots”. It seems there are a lot more have-nots today, than there were in January of 2009 (roughly 6.4 million more). Those who still have a job, a business, or some savings (things that they worked hard to achieve) are the new haves. The have-nots are those who are victims of an economy, hindered by the federal government. In many cases, the have-nots are the direct victims of the federal government. Instead of motivating people to get off of unemployment, welfare, subsidized housing and food stamps, the government is increasing these programs and fostering the entitlement mentality. What incentive is there for one of these, government-made, have-nots to ever claw their way out? If working means giving half of ones labor to the government, then why even try?

Legalized Robbery

I was looking over a client’s job situation recently. The conclusion was that if she accepts the proposed contract, she and her husband will be in a position where every additional dollar she earns, for the rest of the year, will be subject to 50% in federal, self-employment, and State taxes. Is it even worth the effort? If you were offered a contract that would pay you $68,000 in five months, but you had to pay $20,000 in travel expenses to earn it, and then another $24,000 in taxes, leaving you with just $24,000 would you do it? It might be better to just stick closer to home and find a W-2 job paying $30,000. Where is the incentive when the government stands to gain 50% of ones labor? Yet the Obama administration wants to raise taxes. Hell, taxes are already too high. We need additional tax cuts, not an increase. Top tax rates should be cut back down to 28% like they were under Reagan (and even that’s too high). No one in their right mind is going to put forth maximum effort for half. It’s just not going to happen. Many have-nots ponder this same dilemma everyday.

The Spending Bonanza

If the Bush tax cuts caused such huge deficits, then how did Obama’s July 2010 budget deficit end up exceeding Bush’s 2007 annual budget deficit, by $5.0 Billion?

Per the website, Liberty Works, “the one-month deficit for July was $165,043,000,000 or $5 Billion more than the “irresponsible Bush deficit” for the entire year of 2007.”

Graph via: http://blog.heritage.org/2010/02/05/past-deficits-vs-obamas-deficits-in-pictures/

Will the government ever be able to raise enough tax revenue to cover Obama’s massive spending gap? Let me answer that for you. No. Never in a 1,000 years. The only thing certain about our exploding national debt is that more revenue will eventually be required to cover it. The question is how to increase revenue without further damaging the economy.

A Conservative [R]esurgence

What’s the solution? We need a conservative resurgence in America. Give us the incentive to produce, take away the subsidy for failure, stop tampering with the free market, and free us that we may lift the have-nots. Reduce income tax rates, and stop spending more than we have. Our present course is destined for failure.

The bottom line: Drastically cut the size of government, and don’t just freeze tax rates, cut them. You can’t just cut taxes without a corresponding reduction in spending. It doesn’t work like that. Yet, until taxes are cut, the government will be trapped in providing greater failure subsidies (bailouts), and further destructive interference with the free market. That’s how it works.

If you’re not part of the solution, you’re part of the problem.

Recovery (dot) Fail | Not Jobs

Wrong Track

Employment Situation Worse: Year-Over-Year

By: Larry Walker, Jr.

The Bureau of Labor Statistics (BLS) released their employment situation report on Friday July 2, 2010. My analysis is meant to expose facts that most casual observers ignore. Instead of the general month-to-month comparison, I am assessing changes in the employment situation over the last twelve months. This expanded view will tell us whether or not the Recovery Act is working. I will begin with my conclusions, followed by excerpts from the BLS report, and end with my analysis.

Conclusion: The employment situation is worse than it was a year ago. Although the U-6 unemployment rate stood unchanged at 16.5%, the population increased by 2.0 million, while the labor force fell by 1.0 million, making the employment situation unsustainable. The number of marginally attached and discouraged workers rose to 2.6 million, an increase of 415,000 year-over-year. The number of unemployed persons rose by 317,000. There are 919,000 fewer jobs than there were a year ago.

So much for, “the recovery is working.” So much for Progressive-Economics, the main tenets of which appear to be:

  1. Borrow huge sums of money from taxpayers and foreigners.

  2. Spend it in ways that won’t necessarily lead to job creation (i.e. tax cuts for all except for those who would use it to create jobs; more government jobs; mandatory health care; etc…)

  3. Raise taxes on the remaining smaller pool of workers who survive Steps 1 and 2, in order to pay for Step 1.

  4. Repeat Steps 1 through 3 (if you manage to survive after Step 2).

The following excerpts are from the latest BLS report entitled, THE EMPLOYMENT SITUATION — JUNE 2010:

Total nonfarm payroll employment declined by 125,000 in June, and the unemployment rate edged down to 9.5 percent, the U.S. Bureau of Labor Statistics reported today. The decline in payroll employment reflected a decrease (-225,000) in the number of temporary employees working on Census 2010. Private-sector payroll employment edged up by 83,000….

Both the number of unemployed persons, at 14.6 million, and the unemployment rate, at 9.5 percent, edged down in June….

In June, the number of long-term unemployed (those jobless for 27 weeks and over) was unchanged at 6.8 million. These individuals made up 45.5 percent of unemployed persons….

In June, about 2.6 million persons were marginally attached to the labor force, an increase of 415,000 from a year earlier. (The data are not seasonally adjusted.) These individuals were not in the labor force, wanted and were available for work, and had looked for a job sometime in the prior 12 months. They were not counted as unemployed because they had not searched for work in the 4 weeks preceding the survey….

Among the marginally attached, there were 1.2 million discouraged workers in June, up by 414,000 from a year earlier. (The data are not seasonally adjusted.) Discouraged workers are persons not currently looking for work because they believe no jobs are available for them. The remaining 1.4 million persons marginally attached to the labor force had not searched for work in the 4 weeks preceding the survey for reasons such as school attendance or family responsibilities….


Table A (click to enlarge)

A Year-over-year Analysis of the Employment Situation (Table A)

Unemployment Rate – The official unemployment rate has changed by 0.0%, from 9.5% in June of 2009 to 9.5% in June of 2010. This can be attributed to the success of the Economic Recovery Act, if you call ‘no change’ a success. However, according to table A-15, counting all marginally attached and discouraged workers, the U-6 unemployment rate, currently 16.5% was also unchanged year-over-year. (U-6 takes into consideration the total that BLS considers unemployed, plus all persons marginally attached to the labor force, plus total employed part time for economic reasons, as a percent of the civilian labor force plus all persons marginally attached to the labor force.)

The U-6 unemployment rate stood unchanged at 16.5% year-over-year.

Table A-15, click to enlarge

Civilian Labor Force – According to the BLS, the civilian labor force has declined by a little over 1 million workers, from 154.8 million in June of 2009 to 153.8 million in June of 2010. From table A-16 we learn that out of the 1 million who disappeared, 415,000 are no longer being counted because they are considered to be marginally attached (i.e. persons who want a job, have searched for work during the prior 12 months, and were available to take a job during the reference week, but had not looked for work in the past 4 weeks). Once identified, marginally attached workers are no longer counted as part of the labor force. Out of the 415,000, 414,000 are considered to be newly discouraged workers.

The number of persons no longer counted as part of the labor force, because they have stopped looking for work, increased by 415,000 year-over-year.

Civilian non-institutional population – The civilian population increased by slightly more than 2 million, from 235.6 million in June of 2009 to 237.7 million in June of 2010. So while the population increased by a little over 2 million, the labor force shrunk by 1 million, which is clearly unsustainable.

The employment situation is unsustainable.

Persons no longer in the labor force – The number of persons no longer in the labor force increased by 3.0 million, from 80.9 million in June of 2009 to 83.9 million in June of 2010. We learn from Table A-16 (below) that out of this 3.0 million, 415,000 more than a year ago are considered marginally attached (i.e. persons who want a job, have searched for work during the prior 12 months, and were available to take a job during the reference week, but had not looked for work in the past 4 weeks). We also learn from Table A-16 that a total of 6.5 million Americans who want jobs are not counted as part of the labor force, an increase of 7,000 year-over-year.

The number of marginally attached and discouraged workers rose to 2.6 million, an increase of 415,000 year-over-year.

Table A-16, click to enlarge

Number of unemployed – According to the BLS, the number of unemployed persons fell by 98,000 from 14.7 million in June of 2009 to 14.6 million in June of 2010. However, this figure ignores the increase in those considered marginally attached, so in reality the number of unemployed persons increased by 317,000 (415,000 more marginally attached minus 98,000 fewer unemployed persons) year-over-year. See Civilian Labor Force (above).

The number of unemployed persons rose by 317,000 year-over-year.

Number of employed – The number of persons employed fell by 919,000, from 140.0 million in June of 2009 to 139.1 million in June of 2010. In other words, there are 919,000 fewer people working than there were a year ago. I don’t know why Obama is out boasting about the success of his ‘Recovery Program’ when it is clearly a dud. Speaking in plain English, since there are currently 919,000 fewer jobs than there were a year ago, no jobs have been created or saved within the last twelve months (see Table A above).

There are 919,000 fewer jobs than there were a year ago.

Data Sources:

BLS Employment Situation: http://bls.gov/news.release/empsit.toc.htm

BLS Employment Summary: http://bls.gov/news.release/empsit.nr0.htm

Table A: http://bls.gov/news.release/empsit.a.htm

Table A-15: http://bls.gov/news.release/empsit.t15.htm

Table A-16: http://bls.gov/news.release/empsit.t16.htm