U.S. Jobs Deficit Sticks at 11.6 Million in October

32 Years from Full-Employment

– By: Larry Walker, Jr. –

In the fairest sense, the U.S. Jobs Deficit has improved by an average of 30,000 jobs per month since January 1, 2011. And although this may be good enough for indifferent Obama loyalists, what it really means is that based on Barack Obama’s very best job creation averages to date, full employment is still another 32 years away. Based on yesterday’s Employment Situation Report, 171,000 nonfarm jobs were added in the month of October. However, since the U.S. needs to add a minimum of 320,850 jobs each and every month for the next 60 months in order to return to full-employment, October’s result fell short of the mark by 149,850.

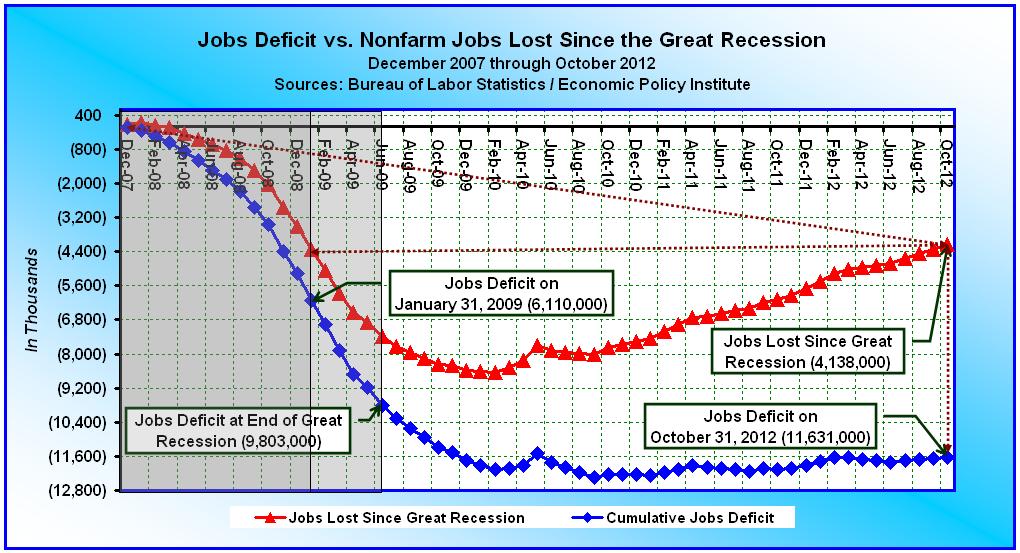
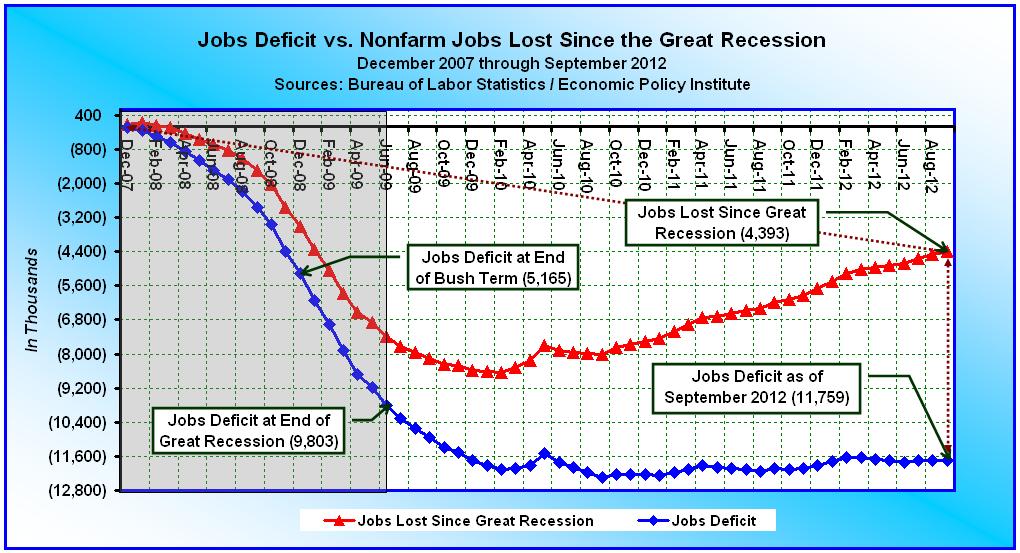
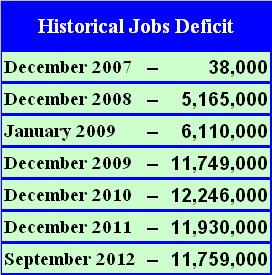
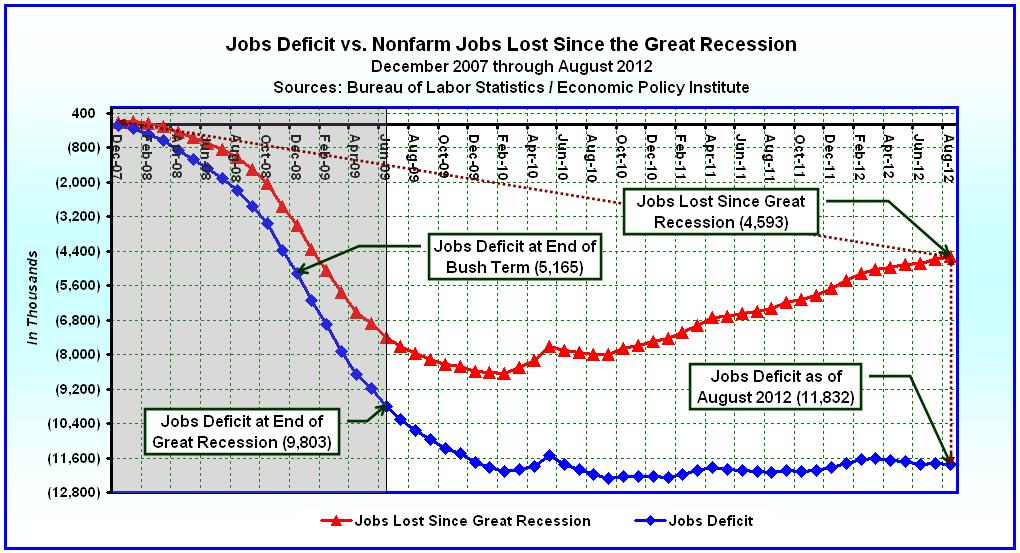
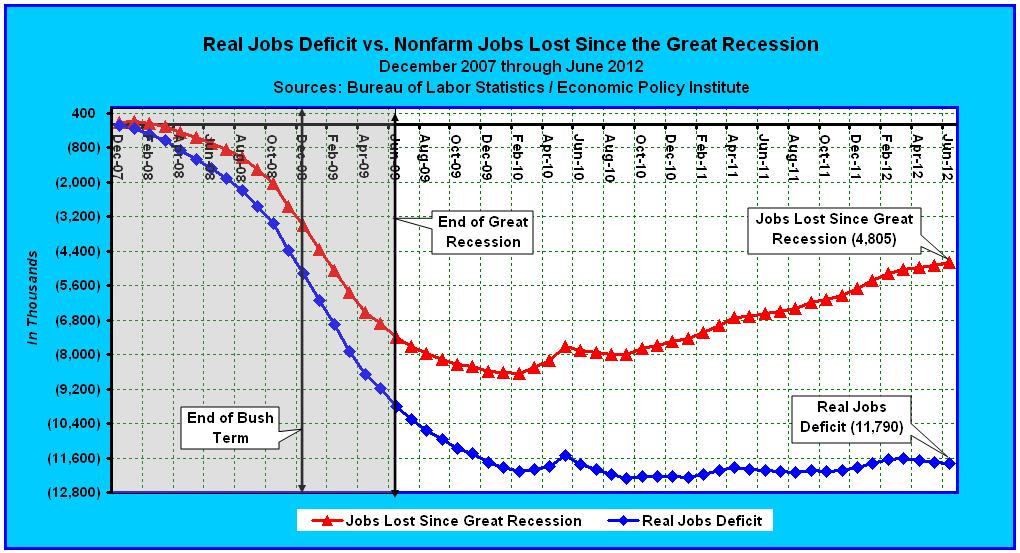
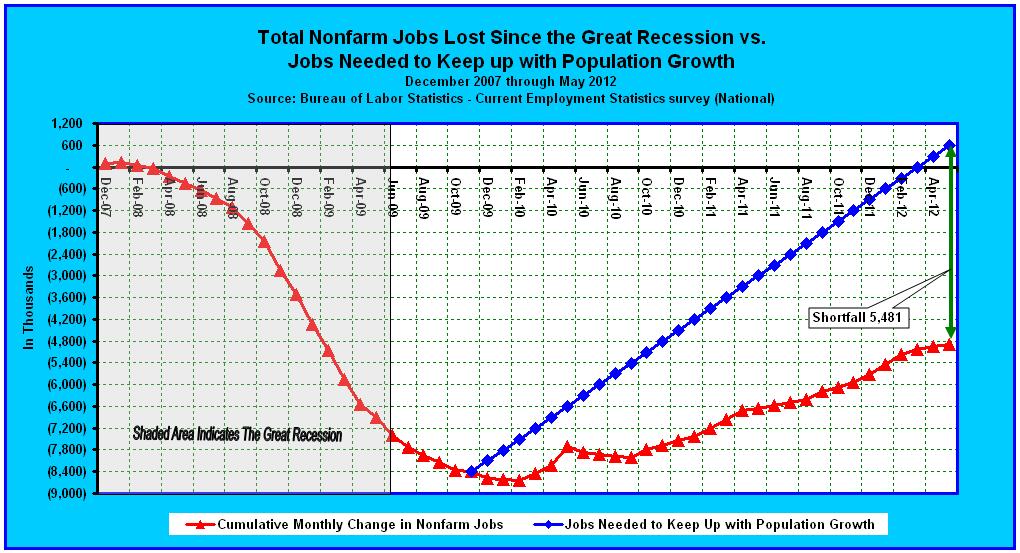
When the entire Obama record is analyzed, it turns out that U.S. employers have only added a total of 194,000 nonfarm jobs since February 1, 2009 (133,755,000 – 133,561,000). The jobs deficit has increased by 5,521,000 during Barack Obama’s 45-month term, from 6,110,000 on January 31, 2009 to 11,631,000 on October 31, 2012. The average number of nonfarm jobs created on a monthly basis in 2012 is 157,000, which is ironically the same as in 2011. In contrast, the average number of jobs created in 2010 was 86,000, compared to an average loss of (422,000) per month in 2009.

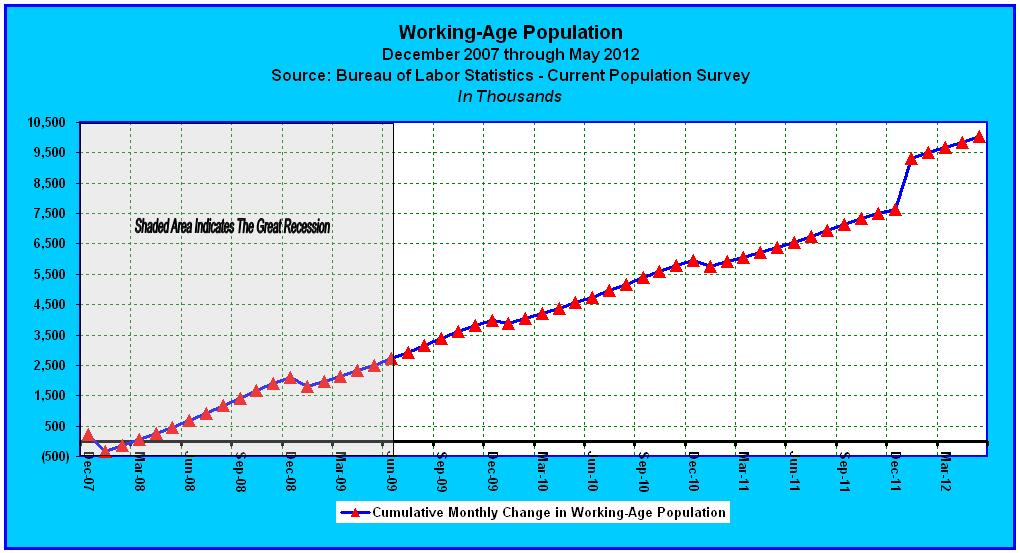
So an average of 157,000 jobs a month, over the past 22 months, is the best that Barack Obama’s policies have been able to accomplish. This may sound great to some folks, but since 127,000 new jobs are required each and every month just to keep pace with population growth, what it really means is that we are clearly locked on a trajectory that chips away at the present 11,631,000 jobs deficit by a mere 30,000 jobs per month. So what does this mean in plain English? In other words, how many jobs must the U.S. create each and every month going forward in order to reach full-employment, and how long will it take?

Updated Jobs Benchmark

Updating Paul Krugman’s original benchmark with the latest figures, we discover that to be meaningful, the number of jobs needed to return to more or less full employment by December of 2014 (the original target date), or within the next 26 months, is now 574,346 jobs a month, as follows:

In order to keep up with population growth, we would need to create 127,000 jobs times 26 months, or 3,302,000. Add in the need to make up for the jobs deficit and we’re at around 14,933,000 (3,302,000 + 11,631,000) over the next 26 months — or 574,346 jobs a month.

But since that’s never going to happen under the countermanding policies of Barack Obama, we are forced to extend the time frame. However, even when we extend the target date to 5 years from today, which will be more than 8 years from the time the recession ended, the number of jobs needed to return to more or less full employment by October of 2017, or within the next 60 months, is now 320,850 jobs a month, as follows:

In order to keep up with population growth, we would need to create 127,000 jobs times 60 months, or 7,620,000. Add in the need to make up for the jobs deficit and we’re at around 19,251,000 (7,620,000 + 11,631,000) over the next 60 months — or 320,850 jobs a month.

Did the U.S. add 574,346 jobs last month? No. Did we add 320,850? No. In fact, according to the Bureau of Labor Statistics, the U.S. has only added 194,000 nonfarm jobs since Obama took office (i.e. February 1, 2009) (see related table). So what does that tell you? It tells me that Barack Obama’s economic policies have failed miserably. He’s the one who said, “If I don’t have this done in three years, then there’s going to be a one-term proposition.” So don’t blame conservatives and independents when the earth slides from under his feet on Tuesday.

Fair Enough?

In the fairest sense, when we average the number of jobs created over the last 10 months, we arrive at 157,000 a month. And when we average the number created in 2011 we ironically get 157,000 as well. Do the math. So in other words, there has not been any improvement this year over last year. So we’re not moving forward after all, we’re stuck in neutral. And since we know that it takes a minimum of 127,000 jobs a month just to keep up with population growth, we are only chipping away at the 11,631,000 jobs deficit by 30,000 jobs a month (157,000 – 127,000). Thus, on the current trajectory, full-employment is roughly 388 months — or 32 years away.

[For the mathematically challenged, take the jobs deficit of 11,631,000 and divide it by the twenty-two month average improvement of 30,000, and you get 388 months. Now divide 388 months by 12 and you get 32 years.]

So four more years of Obama’s trickle-down-government approach places us on the track to reach full-employment by around the year 2044. And that’s giving him the benefit of the highest job creation averages achieved during his entire presidency. I’ll be 84 years old by then, and my one year old twin granddaughters will be 33. I’m sorry, but no matter how you spin the numbers, Barack Obama isn’t worthy of a second term.

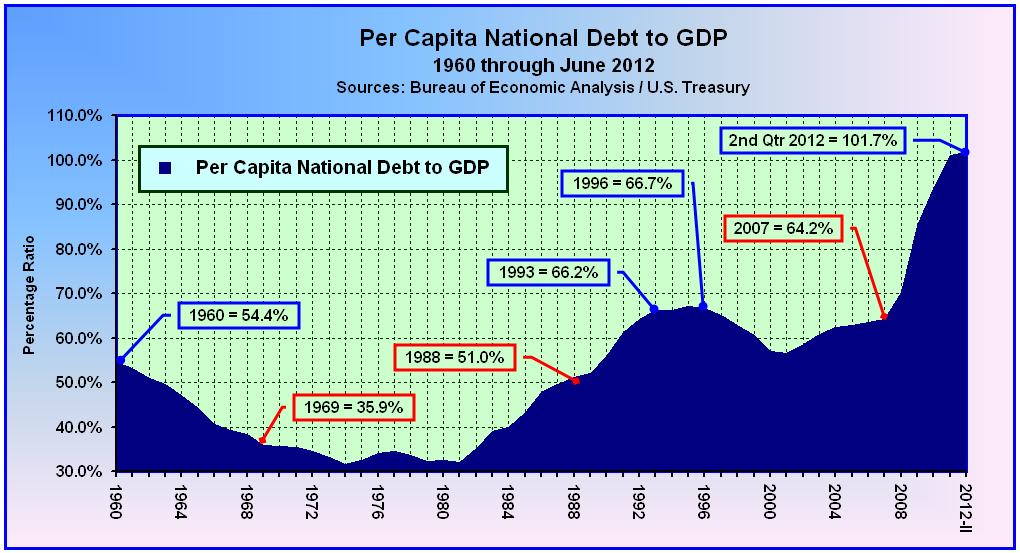
Until the number of Nonfarm jobs is expanding by a minimum of 320,850 a month for a sustained period of at least five years, anything short is bad news. The Romney-Ryan Team is the only one on the ballot with a plan targeted to come anywhere close to what’s needed. Aside from that, with the national debt already beginning its ascent towards $20 trillion, with 25 million Americans unemployed or underemployed, with the Federal Reserve devaluing our currency by printing money to purchase mortgage-backed debt on an unlimited basis, with our tax and regulatory structure mired in uncertainty, with a foreign policy meltdown, and with the price of gasoline hovering above $3.25 for a record 86 consecutive weeks, there is absolutely, positively, no reason to consider a second Obama term. None!

[Note: Paul Krugman and other left-wing cronies are now trying to push the idea that, since July 2011 only 90,000 jobs have been required to keep up with population growth. “The number used to be higher, but baby boomers are getting old — the same thing that affects the household survey.” However, even if such a radical 30% shift had occurred within the last four years, it would only alter the current jobs deficit by a diminimus amount — 592,000 jobs, from 11,631,000 to 11,039,000, so phooey! There’s no turning back now, we’re sticking with the original benchmark which Mr. Krugman laid out in December of 2009.]

Data:

Worksheet on Google Drive

Austerity Matrix

Excerpt from: Krugman’s Anti-Austerity Madness

– By: Larry Walker, Jr. –

In economics, austerity refers to a policy of deficit-cutting by lowering spending via a reduction in the amount of benefits and public services provided. Austerity policies are often used by governments to try to reduce their deficit spending and are sometimes coupled with increases in taxes to demonstrate long-term fiscal solvency to creditors. However, austerity policies don’t have to include tax hikes, and in fact as we shall see the optimal austerity policy actually involves a combination tax cuts paired with deficit reduction.

The key phrase above is “to demonstrate long-term fiscal solvency to creditors”. If there were no creditors, then politicians and government officials wouldn’t have to worry about austerity. If there were no creditors, nations could simply print their own currencies on an unlimited basis, and spend without consequence. But in the real world, since creditors exist, some measure of austerity is required no matter what emotions dictate. Besides, history itself teaches us that printing money without restraint is the surest path to the vicious spiral of hyperinflation, a large increase in the money supply not supported by gross domestic product (GDP) growth, which leads to rapid erosion of a nation’s currency and ultimately to ever more pain.

In the table below, I have summarized all the possible fiscal austerity combinations available to the United States and Europe. When viewed graphically the optimal policy choice should be clear.

Although many Americans, including the President, think the way forward should involve some combination of spending cuts and tax hikes, credit ratings agencies disagree. For example, according to Fitch Ratings Co., “Fiscal Indecision Threatens US ‘AAA’ – Under current law, tax increases and spending cuts equivalent to about 5% of GDP will take effect in 2013 – if permanent, such a “fiscal cliff” could derail the US economic recovery…” Yet it’s not the spending cuts that are problematic, deficit reduction is a must, but rather the combination of tax hikes and spending cuts.

Following the Austerity Matrix, it turns out that:

  1. Tax hikes lead to the fiscal cliff no matter what happens with spending. Why? Because tax hikes lead to private sector austerity, resulting in job and benefit cuts, which leads to lower tax revenues and less economic output. So tax hikes should be off the table. The only reason they’re still being discussed in the United States is because of Obama’s “fairness doctrine”, which if you ask me is total nonsense. Besides, raising taxes on 1% of taxpayers won’t change anything for the other 99%, where the main problem is the lack of opportunities.

  2. Maintaining current tax rates can work, but only in conjunction with spending cuts. However, this only leads to slow growth, which is basically what we have now. Our current real gross domestic product (GDP) annual growth rate of 1.3% is not enough to change the trajectory of our ever increasing jobs deficit. If tax rates are maintained while spending levels are maintained or raised, we still wind up plunging over the fiscal cliff.

  3. The optimal fiscal austerity policy involves a combination of tax cuts and deficit reduction, which leads to rapid growth, or exactly what is needed following an economic crash. But, cutting taxes while maintaining or increasing spending levels only hurtles us over the fiscal cliff.

So there is only one viable fiscal austerity alternative: Cut taxes and reduce government spending. But this always brings up the same old moth-eaten question from faithless do nothings. How will you pay for the tax cuts? The apparently not so obvious answer is — with jobs.

Did you get that? Cutting tax rates across the board, which incidentally is included in the Romney-Ryan Plan, is not a way of giving anyone anything, since the government is merely enabling everyone to keep more of their own money. The dirty little secret is that this is how you grow an economy. When the government confiscates less money from the private sector, the economy eventually finds its footings and will dig its own way out of any hole. I challenge anyone to show me when this form of austerity has ever been implemented and failed to deliver greater revenues and higher levels of economic growth.

At this point you’re probably thinking, “Well, Bill Clinton raised taxes and cut spending and everything was copacetic.” But according to history, that’s actually incorrect. Although it’s true that President Clinton raised taxes during his first term, government spending also increased, that is until 1995 when his Democratic party lost control of both Houses of Congress.

It was actually during his second term when the austerity policy I’m talking about took place. That’s when Republicans passed the Taxpayer Relief Act of 1997, a reconciliation bill that reduced taxes and hence increased the deficit, paired with the Balanced Budget Act of 1997 (H.R. 2014 and H.R. 2015 respectively), each signed by President Clinton. Thus, it was actually tax cuts in conjunction with deficit reduction which produced the boom of the 1990’s, not the Clinton tax hikes.

The only differences between 1997 and today are that the United States wasn’t teetering on the edge of a fiscal cliff, and Republicans don’t currently control both Houses of Congress, but the solution to greater revenues, less spending and higher economic growth is the same.

Photo Credit:

Covertress | From Riches to Rags: Inflation & Poverty in Zimbabwe

U.S. Jobs Deficit Improves by 1,000 in September

Measuring Relevance

:: The U.S. Jobs Deficit declined by 73,000 in September, however since it increased by 72,000 just one month prior, the result was a net improvement of an entire 1,000 jobs since July.

– By: Larry Walker, Jr. –

The ever elusive jobs deficit rose from 11,760,000 in July to 11,832,000 in August, and then pulled back to 11,759,000 based on yesterday’s Employment Situation Report. Employers added 114,000 jobs for the month, while the July and August figures were revised upward by 86,000. Thus, the U.S. realized a net gain of an even 200,000 Nonfarm jobs in September. And, since the U.S. needs to create a minimum of 127,000 jobs a month solely to keep pace with population growth; this results in an overall improvement to the jobs deficit of 73,000, as compared to the prior report. However, since the deficit increased by 72,000 in August, it really amounts to a net improvement of a mere 1,000 jobs since July.

Here’s the big picture. Today 12,088,000 Americans are officially unemployed (down from 12,544,000 in August). Another 6,427,000 are unemployed and want jobs, but have dropped out of the labor force and are not officially counted (down from 7,031,000 in August). Still another 8,613,000 are employed part-time for economic reasons (up from 8,031,000 in August). What this means is that 27,128,000 American’s are still unemployed or underemployed, an amount essentially unchanged since August. The truth is that if Barack Obama’s trickle-down-government approach had worked, then the jobs deficit wouldn’t be worse today than it was in December 2009, when it registered in at 11,479,000, yet it is.

In light of September’s minuscule improvement, how many jobs must now be created each month in order to reach full-employment? How long will this take? And, in light of the answer, is another four years of Obamanomics the cure? But first here’s a quick synopsis.

Synopsis

What is the jobs deficit? — It’s a measure of how far the United States has strayed from full-employment during the current economic recovery. More specifically, it tracks the shortfall in the number of jobs needed to keep up with population growth, and to recover those lost since the Great Recession.

Basically, the U.S. has needed to add 127,000 jobs a month since December 2007, the month the recession commenced, simply to keep up with population growth. Thus, a minimum of 7,366,000 new jobs have been needed since the recession began (58 months times 127,000). However, instead of adding jobs, the U.S. has instead lost 4,393,000 (see related table). So since we needed to add a minimum of 7,366,000, but instead lost 4,393,000, the sum of the two equals the current jobs deficit of 11,759,000 (see chart above). Got it?

Who initiated the benchmark, some right-wing economist? — No. The idea was actually initiated by Economist Paul Krugman. Here’s a quote from his December 2009 column: “Even if we add 300,000 jobs a month, we’re looking at a prolonged period of suffering — a huge cost from the Great Recession. So that’s kind of a minimal definition of success. Anything less than that, and it’s bad news.” But sadly, since December 2009, the U.S. has only averaged about 127,000 jobs a month. So in other words, we’ve basically been treading water since the measure was first established. For more, see Paul Krugman’s New York Times opinion piece entitled, The Jobs Deficit.

Updated Jobs Benchmark

Updating Mr. Krugman’s benchmark with the latest figures, we discover that to be meaningful, the number of jobs needed to return to more or less full employment by December of 2014 (the original target date), or within the next 27 months, is now 562,518 jobs a month, as follows:

In order to keep up with population growth, we would need to create 127,000 jobs times 27 months, or 3,429,000. Add in the need to make up for the jobs deficit and we’re at around 15,188,000 (3,429,000 + 11,759,000) over the next 27 months — or 562,518 jobs a month.

Since this isn’t going to happen under the evanescent policies of Barack Obama, we might as well extend the time frame. But, even if we extend the target date to 5 years from today, which will be more than 8 years from the time the recession ended, then the number of jobs needed to return to more or less full employment by September of 2017, or within the next 60 months, is now 322,983 jobs a month, as follows:

In order to keep up with population growth, we would need to create 127,000 jobs times 60 months, or 7,620,000. Add in the need to make up for the jobs deficit and we’re at around 19,379,000 (7,620,000 + 11,759,000) over the next 60 months — or 322,983 jobs a month.

Did the U.S. add 562,518 jobs last month? Nope. In fact we haven’t come anywhere close during the entire Obama recovery. Did U.S. employers add 324,200 jobs last month? Nope. We haven’t even come close to that, with the exception of the single month of May 2010, but those were just temporary Census jobs which disappeared in subsequent months.

Le Coup de Grâce

When averaged, the number of Nonfarm jobs created since the end of January of 2009 comes to a loss of -20,000 jobs a month. Well, that doesn’t work. So if we average the number of jobs created over the last 9 months, we arrive at 146,000 a month. That’s better. And when we divide this into the 4,393,000 jobs lost since the recession began, it tells us that at the current pace we should recover the jobs lost to the recession in another 30 months, or 2.5 years. That’s fantastic! It means it will only have taken 6.5 years to get back to square one!

The only problem with this less than rosy scenario is that since we still need to create a minimum of 127,000 jobs a month, in order to keep up with population growth, based on the 9-month average, the jobs deficit is only declining by 19,000 jobs a month (146,000 – 127,000). Thus, full-employment is more like 619 months away, or another 52 years. So four more years of the trickle-down-government approach places us on track to reach full-employment by around the year 2064. Huh? Sorry Democrats but, we can’t wait.

No matter how you spin the numbers, they aren’t good. Until we see the number of Nonfarm jobs expanding by a minimum of 322,983 a month, for a sustained period of at least five years, anything short is just bad news. The addition of 114,000 jobs in September was 65% short of the mark required to reach the long-term target. And with the national debt hovering above $16 trillion, and beginning its ascent towards $20 trillion, there’s really no good reason to consider a second Obama term. None!

The Obama-Biden program establishes a goal of creating 1,000,000 new manufacturing jobs over the next four years, which would be an improvement, considering their policies have thus far resulted in a loss of 610,000, since January 2009. But that only accounts for a potential of 250,000 jobs per year, or around 21,000 a month. What about the other 300,000 jobs?

In stark contrast, the Romney-Ryan Plan includes a goal of creating more than 12,000,000 jobs over the next four years, or more than 250,000 a month. So which plan is most likely in the best interests of the United States? The one we’ve already witnessed for the last four years, or something different? Vote Romney-Ryan for real change. Hey, it’s math! It’s arithmetic! It’s all about relevance! You can’t fool the jobs deficit.

“You can fool some of the people all of the time, and all of the people some of the time, but you can not fool all of the people all of the time.” ~ Abraham Lincoln

Data: Worksheet on Google Drive

Photo Credit: Direct Relevance | University of Miami, Department of Computer Science

Krugman’s Anti-Austerity Madness

Kicking Common Sense Down the Road

– By: Larry Walker, Jr. –

When one of today’s most brilliant liberal economists recently mentioned the European fiscal crisis, he said, “Spain is suffering the hangover from a huge housing bubble, which caused both an economic boom and a period of inflation that left Spanish industry uncompetitive with the rest of Europe. When the bubble burst, Spain was left with the difficult problem of regaining competitiveness, a painful process that will take years.”

Yet, when far less knowledgeable left-wingers, including the President, speak of America’s economic woes, they routinely regurgitate the meaningless thread, “We are suffering from 8 years of failed Bush policies.” But what does that mean? Aside from a flawed monetary policy which bails out cronies while treading on everyone else, and an out of control government which has become accustomed to borrowing and spending 50% more than its revenue, are we not also suffering the hangover from a huge housing bubble, which caused both an economic boom and a period of inflation that has left us uncompetitive with the rest of the world?

If it were possible for left and right to agree on our most pressing problems, perhaps we would have a chance of solving them, but when one ideology slovenly blames everything on the sum total of one man’s policies without distinguishing between what works and what doesn’t, we are condemned to the same infinite loop occurring in Europe. The only difference being that their fate ends with austerity, while ours ends with a plunge into a hyperinflationary abyss.

When referring to Europe’s current morass, economist Paul Krugman says, “But the truth is that the protesters are right. More austerity serves no useful purpose; the truly irrational players here are the allegedly serious politicians and officials demanding ever more pain.” Wait, austerity serves no useful purpose? It sounds like Mr. Krugman is saying that the protestors, fire bombers, and destroyers of personal property are the rational players, while serious politicians and officials seeking austerity are among the irrational. So what is austerity, and why would anyone in their right mind side with the protestors while deeming such measures irrational?

Austerity

In economics, austerity refers to a policy of deficit-cutting by lowering spending via a reduction in the amount of benefits and public services provided. Austerity policies are often used by governments to try to reduce their deficit spending and are sometimes coupled with increases in taxes to demonstrate long-term fiscal solvency to creditors. However, austerity policies don’t have to include tax hikes, and in fact as we shall see the optimal austerity policy actually involves a combination tax cuts paired with deficit reduction.

The key phrase above is “to demonstrate long-term fiscal solvency to creditors”. If there were no creditors, then politicians and government officials wouldn’t have to worry about austerity. If there were no creditors, nations could simply print their own currencies on an unlimited basis, and spend without consequence. But in the real world, since creditors exist, some measure of austerity is required no matter what emotions dictate. Besides, history itself teaches us that printing money without restraint is the surest path to the vicious spiral of hyperinflation, a large increase in the money supply not supported by gross domestic product (GDP) growth, which leads to rapid erosion of a nation’s currency and ultimately to ever more pain.

In the table below, I have summarized all the possible fiscal austerity combinations available to the United States and Europe. When viewed graphically the optimal policy choice should be clear. Although many Americans, including the President, think the way forward should involve some combination of spending cuts and tax hikes, credit ratings agencies disagree. For example, according to Fitch Ratings Co., “Fiscal Indecision Threatens US ‘AAA’ – Under current law, tax increases and spending cuts equivalent to about 5% of GDP will take effect in 2013 – if permanent, such a “fiscal cliff” could derail the US economic recovery…” Yet it’s not the spending cuts that are problematic, deficit reduction is a must, but rather the combination of tax hikes and spending cuts.

Following the Austerity Matrix, it turns out that:

  1. Tax hikes lead to the fiscal cliff no matter what happens with spending. Why? Because tax hikes lead to private sector austerity, resulting in job and benefit cuts, which leads to lower tax revenues and less economic output. So tax hikes should be off the table. The only reason they’re still being discussed in the United States is because of Obama’s “fairness doctrine”, which if you ask me is total nonsense. Besides, raising taxes on 1% of taxpayers won’t change anything for the other 99%, where the main problem is the lack of opportunities.

  2. Maintaining current tax rates can work, but only in conjunction with spending cuts. However, this only leads to slow growth, which is basically what we have now. Our current real gross domestic product (GDP) annual growth rate of 1.3% is not enough to change the trajectory of our ever increasing jobs deficit. If tax rates are maintained while spending levels are maintained or raised, we still wind up plunging over the fiscal cliff.

  3. The optimal fiscal austerity policy involves a combination of tax cuts and deficit reduction, which leads to rapid growth, or exactly what is needed following an economic crash. But, cutting taxes while maintaining or increasing spending levels only hurtles us over the fiscal cliff.

So there is only one viable fiscal austerity alternative: Cut taxes and reduce government spending. But this always brings up the same old moth-eaten question from faithless do nothings. How will you pay for the tax cuts? The apparently not so obvious answer is — with jobs.

Did you get that? Cutting tax rates across the board, which incidentally is included in the Romney-Ryan Plan, is not a way of giving anyone anything, since the government is merely enabling everyone to keep more of their own money. The dirty little secret is that this is how you grow an economy. When the government confiscates less money from the private sector, the economy eventually finds its footings and will dig its own way out of any hole. I challenge anyone to show me when this form of austerity has ever been implemented and failed to deliver greater revenues and higher levels of economic growth.

Because strait is the gate, and narrow is the way, which leads to life, and few there be that find it. ~ Matthew 7:14

At this point you’re probably thinking, “Well, Bill Clinton raised taxes and cut spending and everything was copacetic.” But according to history, that’s actually incorrect. Although it’s true that President Clinton raised taxes during his first term, government spending also increased, that is until 1995 when his Democratic party lost control of both Houses of Congress. It was actually during his second term when the austerity policy I’m talking about took place. That’s when Republicans passed the Taxpayer Relief Act of 1997, a reconciliation bill that reduced taxes and hence increased the deficit, paired with the Balanced Budget Act of 1997 (H.R. 2014 and H.R. 2015 respectively), each signed by President Clinton. Thus, it was actually tax cuts in conjunction with deficit reduction which produced the boom of the 1990’s, not the Clinton tax hikes.

The only differences between 1997 and today are that the United States wasn’t teetering on the edge of a fiscal cliff in the late 1990’s, and Republicans don’t currently control both Houses of Congress, but the solution to greater revenues, less spending and higher economic growth is the same.

Sophism

Austerity measures are the only way to avoid the bitter lessons of the Weimar Republic, and Zimbabwe. In this sense, serious politicians and government officials recommending the correct form of austerity, a combination of tax cuts and deficit reduction, are among the World’s most rational. But where are they? I actually agree with Mr. Krugman when he infers that the brand of austerity being practiced in Spain, tax hikes in conjunction with spending cuts, is detrimental, but that’s only one of nine possible fiscal austerity combinations, and as shown above — it’s one that doesn’t work. But, although Mr. Krugman has rightly identified the problem, his solution — printing money, and continuing to borrow and spend — is even more irrational.

Not all austerity programs are bad. Tax cuts paired with deficit reduction is the only austerity plan that works, and the only one any nation will ever need. Egging on protestors and attempting to create rifts between Germans and Spaniards solves nothing, nor does begging creditors to pour billions of dollars into a bottomless pit. Thus madmen like Mr. Krugman and those swigging from the same jar of Kool-Aid may be viewed as nothing more than facetious enablers of irrational whiners, crybabies and in some cases common criminals.

On June 7, 2012, Fitch Ratings downgraded Spain’s credit rating by three notches from A to BBB, or to just above junk bond status. So Spain skipped A (-), BBB (+) and sank straight to BBB with a negative outlook. This means that its borrowing costs went up, as investors demand higher and higher interest rates to compensate for the increased risk of default. It also means that fewer and fewer investors are inclined to funnel their savings into such improvidence, at least not until they see the fruits of a serious and meaningful austerity plan.

In the meantime, Spain’s loan delinquencies as a percentage of all loans continues to spike, its housing prices continue to deteriorate adding to the spike in loan delinquencies, and its unemployment remains at 24.63% further adding to its woes and the stressed loan market. If Spain follows the advice of Mr. Krugman, and rejects some form of austerity, it will continue on the course of a fourth-rate, junk bond servant, destined to borrow more and more simply to cover its debt service until it is eventually toppled by an adversary, plunges back into the Stone Ages, or otherwise succumbs to extinction.

Wrap

On September 14, 2012, Egan-Jones Ratings Co. downgraded its United States sovereign rating to AA (-) from AA on concerns that the Fed’s new round of quantitative easing, or QE3, will hurt the U.S. economy. In a note, the ratings agency said, “From 2006 to present, the US’s debt to GDP rose from 66% to 104% and will probably rise to 110% a year from today under current circumstances; the annual budget deficit is 8%. In comparison, Spain has a debt to GDP of 68.5% and an annual budget deficit of 8.5%.”

Technically, the United States is worse off than Spain; the only consolation being a lower unemployment rate. But then again we don’t count all of our unemployed. In the United States persons are classified as unemployed if they do not have a job, have actively looked for work in the prior 4 weeks, and are currently available for work. Thus, when someone is unemployed but wants to work, if they have not looked for work in the last 4 weeks they are no longer counted (i.e. not in labor force). In fact, according to the Bureau of Labor Statistics – Table A-16, a total of 7,018,000 working age persons have dropped out of the labor force since January of 2009. If they were counted, the number of unemployed would be 19,562,000, and the official unemployment rate would be 12.1% (19,562,000 / 161,663,000).

From my perspective, despite all of the distractions, the Romney-Ryan ticket is more serious about tackling the nation’s deteriorating debt and employment trajectories, than the Obama-Biden road show, which continues to make promises it knows it can’t deliver. Obama-Biden had a fair shot and only made our fiscal situation worse than it was four years ago. It was on Obama’s watch that, the United States sovereign credit rating was downgraded for the first time in history (with a negative outlook). Although not every ratings agency participated in the downgrade, those that haven’t are simply waiting for the outcome of the November elections.

What should be clear is that another four years of irrational fiscal policies won’t make things better. There are only so many combinations of fiscal austerity measures, and only one leads to rapid economic growth. The Romney-Ryan Plan, which involves a combination of across-the-board tax cuts paired with deficit reduction fits the bill. In contrast, the Obama-Biden script, which by law is already fixed on a Grecian-Spaniard style combination of tax hikes and spending cuts doesn’t. Vote Romney-Ryan for serious-minded fiscal leadership, or vote Obama-Biden for irrational, Weimarian, sophistic, subordination.

References:

Paul Krugman: Europe’s Austerity MadnessHere’s why the protesters in Spain and Greece are right that inflicting more and more pain serves no useful purpose.

Anthony B. Sanders: Spain’s Loan Delinquency Spike as House Prices, Unemployment Continue to Deteriorate

Photo Credit:

Mount Holyoke College – The Weimar Republic and Revolt 1918-23The photograph shows children playing with bundles of worthless money.

Labor Force Stagnation Concealed by Obama

25 More Terms

– By: Larry Walker, Jr. –

Forget about four more years. Based on the USA’s current trajectory, it would take another 25 terms, or 98 years, for Barack Obama’s bizarre economic policies to restore the U.S. Labor Force to where it should be in the next four years, when compared to the growth rates achieved under the policies of George W. Bush. And then once that’s been achieved, based on the trajectory of the USA’s 11,832,000 Jobs Deficit, it will take something on the order of infinity to reach full-employment. So what’s the point of another Obama term, to fundamentally destroy the Global economy?

Earlier this month micro-journalists were roused over the fact that 368,000 additional workers dropped out of the labor force during the month of August. For the first time many were awakened to the fact that this was the only reason the official unemployment rate declined from 8.3% to 8.1%, but that’s about as far as they ventured. A handful went on to extrapolate that the real unemployment rate is actually 11.2% when based on the same labor force participation rate in place when Obama entered office, but hindsight is 20/20. A more substantive analysis would involve utilizing this information in order to project where we are headed.

Backwards

Last Friday, Egan-Jones Ratings Co. downgraded its U.S. sovereign rating to AA- from AA on concerns that the Fed’s new round of quantitative easing, or QE3, will hurt the U.S. economy. The ratings agency said the Fed’s plan of buying $40 billion in mortgage-backed securities a month and keeping interest rates near zero does little to raise GDP, reduces the value of the dollar, and raises the price of commodities. In a note Egan-Jones said, “From 2006 to present, the US’s debt to GDP rose from 66% to 104% and will probably rise to 110% a year from today under current circumstances; the annual budget deficit is 8%. In comparison, Spain has a debt to GDP of 68.5% and an annual budget deficit of 8.5%.”

Topping this, according to the Economic Cycle Research Institute, the federal government’s release of overstated preliminary data is obscuring real-time evidence of recession. For example, the Obama Administration is purposefully overstating preliminary labor statistics in order to give a boost to his re-election bid, but this is a dangerous practice, because by the time economists are able to determine that we are in recession, it will be too late to issue a warning. In contrast, under the Bush Administration preliminary statistics were typically understated, and thus we had warning several month’s prior to the Great Recession.

Based on the August Employment Situation Report, the economy added a mere 96,000 jobs, while June and July’s numbers were revised downward by 41,000. Thus, the U.S. realized a net gain of just 55,000 Nonfarm jobs in the month of August. But micro-journalists ran with the 96,000 figure, basically ignoring a history of 42 consecutive months of subsequent downward revisions, as though this figure won’t also be revised downward next month. Nevertheless, since the economy needs to create 127,000 jobs a month just to keep up with population growth, the result led to an increase in the jobs deficit, which currently stands at 11,832,000.

As outlined in the last post, U.S. Jobs Deficit Increases by 72,000 in August, to be meaningful, the number of jobs needed to return to more or less full employment by December 2014, or within the next 28 months, is now 549,571 jobs a month. And even if we extend the target date to 5 years from today, which will be more than 8 years from the time the recession ended, the number of jobs needed to return to more or less full employment by August 2017, or within the next 60 months, is now 324,200 jobs a month. So even though micro-journalists ignored the fact that only 55,000 jobs were added in August, and instead sought to convince the public that 96,000 were added, it really doesn’t matter. What should be made clear is the point that we will never reach full-employment at the current trajectory.

Labor Force Stagnation

According the Bureau of Labor Statistics, the labor force grew by 10,436,000 during George W. Bush’s term, which encompassed two recessions (see chart below). During the first recession, which lasted from March 2001 to November 2001, the labor force grew by 539,000. And even during the first 13 months of the Great Recession (end of the Bush term), from December 2007 through January 2009, the labor force continued to expand by 401,000. In contrast, during Barack Obama’s full term to-date, the labor force has grown by a mere 409,000. In other words during Obama’s entire term the labor force has grown at a recession pace.

Even worse, the Great Recession ended in June 2009, yet from July 2009 to August 2012 the labor force actually shrank by 85,000. This means that, under the policies of Barack Obama, the U.S. labor force has performed worse than during the most recent recessions – way worse. Thus, the economy is not growing, it’s shrinking. So what about that?

  • Labor Force Growth During Bush Term (+)10,436,000

  • Annual Labor Force Growth Rate During Bush Term 0.907%

  • Labor Force Growth During Obama Term (+)409,000

  • Annual Labor Force Growth Rate During Obama Term 0.076%

  • Labor Force Contraction Since June 2009 (-)85,000

The Labor Force grew at an annual rate of 0.907% during both Bush terms, which is close to the rate of population growth, while annual growth has been almost immeasurable during Obama’s term, at just 0.076%. So what does this mean? It means that under Barack Obama’s trickle-down-government, borrow-and-spend economic policies, and based on the USA’s current trajectory, it will take approximately 25 more terms (98.1 years) for the labor force to grow to where it should be in the next four years. So perhaps instead of crying “four more years,” Obama loyalists should be shouting “98 more years,” because four more just won’t cut it.

Aside from the Constitution, the only other problem with anointing Barack Obama as our first Dictator is that even if all 7,031,000 Americans who have dropped out of the labor force during his term, those who still want jobs now, suddenly decided to return to the labor market, there’s no guarantee they would find work, because of the Jobs Deficit which currently stands at 11,832,000. In fact, based on the USA’s current trajectory, it will take something on the order of infinity to reach full-employment. Thus, hardcore Obama loyalists might as well be shouting, “Obama forever”.

But fortunately, most of us don’t have forever to wait, which is precisely why we need to end this ridiculous charade right now. There’s only one Plan on the ballot this November, and only one man capable of turning things around. And by turning things around, no, I don’t mean going back to the same policies which caused the last recession. That would be lame. I mean returning our government to some semblance of honesty and integrity. A POTUS who ignores his own jobs council, and then inundates the nation with lies and distortions, while concealing the truth about the economy, isn’t a problem solver; he is the problem of our day, the present, right now, today.

The first step in repairing the Republic is to vote this deceiver out of office. The second step involves hiring a turnaround guy, someone who doesn’t know how to fail, and then trusting in God to help him get us back on the right track.

Data: Worksheet on Google Drive

U.S. Jobs Deficit Increases by 72,000 in August

Obama’s Cure – More Jokes

– By: Larry Walker, Jr. –

The U.S. Jobs Deficit increased by 72,000 in August, rising from a deficit of 11,760,000 in July to 11,832,000, based on Friday’s Employment Situation Report. The economy added a mere 96,000 jobs in August, while June and July’s numbers were revised downward by 41,000. Thus, the U.S. realized a net gain of 55,000 Nonfarm jobs in the month of August. But since the economy needs to create 127,000 jobs a month in order to keep up with population growth, this resulted in an overall increase to the jobs deficit of 72,000, as compared to the previous report.

Having been informed of the news prior to his DNC acceptance speech, that the hopes and dreams of another 72,000 Americans had been decimated, along with those of an estimated 27 million who were already unemployed or underemployed, Barack Obama slid into his quotidian comedy routine, ridiculing conservative economic policies, stating that, “They want your vote, but they don’t want you to know their plan. And that’s because all they have to offer is the same prescription they’ve had for the last thirty years: ‘Have a surplus? Try a tax cut.’ ‘Deficit too high? Try another.’ ‘Feel a cold coming on? Take two tax cuts, roll back some regulations, and call us in the morning!’”

Here’s the big picture. We had a recession which lasted for the last 12 month’s of the Bush term through the first 6 month’s of Obama’s, not for the last 30 years. Today 12,544,000 Americans are counted as officially unemployed. Another 7,031,000 are unemployed and want jobs, but have dropped out of the labor force and are thus not officially counted. And still another 8,031,000 are employed part-time for economic reasons. The truth is that if Barack Obama’s government-down, borrow-and-spend policies worked, then the jobs deficit wouldn’t be worse-off today than it was in December 2009, yet it is. So enough with the jokes, how many jobs need to be created each month in order to reach full-employment, and how long will it take? And in light of the answer, is four more years of Obama’s deficit spending and light-mindedness the cure?

Obama Got Jokes

No Mr. President, it’s not a surplus, or a cold that we feel coming on, it’s something much more fatal. You see, the U.S. National Debt surpassed the $16 trillion mark before Obama took to the podium. And why is this problematic? Well for one, the USA’s credit rating was already downgraded once on Obama’s watch, on August 5, 2011, the first such occurrence in American history. And secondly, because Barack Obama’s prescription for all that ails our economy is the same one he’s offered for the last 4 years: ‘Debt too high? Borrow and spend some more.’ ‘Entitlement spending bankrupting the nation? Add a new entitlement (Obamacare), then borrow and spend even more.’ ‘Job creation numbers insufficient? Tell more jokes, then borrow and spend a little bit more.’

Yet while Barack Obama has elected to waste the last four years of our lives running up the national debt, while capping on conservative economic policies, the U.S. jobs deficit has increased from 5,165,000 in December 2008 to 11,832,000, an increase of 6,667,000 (see chart below). Essentially, what this means is that since Obama implemented his $831 billion Stimulus plan, the economy has been unable to create a sufficient number of jobs for 6,667,000 new entrants, many of whom have been ushered straight out of high school or college into hopelessness and generational dependency. Do you think this is funny? I don’t. Exactly where have four years of Barack Obama’s borrow-and-spend prescription refills landed us?

Updated Jobs Benchmark

Updating Economist Paul Krugman’s job creation benchmark with the latest figures, we discover that to be meaningful, the number of jobs needed to return to more or less full employment by December of 2014, or within the next 28 months, is now 549,571 jobs a month, as follows:

  • In order to keep up with population growth, we would need to create 127,000 jobs times 28 months, or 3,556,000. Add in the need to make up for the jobs deficit and we’re at around 15,388,000 (3,556,000 + 11,832,000) over the next 28 months — or 549,571 jobs a month.

If we extend the target date to 5 years from today, which will be more than 8 years from the time the recession ended, then the number of jobs needed to return to more or less full employment by August of 2017, or within the next 60 months, is now 324,200 jobs a month, as follows:

  • In order to keep up with population growth, we would need to create 127,000 jobs times 60 months, or 7,620,000. Add in the need to make up for the jobs deficit and we’re at around 19,452,000 (7,620,000 + 11,832,000) over the next 60 months — or 324,200 jobs a month.

Did the U.S. add 549,571 jobs last month? Nope. In fact we haven’t come anywhere close in any month during the entire Obama recovery. Did employers add 324,200 jobs last month? Nope. In fact, we haven’t even come close to this number in any month during the entire Obama recovery, except for the single month of May 2010, but those were just temporary Census jobs that went away in subsequent months (see the related table).

The sad truth is that the U.S. only added 55,000 Nonfarm jobs in August (+96,000 minus 41,000 of previous overstatements). And because the jobs deficit increased by 72,000, we are currently on track towards a permanent decline. In other words, it is impossible to reach full-employment while the jobs deficit is increasing. Thus, we are NOT moving in the right direction, we are moving towards another recession. We have wasted 44 months coping with the unreasonable economic policies of Barack Obama, and what did we get in return? We are worse off today than before he started.

Incomplete or Deficient?

At this point, we either need to create 549,571 jobs each and every month to be on a track towards full employment within the next 28 months, or 324,200 jobs each and every month to be on track towards full employment within the next 5 years (which will be more than 8 years from the end of the recession). And although Barack Obama has orated a plan which would add 600,000 new jobs in Natural Gas by 2020 (or over the next 8 years), and 1,000,000 new Manufacturing jobs over the next four years, we are forced to give his plan a grade of “D” for deficient. Under Obama’s government-down, borrow-and-spend economic policies, most of us will indeed be in “a better place” by the time the U.S. reaches full-employment.

A lot of my friends, neighbors, and clients lost their jobs, lost their homes, divorced or filed for bankruptcy over the last 3 years and eight months. My neighborhood has been decimated, as our homes have lost a third of their value. Our business revenues have declined and leveled off at a lower tier. And as far as I can see, only one political party offers any hope of turning things around. The Obama-Biden plan includes a goal of creating 1,000,000 new manufacturing jobs over the next four years, which would be great, because their policies have thus far resulted in a loss of 582,000 manufacturing jobs since January 2009. In stark contrast, the Romney-Ryan Plan includes a goal of creating more than 12,000,000 jobs in the next four years, which is entirely doable.

I don’t care what the policies are as long as they lead to the desired result. The Obama-Biden goal is deficient. Even if the plan works, it won’t result in a sufficient number of new jobs to even keep pace with population growth (127,000 a month / 1,524,000 per year). In fact, Obama has set the bar so low that his plan is incapable of eliminating the jobs deficit, even if granted a second term. So what’s the point? Based on our current trajectory, Obama’s plan never comes close to full-employment, ever.

If you think that adding $5.3 trillion to the national debt over four years, establishing a goal of 1,000,000 new jobs when more than 12,000,000 are needed, and sprinkling it over with meaningless ramblings of a far-left gagman is a plan, then you might need to get your head examined. But if the cure for what ails America today really does involve reducing the growth of government spending, reducing income taxes and capital gains taxes, reducing the number of government regulations, and creating more than 12,000,000 new jobs in the next four years, and you reject it in favor of the former, then God help us all. If you’re still sane after filtering through all the nonsense, then you know what you have to do. Vote for the Plan, there’s only one.

Data: Worksheet on Google Drive

U.S. Jobs Deficit Holds at 11,760,000 in July

Break Out the Fairy Dust –

“The largest single barrier to full employment of our manpower and resources and to a higher rate of economic growth is the unrealistically heavy drag of federal income taxes on private purchasing power, initiative and incentive.” ~ John F. Kennedy, Jan. 24, 1963, special message to Congress on tax reduction and reform

– By: Larry Walker, Jr. –

The U.S. Jobs Deficit declined by 30,000 in July, falling from 11,790,000 in June, to 11,760,000, based on yesterday’s Employment Situation Report. While May’s number was revised upward by 10,000, and June’s number was revised downward by 16,000, the economy added a mere 163,000 jobs in July. And since we need to create 127,000 jobs a month, just to keep up with population growth, this resulted in an overall decline in the jobs deficit of 30,000 compared to the month prior (see chart below).

Emboldened by the 30,000 net improvement to the jobs deficit, Barack Obama ridiculed Mitt Romney’s economic plan, stating that, ‘the idea that tax cuts would pay for themselves by way of a “massive boom in the economy” is “fairy dust” that the GOP has “tried to sell” in the past and hasn’t worked.’ But what’s ironic is that even July’s tiny increase in jobs can be attributed to nothing more than traces of fairy dust leftover from the Bush Tax Cuts of 2003. To state otherwise, would infer that allowing the Bush Tax Cuts to expire would have yielded a better result, and surely not even Obama believes that one.

According to U.C. Berkley Professor and President Obama’s former Chair of his Council of Economic Advisers (CEA), Christina Romer, in a paper published in 2010, a tax increase of 1.0% of GDP, reduces output over the next three years by nearly 3.0%. I would add that a decline of 3.0% in output equates to a loss of around 12.7 million jobs. So does it take a rocket scientist to understand that a tax cut of 1.0% of GDP would have the opposite effect, increasing output over the next three years by nearly 3.0%, and adding around 12.7 million jobs? Call it voodoo, fairy dust, Reaganomics, supply-side economics or whatever you wish, but it’s really just common sense.

“Tax increases appear to have a very large, sustained and highly significant negative impact on the economy.” ~ Christina Romer (just prior to leaving the Obama Administration)

What’s wrong with a little fairy dust?

Obama’s misconception is steeped in the theory of Static Revenue Analysis, while Mitt Romney’s plan is based on Dynamic Revenue Analysis, or if you prefer “fairy dust”. Obama wants to raise taxes on the top 2% of income earners while doing absolutely, positively, nothing for the other 98% of Americans. Great plan Stan. On the other hand, Romney wants to cut personal income tax rates by 20% across-the-board on all Americans, eliminate taxes on interest, dividends and capital gains on those making less than $200,000, eliminate the death tax, eliminate the alternative minimum tax and lower the top corporate tax rate from 35% to 25%. What’s wrong with that?

Under Obama’s static theory, the size of the economy, the number employed persons, personal incomes, and the amount of income tax collected are all fixed. Following are five common assumptions under his static theory.

  1. If you’re not working today, you will never work again.

  2. If you are working today and making $25,000 a year, you’ll be making $25,000 for the rest of your life.

  3. Since the official U-6 unemployment rate is currently 15.0%, it will remain so indefinitely.

  4. If taxes are cut, the rich will pay less in taxes (unproven).

  5. Because the government collected roughly $2.4 trillion in taxes last year, unless tax rates are hiked, it will collect roughly the same amount every year going forward, from exactly the same taxpayers.

Thus, under static theory, the only way the government can get more money, Obama’s ultimate goal, is by raising taxes, and any reduction in tax rates would result in a permanent reduction in revenue.

Under Romney’s dynamic theory, the belief is that the stimulative effect of allowing citizens to keep and spend more of their own money will result in growth in the size of the economy, the number of working persons, personal incomes and the amount of tax revenue. Following are five common assumptions under dynamic theory.

  1. If you’re not working today, you will eventually find a job and start paying income taxes.

  2. If you are already working and making $25,000, your income will eventually rise and you’ll end up paying more in taxes than you were before, albeit at a lower tax rate.

  3. The economy will reach full-employment.

  4. When taxes are cut, the rich will pay more in taxes (proven), and more people will become rich.

  5. An increase in economic output yields an increase in the number of working persons, which means more taxpayers, and thus greater government revenues.

What we should understand is that supply-side economics has always worked in the past and always will in the future. In the 1980’s it was called Reaganomics, but pejoratively referred to as “trickle-down” or “voodoo” economics. Today, according to Barack Obama it’s just “fairy dust”. How original. Call it what you will, it does work, and that’s more than can be said of Obamanomics.

In the 1980’s, the four pillars (i.e. fairy dust) of Reagan’s economic policy were to reduce the growth of government spending, reduce income tax and capital gains tax, reduce government regulation of economy, and control the money supply to reduce inflation. Mitt Romney’s five point plan builds on Reagan’s four pillars, his policies also cut the deficit, reduce income and capital gains taxes, reduce the number of government regulations and create a Reagan Economic Zone to strengthen free-enterprise and the U.S. Dollar world-wide. What’s wrong with that?

Revised Jobs Benchmark

So where have Barack Obama’s policies gotten us? Well, extending Economist Paul Krugman’s job creation benchmark and updating it with the latest figures, we discover that to be meaningful, the number of jobs needed to return to more or less full employment by December of 2014, or within the next 29 months, is now 532,517 jobs a month, as follows:

In order to keep up with population growth, we would need to create 127,000 jobs times 29 months, or 3,683,000. Add in the need to make up for the jobs deficit and we’re at around 15,443,000 (3,683,000 + 11,760,000) over the next 29 months — or 532,517 jobs a month.

If we extend the target date to 5 years from today, then the number of jobs needed to return to more or less full employment by July of 2017, or within the next 60 months, is now 323,000 jobs a month, as follows:

In order to keep up with population growth, we would need to create 127,000 jobs times 60 months, or 7,620,000. Add in the need to make up for the jobs deficit and we’re at around 19,380,000 (7,620,000 + 11,760,000) over the next 60 months — or 323,000 jobs a month.

The Bottom Line: Since we only created 163,000 jobs in July, and since the jobs deficit declined by a mere 30,000, under the policies of Barack Obama, we are something in the order of 54 years away from full-employment [(323,000 / 30,000 = 10.8) and (10.8 * 5 = 54 years)]. In other words, we are NOT moving in the right direction, we aren’t moving at all. Due to a waste of 43 months under the failed policies of Barack Obama, we must now create 532,000 jobs each and every month to be on a track towards full employment within 29 months, or 323,000 jobs each and every month to be on track towards full employment within 5 years. Thus, since Obamanomics has pushed us so far away from the mark that most of us living today will never see full-employment again within our lifetimes; perhaps a little “fairy dust” is in order.

Photo Credit: Where’s the antimatter then? | Michigan State University

Data: Worksheet on Google Drive

U.S. Jobs Deficit Grows by 47,000 in June

Going Around in Circles

~ “If you’re lost in the woods and you feel like you’re walking in circles, you probably are.” ~ Discovery News

– By: Larry Walker, Jr. –

According to the Economic Policy Institute (EPI), the U.S. economy needs to create a minimum of 127,000 each month in order to keep pace with population growth. And based on today’s Employment Situation Report, the economy created just 80,000 jobs in June. That means the jobs deficit increased by another 47,000 last month. Yet, according to Barack Obama, “That’s a step in the right direction.” However, according to economic common sense, it’s another step towards stagnation, then decay and dissolution.

He added, “We can’t be satisfied because our goal was never to just keep on working to get back to where we were back in 2007.” So according to Obama, his goal was never to just keep working to get back to where we were in 2007, a day when we had 4,805,000 jobs more than we have currently. “I want to get back to a time when middle-class families and those working to get into the middle class have some basic security,” he said. We are left to wonder what time that was – the 1920’s, 50’s, 60’s, 80’s, 90’s, or the 2000’s. But based on the latest jobs report, that time could have been any year prior to Obama’s term.

Returning to December of 2007, the month the last known recession began, and applying the Economic Policy Institute’s (EPI) estimate — that we need to create a minimum of 127,000 jobs each and every month to keep up with population growth — we discover that the jobs deficit, since then, has grown to 11,790,000. The deficit stood at 5,165,000 jobs when Obama was inaugurated, and has since grown by an additional 6,625,000. So does that sound like, “a step in the right direction?”

As you can see graphically in the chart above, the jobs deficit has little changed since left-wing Economist Paul Krugman’s December of 2009 assessment. According to Krugman, to be meaningful, the economy needed to add 300,000 jobs a month, from the end of Obama’s 11th month in office, through December of 2014. But since then, as shown in the corresponding table, the jobs deficit hasn’t decreased at all.

Last month, according to the Bureau of Labor Statistics, the U.S. economy created a mere 80,000 jobs, on top of a revised 78,000 in May, and 68,000 in April. But the economy needs to create 127,000 jobs a month just to keep pace with population growth. So that means we’ve fallen 156,000 jobs farther behind over the last quarter. In fact, at last quarter’s pace, the U.S. will find itself another 3,120,000 jobs in arrears in another 5 years (156,000 jobs * 20 quarters). We know that any result short of a 127,000 monthly increase in Nonfarm payroll jobs adds to the current jobs deficit, but we should be mindful of an even more important statistic: The number of jobs we need to create each and every month, in order to catch up.

New Jobs Benchmark

When we tweak Krugman’s December 2009 benchmark with the latest figures, we discover that to be meaningful, the number of jobs needed to return to more or less full employment by December of 2014, or within 2 ½ years is now 520,000 jobs a month, as follows:

  • In order to keep up with population growth, we would need to create 127,000 jobs times 30 months, or 3,810,000. Add in the need to make up for lost ground and we’re at around 15,600,000 (3,810,000 + 11,790,000) over the next 30 months — or 520,000 jobs a month.

However, if we just simply write-off Barack Obama’s last 3 ½ years as a foolish, but costly experiment, and extend the target date out another 5 years, or through June of 2017, then we come up with 323,500 jobs a month, as follows:

  • In order to keep up with population growth, we would need to create 127,000 jobs times 60 months, or 7,620,000. Add in the need to make up for lost ground and we’re at around 19,410,000 (7,620,000 + 11,790,000) over the next 60 months — or 323,500 jobs a month.

In other words, we aren’t moving in the right direction, we’re going in circles. Since the economy now needs to create 520,000 each and every month to be on a track towards full employment within 2 ½ years, or 323,500 jobs each and every month to be on track towards full employment within 5 years, Obama’s record of 80,000 jobs in June has only pushed us farther away from the mark. In fact, as I alluded to above, instead of heading towards full-employment, we are currently on track towards increasing the jobs deficit by another 3,120,000 jobs over the next 5 years.

The Bottom Line: As each month passes in which fewer than 127,000 jobs are created, the goal of full employment is pushed farther away. When Barack Obama was sworn into office, the U.S. was running at a deficit of 5,165,000 jobs, but since then the deficit has increased by an additional 6,625,000 jobs (see table). So we are NOT moving in the right direction, no matter what Barack Obama thinks. We’re just going around in circles. The Spiritual Principle behind Step One in any recovery program is Honesty. When Barack Obama says we are moving in the right direction, he’s not being honest with himself, or with the American people.

Photo Credit: Mr. Barlow’s Blog – Are you going round in circles?

Data: Worksheet on Google Docs

The Real Jobs Deficit | Moving in the wrong direction.

“Every time in this century we’ve lowered the tax rates across the board, on employment, on saving, investment and risk-taking in this economy, revenues went up, not down.” ~ Jack Kemp

* By: Larry Walker, Jr. *

A total of 3,514,000 Nonfarm jobs had already been lost by the time President Bush handed the keys over to Barack Obama, yet even though the Great Recession officially ended in June of 2009, an additional 4,889,000 jobs were lost during Obama’s first 11 months in office (see table). By November of 2009 the recession had eliminated an estimated 8,403,000 jobs. It was at this point that Nobel Prize Winning Economist Paul Krugman set forth a reasonable benchmark for a return to more or less full employment within 5 years.

According to Mr. Krugman’s theory, in order to keep up with population growth and recover the number of jobs lost would have required the creation of 300,000 jobs per month, through December of 2014. But, as I pointed out in Obama Jobs Scorecard – Part 3, today we find ourselves more than 5.4 million jobs short of this mark. However, the real jobs deficit is even more dire.

The Real Jobs Deficit

If we return to December of 2007, the month the recession began, and apply the Economic Policy Institute’s estimate — that we need to create a minimum of 127,000 jobs each and every month to keep up with population growth — we find that the real jobs deficit, since the recession began, is currently 11,742,000 (see table). As you can see graphically in the chart below, the jobs deficit hasn’t changed much since Paul Krugman set the benchmark at 300,000 jobs a month. Since then, as shown in the corresponding table, the jobs deficit hasn’t decreased at all, but has rather increased by 291,000.

Real Jobs Deficit

Last month, according to the Bureau of Labor Statistics, the U.S. economy created a mere 69,000 jobs (only 77,000 in the month prior). Since we need to create 127,000 a month just to keep pace with population growth that means lately we’ve been falling even farther behind. In fact, at last month’s rate, the U.S. will find itself another 3,190,000 jobs in arrears after another 4 ½ years of Obama’s economic policies [(127,000 – 69,000) * 55 months]. So we need to keep a close eye on the next official Employment Situation Report, and each subsequent report through Election Day. Anything short of a 127,000 increase in Nonfarm payroll jobs adds to the current jobs deficit, while a greater result means we’re at least moving in the right direction.

The New Jobs Benchmark

If we tweak Paul Krugman’s original jobs benchmark with the revised figures, we discover that to be meaningful, the number of jobs we need to create to return to more or less full employment by December of 2014 is now as follows:

  • In order to keep up with population growth, we would need to create 127,000 jobs times 31 months, or 3,937,000. Add in the need to make up for lost ground and we’re at around 15,679,000 (3,937,000 + 11,742,000) over the next 31 months — or 505,774 jobs a month.

However, if we just simply write-off Barack Obama’s first 3 ½ years as a foolish, but costly experiment, and extend the target date until May of 2017, then we come up with the following:

  • In order to keep up with population growth, we would need to create 127,000 jobs times 60 months, or 7,620,000. Add in the need to make up for lost ground and we’re at around 19,362,000 (7,620,000 + 11,742,000) over the next 60 months — or 322,700 jobs a month.

In other words, we are worse off today than we were 2 ½ years ago. Every month that we create 506,000 jobs or more puts us on track towards full employment within 2 ½ years. Every month we create 320,000 jobs puts us on track towards full employment within 5 years. But every month we create fewer than 127,000 jobs increases the jobs deficit and pushes the goal of full employment farther away.

The Bottom Line: Due to the Great Recession, we already had a jobs deficit of 5,165,000 when Barack Obama was sworn into office, but since then the deficit has increased by an additional 6,577,000 (see table). In other words, we’re NOT moving in the right direction, no matter what Barack Obama says. So who’s going to get us out of this ditch — the same guy who just dug a hole twice as deep as the one we were already in — or someone else?

Data Table: Real Jobs Deficit Spreadsheet on Google Docs

Obama Jobs Scorecard, Part 3 : The American Dream

“53 Percent of All Young College Graduates in America are either Unemployed or Underemployed” ~ The Economic Collapse

* By: Larry Walker, Jr. *

It is a fact that the U.S. economy has lost a total of 4,884,000 Nonfarm jobs since the beginning of the Great Recession. But according to the National Bureau of Economic Research, the recession officially ended three years ago. We would all like to believe that things aren’t so bad, that the glass is half full, but for many the American Dream appears to be fading away. The question we should be asking ourselves, three years into this economic recovery, is whether we are creating a sufficient number of jobs each and every month: (1) to keep pace with population growth, and (2) to recover the number of jobs already lost? Today, we will provide the answer.

The Working-Age Population

The Civilian Non-institutional Population, or as I prefer to call it, the Working-Age Population, includes persons 16 years of age and older residing in the 50 States and the District of Columbia, who are not inmates of institutions (i.e. penal and mental facilities, or homes for the aged), and who are not on active duty in the Armed Forces. According to the Bureau of Labor Statistics, Table A-1, one month before the recession began, the working-age population totaled 232,939,000, and as of May 31, 2012 it had grown to 242,966,000. Thus, the working-age population has increased by 10,027,000 persons since the start of the recession, and by 7,931,000 since they keys were handed to Barack Obama (see chart below).

Since we know that the economy had already lost a total of 3,514,000 jobs during the last 13 month’s of President Bush’s term, that it has shed another 1,370,000 jobs since Barack Obama’s inauguration, and that the working-age population has grown by 10,027,000 persons over the same period, the question is how many jobs must we create each and every month in order to catch-up? And in light of the answer, how does anyone get away with a statement like the following: We’ve created 4.3 million new jobs over the last 27 months, over 800,000 just this year alone. The private sector is doing fine?

Krugman’s Benchmark

In Paul Krugman’s December 2009 article entitled, The Jobs Deficit, he proposed a rather useful benchmark for the level of jobs the U.S. must create each month to really matter. As of November 2009 we had lost about 8.4 million jobs from the time the recession began. He began with the Economic Policy Institute’s (EPI) estimate that we need to add 127,000 jobs per month just to keep pace with population growth. That very same month, EPI pointed out that when you put together the number of jobs lost since the recession, along with the number required to keep pace with the population, that in order to return to pre-crisis unemployment within two years we needed to add 580,000 jobs a month.

Krugman conceded that there was no way this was going to happen within two years. So he proffered a more modest goal: a return to more or less full employment in 5 years. According to his formula, in order to keep up with population growth over those 7 years (December 2007 to December 2014), “the United States would have had to add 84 times 127,000 or 10.668 million jobs.” Krugman stated, “If that sounds high, bear in mind that we added more than 20 million jobs over the 8 Clinton years.” He continued, “Add in the need to make up lost ground, and we’re at around 18 million jobs over the next five years — or 300,000 a month.”

So using Krugman’s 300,000 jobs per month benchmark beginning in December 2009, I have created the following chart showing where we are today (in red), versus where we would be if we were truly keeping pace with population growth and making up for the jobs lost due to the recession (in blue). As you can see, we are currently more than 5.4 million jobs short of where we need to be.

The Great Recession officially ended in June of 2009 (a fact that many seem to gloss over), and as of November 30, 2009 it had consumed 8,403,000 jobs. A total of 3,514,000 had already been lost when President Bush handed the job off to Barack Obama, but an additional 4,889,000 jobs were lost during Obama’s first 11 months. It was at this point that Paul Krugman set forth this reasonable benchmark. We have needed to create 300,000 jobs per month, since December 2009, to keep up with population growth, and to recover the jobs lost up to that point. However, where we find ourselves today is 5,481,000 jobs short of the mark.

Yet, it was on June 8, 2012 when Barack Obama declared, “We’ve created 4.3 million new jobs over the last 27 months, over 800,000 just this year alone. The private sector is doing fine.” However, what he was talking about was the number private sector jobs recovered since March 2010. What he conveniently forgot to mention is the fact that we also lost 5,135,000 Nonfarm jobs during his first 14 months in office. What about that Mr. President? In fact, had he bothered to include the number of public sector, or government jobs, his statement would have been more accurately stated as follows: ‘We’ve recovered 3,765,000 Nonfarm jobs over the last 27 months, but we lost 5,135,000 during my first 14 months in addition to the 3,514,000 lost under President Bush, so we have a long, long way to go.’

Yes it’s true, we have lost 1,370,000 jobs since Barack Obama was sworn into office, and that’s on top of the 3,514,000 jobs lost from the time the recession began until President Bush handed the keys to Mr. Obama. But the bad news is that not only have we suffered the loss of 4,884,000 Nonfarm jobs since December of 2007, but we must also account for the fact that during the current recovery, we are 5,481,000 jobs short of where we ought to be. At this point we need to not only make up for the 5,481,000 jobs we are short, but we need to do so while creating an additional 300,000 jobs per month by the end of 2014. In other words, if we apply Paul Krugman’s benchmark, we now have 31 months left to create 14,781,000 jobs (9,300,000 + 5,481,000). That means we need to seriously up the pace from last month’s gain of 69,000 jobs to 476,806 jobs per month.

When Barack Obama stood before a teleprompter this month, and gloated about how well his policies have done over the last 27 months of his 41-month term, he wasn’t being honest with the American people. His dishonesty regarding the economy, among other things, is why he deserves to lose this election by a landslide.

Labor Force Participation Ages 16 to 19

Like many Americans my age, I started working at the age of 16. Although my first job was only a part-time summer job, it was my first, and thus the beginning of my personal quest for the American Dream. My dream at the time was to open a savings account, buy a car (or at least pitch in on the gas), buy my own food and clothing, gain a sense of independence, and learn to be personally responsible.

There are kids who were 12 years old when the recession commenced, who are now 16 and looking forward to their first summer job, but if they can’t find work, they will miss out on some valuable lessons in the quest for the American Dream. There are others who are now 20 years of age who couldn’t find work four and a half years ago, and are still looking today. And there are yet others who were just starting college when the recession hit. We learned this month, that among recent college graduates, 53 percent find themselves either unemployed or underemployed. The dream is fading.

The Labor Force Participation Rate measures the Labor Force as a percentage of the Civilian Noninstitutional Population. According to the Bureau of Labor Statistics, Table A-1, the labor force participation rate for 16 to 19 year olds averaged 54.5% in 1976, when I was 16 years old (see chart above). It stood at 41.5% prior to the recession, but had declined to 38.5% by the time Barack Obama was sworn in. It has since continued in decline to an all time low of 34.2% as of May 31, 2012. So when I was 16, a young person had about a 50/50 shot at finding a job, but for today’s youth the chances are more like 30 out of 100.

The American Dream appears to be fading into the sunset, but according to Barack Obama, the private sector is doing fine. Apparently the economy is doing well enough in his eyes that last Friday was a prefect time for him to singlehandedly grant amnesty to the children of those who have crossed our borders illegally. Oh, give me a break! How does Obama get away with it? He gets away with it because Democrats let him. You all better wake up. You’re either part of the solution, or part of the problem. If you’re so stuck on a political ideology or party brand, that you can’t see the light of day, then God help you. God help us all. If you’re still on the fence, then what are you waiting for? It’s time for a plan that works, not four more years of lecturing, finger pointing and Constitutional violations.

The bottom line: After three and a half years of Barack Obama, we find ourselves 5,481,000 jobs in the hole. At this point we must not only make up this shortfall, but must do so while creating an additional 300,000 jobs per month. In other words, if we apply Paul Krugman’s reasonable benchmark, we have 31 months remaining to create 14,781,000 jobs (9,300,000 + 5,481,000). That means we need to seriously up the pace from last month’s anemic 69,000 jobs to 476,806 jobs per month. But that’s not going to happen until Barack Obama is sent back to Chicago.

Continued from…

Obama Jobs Scorecard, Part 2 : Beyond the Private Sector

Obama Jobs Scorecard, Part 1 : The Private Sector

Data:

Spreadsheets