Obama’s Bank Failures | Too Busy To Care

Through April 23, 2010, there have been 57 bank failures. That’s 57 in 113 days, or a failure rate of 50.4%. In 2009 there were 140 bank failures at a failure rate of 38.4%. So it’s been more than a year since the problem was ‘solved’, and the rate of bank failures has actually increased. In contrast, there were only 25 bank failures in 2008, 3 in 2007, none in 2005 or 2006, and only 22 from 2001 through 2004.

Wow, seven banks in his own back yard. We’ll see if he cares now, or whether he maintains the ‘quo’. Perhaps another round of golf is the cure!

Obama says he wants “…to get a better idea of what our options are…”. Well, here you go: (1) Crash and Burn, (2) Drastically Cut Government Borrowing and Spending, or (3) Burn and Crash. It’s not rocket science. Make an executive decision.

Reference:

FDIC Failed Bank List

Obama’s Bank Failures | Too Little to Save

By: Larry Walker, Jr.

After decades of failed government policies, from James Earl Carter, Jr. (Jimmy), to Barack Hussein Obama, II (Barry), it appears that policy makers haven’t learned a thing. After pouring billions of taxpayer dollars down the drain to fix the credit crisis, over a year has passed, and the problem isn’t fixed. While Obama and his minions now focus on controlling the Big financial institutions, the little guys, like the ones in your community are failing at the rate of one every other day.

And what is Obama’s solution to the destruction of capital occurring in our communities?

  1. To Add more than $10 trillion to the National Debt over the next 10 years, thus hogging up capital badly needed by community banks, and leading to higher interest rates.

  2. To tell citizens that they should be grateful, to him, that they got a $400 annual tax credit, paid for by higher taxes, and to just be quiet. – ‘Don’t patronize me.’

  3. To dole out $8,000, and $6,500 refundable home buyer tax credits, not realizing that it’s actually very difficult to get a home loan from failing banks. Not to mention impossible for the 10-20% of the workforce who are unemployed.

  4. To extend unemployment benefits, which doesn’t lead to job creation.

  5. To sit back, give an occasional pep rally to his constituency, make deals with America’s enemies, and alienate fellow Americans who have the solution.

In other words, he doesn’t have a solution. The only solution that a problem can have is to eliminate itself. Obama and his big government, ‘welfare state’ philosophy is the current problem. The only solution is to eliminate the problem. Everyday that Obama borrows and spends, borrows and spends, borrows and spends, pushes us that much farther from a solution, and thrusts us deeper and deeper into the problem.

Through April 16, 2010, there have been 50 bank failures. That’s 50 in 106 days, or a failure rate of 47.2%. In 2009 there were 140 bank failures at a failure rate of 38.4%. So it’s been more than a year since the problem was ‘solved’, and the rate of bank failures has actually increased. In contrast, there were only 25 bank failures in 2008, 3 in 2007, none in 2005 or 2006, and only 22 from 2001 through 2004.

click to enlarge
Failed Bank List - Click to Enlarge

References: FDIC Failed Bank List

Final: Obamacare | The Macro View

The Endgame

Catch 22 –

By: Larry Walker, Jr. –

Point #1 – As I pointed out previously here, and as you can see in the top portion of the table below, Mr. Obama has outlined a budget which contains deficit spending of $-3.7 trillion more than the CBO’s Baseline Budget, between the years 2011 and 2020. The CBO’s Baseline Budget was already $-5.9 trillion in the red for the budget years 2011 through 2020. If you start with fiscal year 2010, the CBO’s Baseline Budget deficit was already $-7.3 trillion. The CBO’s estimate of the President’s budget calls for total deficit spending of $-11.2 trillion beginning with fiscal year 2010 and ending in fiscal year 2020. (Note: The baseline budget total is for 2011-2020, so you have to add 2010 to get this figure.) Now if you add the President’s budget deficit of $-11.2 trillion to our National Debt which was $-12.1 trillion at the end of 2009, then the national debt will reach $-23.3 trillion by the year 2020.

Table 1 - Click to Enlarge

Point #2 – You will note in the bottom half of the table above (re-posted below), that the National Debt, which was $-12.11 trillion at the end of 2009, is projected to grow to $-22.12 trillion by the year 2019. (Note: The totals on this table end with fiscal year 2019 to correspond with the scoring of Obamacare.) This represents a percentage increase of 82.6% over the 10 year period. So before Obamacare, the President was already on target to increase our National Debt by 82.6% over the present decade.

Point #3 – Also in the table below, you will note that after implementing Obamacare, if one adds in the savings projected by the CBO of $119 billion over the first decade, then the National Debt is projected to grow to just $-22.00 trillion, or a percentage increase of 81.6% over the decade. This means that Obamacare will decrease the rate of growth of the national debt by just 1.0% in the first decade (82.6% vs 81.6%). In other words, by the year 2019, the National Debt will either be $-22.00 trillion with Obamacare, or $-22.12 trillion without it. (Note: I omitted the other $19 billion of savings which the CBO projected because I do not believe it to be attributable to Obamacare, however this is diminimus.)

Table 2 - Click to Enlarge

Point #4 – You will note that the CBO projects the savings from Obamacare to be $102 billion over the first five years, and only $17 billion over the second five, for a total of $119 billion in the first decade. The greatest savings appear in the years 2013 and 2014, $50 billion and $47 billion respectively. Why would anyone believe that there would suddenly be savings of over $1 trillion in the second decade, when the rate of savings decreases so dramatically in just the second five year period? If you study the numbers closely, the rate of savings from Obamacare declines by 83% from the first five years to the second. Yet, we are expected to believe that the rate of savings will suddenly jump by 740% (to over $1 trillion) during the second decade. This is simply unrealistic. Not to mention, unreliable, because the CBO calculated the savings rate in the second decade as a percentage of GDP. What we don’t have from the CBO is a projection of the Federal Budget that far out. If budget deficits continue to soar during the second decade after Obamacare, then any savings projected will be nullified.

Point # 5 – With government spending so out of control – with the national debt projected to grow to either $-22.12 trillion without, or $-22.00 trillion with Obamacare by 2019 – with the national debt projected to grow by either 82.6% without Obamacare, or 81.6% with it – it’s as if Obama and his Progressive colleagues have chosen to stick their heads in the sand, and to ignore the problem. The problem being the inability to pay for current federal programs. They are giddy and claiming victory because they think they have finally come up with a deficit neutral program, but what have they really done?

What have they done? – The term ‘deficit neutral’ implies that a program is implemented in a way that will not add to the deficit. But what does it mean for us as relates to Obamacare? What does it mean when government spending is already out of control? It means that the government will raise around $500 billion in new taxes, fees and fines in order to pay for a new entitlement program, Obamacare. It’s one thing to raise revenues in order to begin to balance the existing budget, but entirely another to ignore the debt, and to take more money out of our pockets for a new program. Meanwhile, the National Debt continues to grow at essentially the same rate.

Obamacare solves nothing. By the year 2020, the national debt will be nearly twice the amount of our current GDP. If we don’t take the debt crisis seriously, then by the year 2020 there will be no Obamacare, no Social Security, no Medicare, no Education, no Defense, and possibly not even a United States of America. Obamacare and its sister entitlement programs are not the solution to our problems, Obamacare and its sister entitlement programs are the problem.

Sources:
http://www.treasurydirect.gov/NP/NPGateway
http://www.cbo.gov/ftpdocs/113xx/doc11355/hr4872.pdf
http://www.cbo.gov/ftpdocs/112xx/doc11231/budgetprojections.xls
Obamacare: A Fiscal Point of View Updated!

Revised: Obamacare | The Macro View

Catch 22 –

By: Larry Walker, Jr. –

Point #1 – As I pointed out previously here, and as you can see in the top portion of the table below, Mr. Obama has outlined a budget which contains deficit spending of $-3.7 trillion more than the CBO’s Baseline Budget, between the years 2011 and 2020. The CBO’s Baseline Budget was already $-5.9 trillion in the red for the budget years 2011 through 2020. If you start with fiscal year 2010, the CBO’s Baseline Budget deficit was already $-7.3 trillion. The CBO’s estimate of the President’s budget calls for total deficit spending of $-11.2 trillion beginning with fiscal year 2010 and ending in fiscal year 2020. (Note: The baseline budget total is for 2011-2020, so you have to add 2010 to get this figure.) Now if you add the President’s budget deficit of $-11.2 trillion to our National Debt which was $-12.1 trillion at the end of 2009, then the national debt will reach $-23.3 trillion by the year 2020.

Table 1 - Click to Enlarge

Point #2 – You will note in the bottom half of the table above (re-posted below), that the National Debt, which was $-12.11 trillion at the end of 2009, is projected to grow to $-22.12 trillion by the year 2019. (Note: The totals on this table end with fiscal year 2019 to correspond with the scoring of Obamacare.) This represents a percentage increase of 82.6% over the 10 year period. So before Obamacare, the President was already on target to increase our National Debt by 82.6% over the present decade.

Point #3 – Also in the table below, you will note that after implementing Obamacare, if one adds in the savings projected by the CBO of $119 billion over the first decade, then the National Debt is projected to grow to just $-22.00 trillion, or a percentage increase of 81.6% over the decade. This means that Obamacare will decrease the rate of growth of the national debt by just 1.0% in the first decade (82.6% vs 81.6%). In other words, by the year 2019, the National Debt will either be $-22.00 trillion with Obamacare, or $-22.12 trillion without it. (Note: I omitted the other $19 billion of savings which the CBO projected because I do not believe it to be attributable to Obamacare, however this is diminimus.)

Table 2 - Click to Enlarge

Point #4 – You will note that the CBO projects the savings from Obamacare to be $102 billion over the first five years, and only $17 billion over the second five, for a total of $119 billion in the first decade. The greatest savings appear in the years 2013 and 2014, $50 billion and $47 billion respectively. Why would anyone believe that there would suddenly be savings of over $1 trillion in the second decade, when the rate of savings decreases so dramatically in just the second five year period? If you study the numbers closely, the rate of savings from Obamacare declines by 83% from the first five years to the second. Yet, we are expected to believe that the rate of savings will suddenly jump by 740% (to over $1 trillion) during the second decade. This is simply unrealistic. Not to mention, unreliable, because the CBO calculated the savings rate in the second decade as a percentage of GDP. What we don’t have from the CBO is a projection of the Federal Budget that far out. If budget deficits continue to soar during the second decade after Obamacare, then any savings projected will be nullified.

Point # 5 – With government spending so out of control – with the national debt projected to grow to either $-22.12 trillion without, or $-22.00 trillion with Obamacare by 2019 – with the national debt projected to grow by either 82.6% without Obamacare, or 81.6% with it – it’s as if Obama and his Progressive colleagues have chosen to stick their heads in the sand, and to ignore the problem. The problem being the inability to pay for current federal programs. They are giddy and claiming victory because they think they have finally come up with a deficit neutral program, but what have they really done?

What have they done? – The term ‘deficit neutral’ implies that a program is implemented in a way that will not add to the deficit. But what does it mean for us as relates to Obamacare? What does it mean when government spending is already out of control? It means that the government will raise around $500 billion in new taxes, fees and fines in order to pay for a new entitlement program, Obamacare. It’s one thing to raise revenues in order to begin to balance the existing budget, but entirely another to ignore the debt, and to take more money out of our pockets for a new program. Meanwhile, the National Debt continues to grow at essentially the same rate. Obamacare solves nothing. By the year 2020, the national debt will be nearly twice the amount of our current GDP. If we don’t take the debt crisis seriously, then by the year 2020 there will be no Obamacare, no Social Security, no Medicare, no Education, no Defense, and possibly not even a United States of America. Obamacare and its sister entitlement programs are not the solution to our problems, Obamacare and its sister entitlement programs are the problem.

Sources:

http://www.treasurydirect.gov/NP/NPGateway

http://www.cbo.gov/ftpdocs/113xx/doc11355/hr4872.pdf

http://www.cbo.gov/ftpdocs/112xx/doc11231/budgetprojections.xls

Obamacare: A Fiscal Point of View Updated!

Obamacare: A Fiscal Point of View | Updated!

Obamacare: A Fiscal Conservative’s Point of View

– By: Larry Walker Jr. –

Paying for Obamacare, which we can not afford, sounds like the same strategy used to grant people their other Government given right, the right to buy a home, even if they couldn’t afford one. With housing, the Government made lenders come up with scams like interest only loans, variable interest rate loans, and other devices to make a home affordable ‘today’, with hopes that things would work themselves out in the future. That plan caused millions of people to lose their homes and nearly bankrupted the entire global financial industry. That’s the danger. Now the facts.

Click to Enlarge

The table above reveals the Congressional Budget Office’s March 2009 Baseline Projections which were used around the time the Senate’s health care bill was scored. Nothing new here. The United States Federal Government has a problem with out of control spending. The National debt is out of control and at that time was projected to reach $18.7 trillion by the year 2019.

Click to Enlarge

The above table attempts to show you the effect of Obamacare on the National Debt. Since Obamacare is projected to save $82 billion through 2019, I have simply applied the CBO’s initial scoring of the Senate Bill on a straight-line basis (an equal amount for each year). I used straight-line because no one really knows how they come up with this stuff. So after Obamacare, we would save $82 billion over 10 years, right. Well, actually, since the Government was already projected to overspend by $8,824 billion ($8.8 trillion for the math weary) over the rest of the decade, this only represents a savings of 0.93%. And remember, that’s a savings of the amount of deficit spending, not a reduction to the National Debt. Deficit spending is deficit spending in my view.

Click to Enlarge

The final table (above) reveals the revised debt projections as published by the White House. As you can see, just through the year 2013, the Government is already projected to spend $1 trillion more than what was projected in March of 2009. So Obama will already spend $1 trillion more than he projected, and now he’s proposing to knock that down by a whopping $82 billion over 10 years, by destroying the health care industry. And we’re supposed to be happy?

Conclusion: The President is very sincere in his efforts to justify Obamacare as a means of fiscal responsibility. However, he fails to address the main problem – Out of Control Government Spending. Obama himself is projected to spend over $1 trillion more than he projected a year ago. The Federal Government will have a National Debt of $16.2 trillion by the year 2013. Although Obamacare may save 0.93% of Obama’s own, out of control, deficit spending (a percentage which is declining every second) over the next decade, it fails in that:

  1. It will not stop the deficit spending.
  2. It will not pay down the National Debt.
  3. It will not provide health coverage for all Americans.
  4. It will not reduce the cost of health insurance.

And then there’s the question of what’s going to happen after the first decade. Not even the CBO can legally answer that question. In my opinion, Obamacare is nothing but a token bill designed to stroke Obama’s ego. It will have virtually no effect from a fiscal standpoint, and could trigger many negative side effects. So I ask, what’s the point?

__________________________________________________________

Update 3/18/10

The top section of the following table is from the CBO’s March 2010 Baseline and CBO’s Estimate of the President’s Budget here. For the fiscal years 2011 through 2020, the President’s budget came out $3.777 trillion more in the red than CBO’s baseline, resulting in total deficit spending by Obama of $9.761 trillion between 2011 and 2020, or $11.2 trillion from 2010 through 2020.

I overlaid the lower section with the CBO’s stated effect of Obamacare on the deficit, from Table 1 (page 6) of their scoring report, which was released on 03/18/10 here.

Click to Enlarge

So it’s even worse than I stated yesterday. Obama will overshoot the baseline budget by $3.777 trillion, and will add $11.2 trillion to the National Debt between 2010 and 2020. And he thinks that by passing Obamacare and destroying the US Health Care Industry in the process, that it is worth it, in order to save $119 billion (or $138 or whatever) over the first 10 years. If you ask me $119 billion (or $138 or whatever) in savings looks pretty pathetic when Obama and Congress are already on course to increase the national debt by $11.2 trillion in reckless spending.

This makes Democrats giddy? The whole borrow and spend fest makes me mad as hell. And as far as the second decade goes, I don’t see any compelling evidence in the CBO report that would guarantee that the deficit would continue to fall. And even if the deficit would fall by $1 trillion in the second decade, this would only partially offset an additional $10 trillion (or more) of reckless deficit spending if Washington continues on it’s present disastrous path.

And by the way, the report doesn’t say that the deficit will fall by $1 trillion in the second decade. It does, however, mention that the savings generated by the education provisions would outweigh the costs related to the health care provisions. In otherwords, by fundamentally ‘destroying’ the education system, they can justify destroying the health care system, but this only works for ‘giddy’, power grabbing, debt laden, incumbent Democrats.

Sources:

http://www.cbo.gov/ftpdocs/112xx/doc11231/budgetprojections.xls

http://www.cbo.gov/ftpdocs/113xx/doc11355/hr4872.pdf

Cost Analysis Health Care Bill

http://www.whitehouse.gov/omb/budget/fy2011/assets/hist01z2.xls

Did GDP Fall by 2.4% in 2009?

More B.S. from D.C.

By: Larry Walker, Jr.

According to the Bureau of Economic Analysis (BEA’s) second release regarding – the 4th quarter 2009 GDP, issued earlier today, GDP increased at an annual rate of 5.9% in the 4th quarter of 2009. That is the rate of increase from the 3rd to the 4th quarter, expressed as an annualized percentage rate. The BEA also stated that, in the 3rd quarter, real GDP increased 2.2%. Sounds good, right? Woo-hoo!

“Real gross domestic product — the output of goods and services produced by labor and property located in the United States — increased at an annual rate of 5.9 percent in the fourth quarter of 2009 (that is, from the third quarter to the fourth quarter) according to the “second” estimate released by the Bureau of Economic Analysis. In the third quarter, real GDP increased 2.2 percent.”

But if you read down a little further into the report, the part where the BEA re-enters the atmosphere, you will discover that real GDP fell by (2.4%) in 2009. That is the rate of decline from the 2008 level to the 2009 level. So, is this good, or bad?

[2009 GDP] “Real GDP decreased 2.4 percent in 2009 (that is, from the 2008 annual level to the 2009 annual level), in contrast to an increase of 0.4 percent in 2008.”

Like I said in a previous post, it’s like telling me that my IRA account grew at an annual rate of 5.9% in the 4th quarter, but when I look at my statement I find that my account balance has actually declined by (2.4%) from 2008. So am I better off? No. Are you?

The next time Obama & Company start boasting about 4th quarter 2009 GDP, I wish someone would stand up and say, “but, sir, GDP actually fell by 2.4% under your watch”. Put that in your tea and drink it!

Click to Enlarge

Reference:

http://www.bea.gov/newsreleases/national/gdp/gdpnewsrelease.htm

Health Care Expenditures vs Income

Click to Enlarge

A Fiscal Conservative Opines: Where is all the excess?

By: Larry Walker, Jr.

I am once again attempting to overlay data upon data from different sources, not being certain whether any of them are accurate, yet they are all so called ‘reputable’. There are some who will look at the table, above, and think that health care expenditures are out of control. I look at it and my take is that the lack of growth in real incomes is the problem.

In fact, health care expenditures have been on the decline since 2003. Granted I was not able to find the rate of change for 2009, even if there was no increase, health care expenditures have grown faster than incomes, the consumer price index, and GDP. This doesn’t tell me that there is necessarily a problem with health care expenditures. What it tells me … is that there is a problem with the economy.

Over the past ten years, consumer prices have risen by 25% while incomes have only risen by 9%. Does this mean that prices are out of control? Not to me. To me it means that our incomes are not keeping pace with inflation.

GDP is growing slower than prices. GDP is only growing at an average of 1.9% per year. For the past decade, GDP grew by 19% while prices grew by 25%. So again, is the problem with prices, or with GDP?

Let’s be real. Unless prices rise, incomes will not. How can a business provide raises for employees every year unless the business is also raising its prices? One way would be to keep prices static and to increase productivity, which generally means doing more with less employees. Everyone expects to get a cost of living increase each year, however, in order to receive one, your employer must generally raise its prices in line with the consumer price index. Yet, if that was reality, then incomes would be rising as fast as inflation. Yet, prices have risen nearly three times as fast as incomes. So where is all the excess?

My suspicion is that the problem lies more in the area of manufacturing, international trade, unionization, and the growth of government. We don’t make things anymore in America, we have become a service economy. Most of the products that we buy are imported from other countries. Unions are constantly demanding higher wages and better benefits. The number of government employees is growing as is their pay and benefits. The end result is that our Federal and State governments are going broke, jobs are being lost to emerging market economies, and the incomes of non-governmental and non-union employees are going down.

So the question is how do we improve the growth prospects for our economy? The answer lies in finding ways to increase exports and decrease imports, to lower income taxes and reduce the size of government, and to remove the restraints currently being imposed upon the free market. Our economy doesn’t need more controls, but rather less.

You say rising health care costs are at the center of all of our problems. I say, you’re focusing on the wrong statistic. If a man or woman has no way to earn their livelihood, then what good is a government run health care program. You will have your health care, but you will live in poverty. You will be taxed, but you will lack the wherewithal to pay your taxes. The poor will remain poor. The middle class will cease to exist. The government will continue to spend more than it can tax until even it falls by the wayside.

You cannot fix a problem, until you have identified one. So where is all the excess?

If the price of say automobiles rises, yet most of the autos are purchased from Japan, then there’s your answer. Sure, some jobs were provided in America, but the excess (also known as profit) has left the country.

If the price of health insurance has risen, yet most of the insurance is purchased from domestic providers, then where is all the excess? The answer is in a broken governmental system. The government (federal and state) spends nearly twice as much on health care as does the private sector. The government gets its revenue by taxing those who are viable and paying for the health services of those who are not. The government pays less for services than does the private sector which in turn, means prices will rise for everyone to compensate for the shortfall created by government providers. Thus, prices rise, but incomes do not.

A major reason why incomes are not rising is because the cost of income taxes, social security taxes, and medicare taxes are set to rise every year. It’s not that the rates have necessarily changed, but that the income ceilings have. So you work hard to make more than the social security cap, but by the time you reach that goal, the government has raised the bar (or removed it completely). This is not a progressive tax system, it’s a progressive annual tax increase. It’s a system designed to keep our economy in chains.

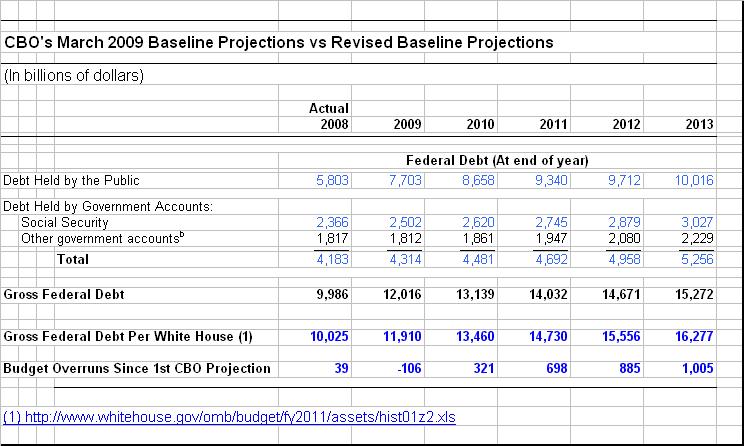
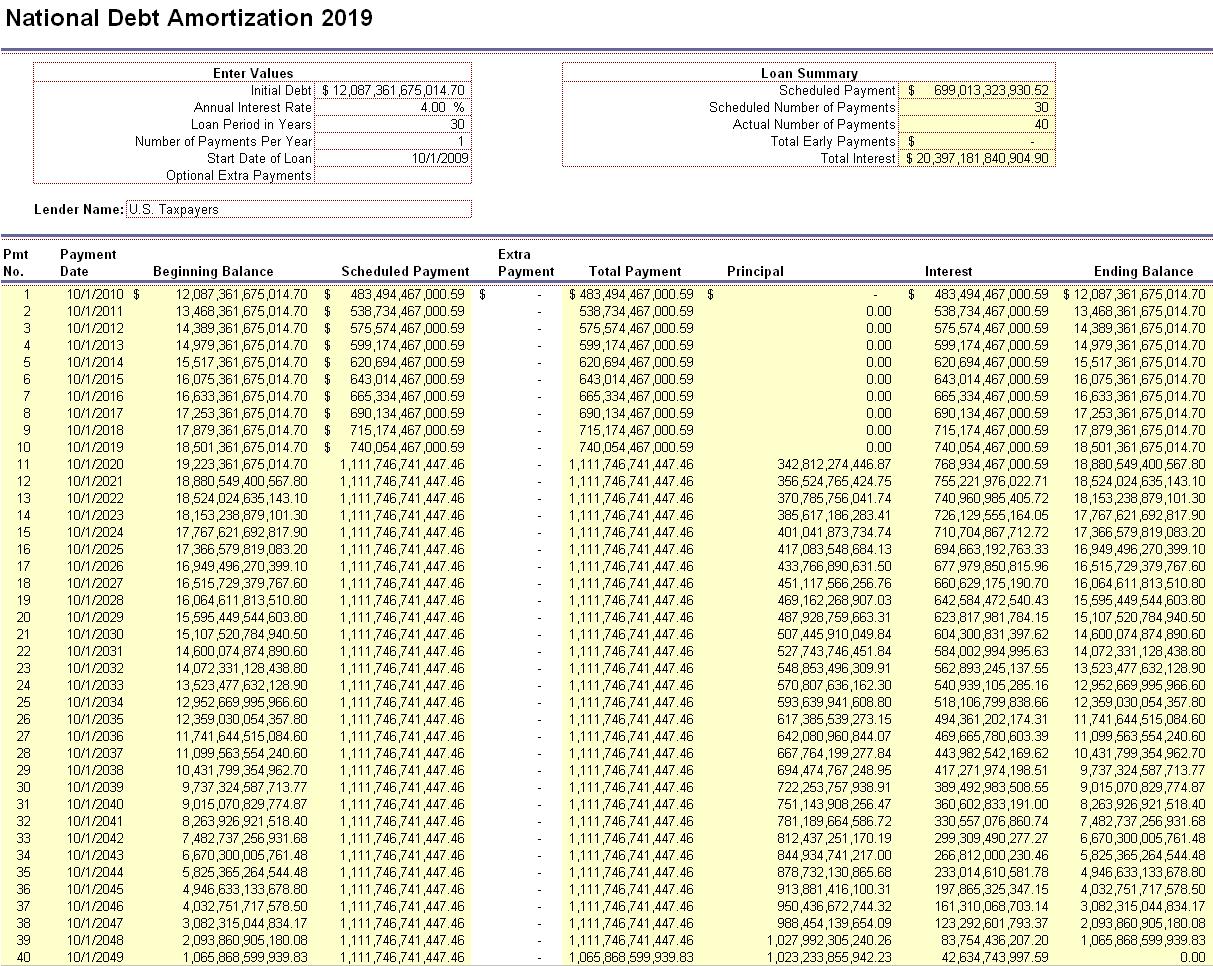
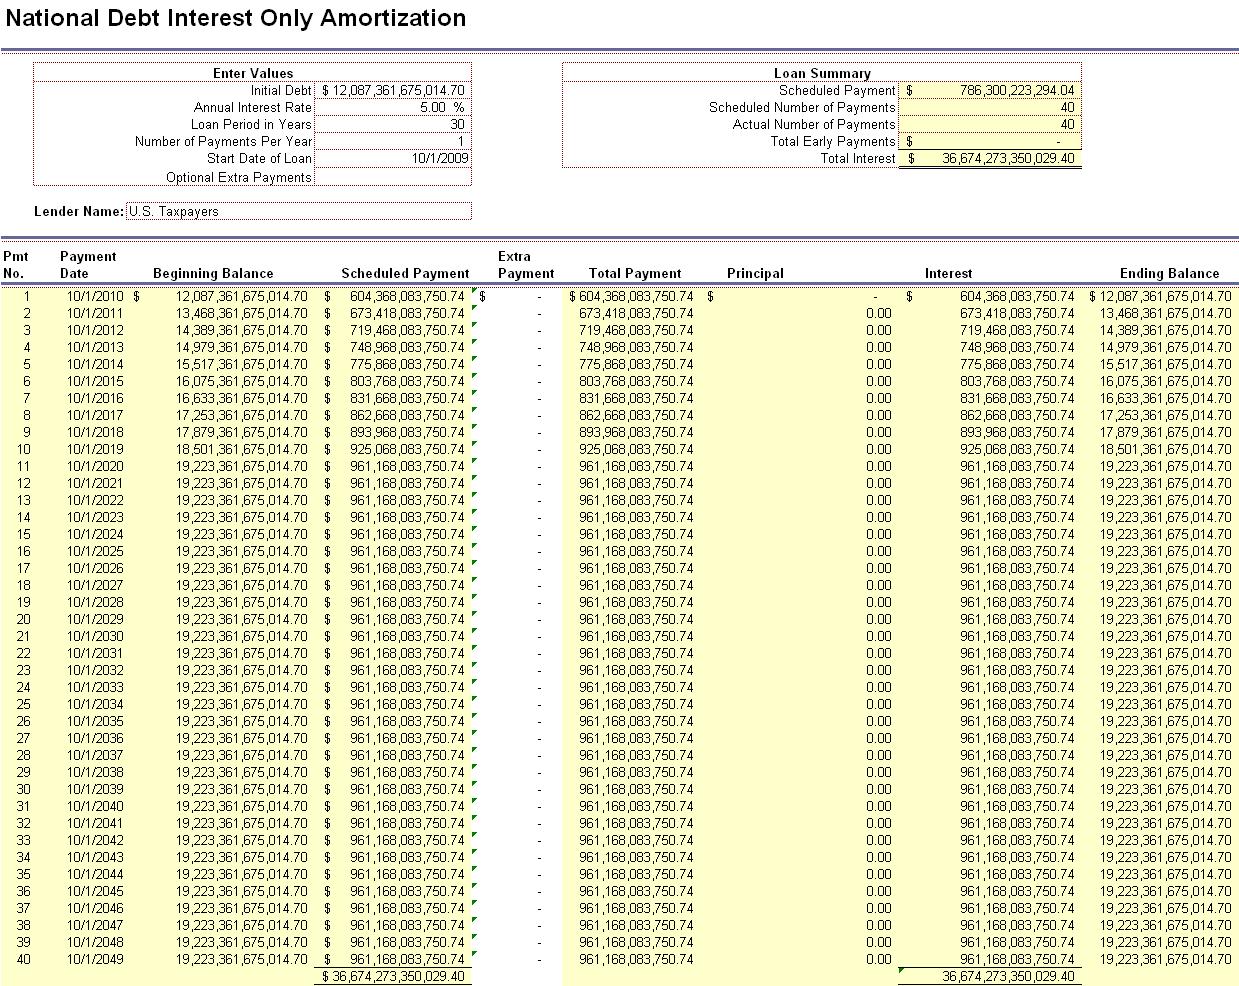
So where is all the excess? One need only look at our national debt. If there were excess, the United States Federal government would not be $13 trillion in debt. So there is no excess.

The problem lies not in price controls but rather in wealth creation. Wealth is not created through price controls. In fact, wealth is restrained by controlling prices. If prices did not rise, then neither would wealth. Yet, when wealth is not rising along with prices there is a breach.

If every American either worked for the government, or received government services, how would the government be able to continue as a going concern? The answer is that it would not. So then part of the solution, which is ingrained in your soul, is that bigger government is not the answer. On the other hand, if everyone worked in the private sector, and if everyone were able to sustain themselves, what would be the role of government? Most likely the role that was intended by our founders. So once again we can conclude that government is not the solution to our problems, government is the problem.

Message to uncle Sam, “get out of my way, and get off my back.”

End of rant….

References:

http://www.ers.usda.gov/Data/macroeconomics/Data/HistoricalRealPerCapitaIncomeValues.xls

http://stats.bls.gov/cpi/

http://www.cms.hhs.gov/NationalHealthExpendData/downloads/tables.pdf

http://www.bea.gov/national/txt/dpga.txt

Other Links and Solutions:

http://citizenownership.blogspot.com/2010/02/every-citizen-owner.html

http://citizenownership.blogspot.com/2010/02/expanded-capital-ownership-now.html

http://www.aipnews.com/talk/forums/thread-view.asp?tid=12453&posts=3#M33855

http://www.freerepublic.com/focus/f-bloggers/2460284/posts

National Debt Crisis – 2010

Obama’s Debt Crisis

How much is the National Debt costing America?

It’s interesting to note that the total interest paid on the National Debt since 1988 has been $7,393 billion (that’s $7.4 trillion). That’s a lot of money being wasted by politicians in Washington, D.C. and there are not enough people talking about it. There is an even more deafening silence regarding what the cost will be over the next 10 years. The United States will pay almost as much interest as it did over the last 20 years in just the next 10. And no one in Washington is addressing the Debt Crisis. I would to God that somebody would wake them up before it’s too late.

click to enlarge

Source: Treasury Direct

Plan A – Pay the Debt Now

The National Debt is currently $12,087 billion (that’s $12 trillion). If principal and interest payments were made over the next 30 years at 4.0% interest, the total remaining interest cost would be $8,883 billion (that’s $8.9 trillion). The total annual P&I payment would be $699 billion or roughly 31% of current government revenues (click on the chart below). But since it’s not likely that this plan will ever see the light of day, what is Plan B?

PLAN A - click to enlarge

Plan B – Ignore the Debt until 2019

The National Debt is projected to grow to $19,224 billion (that’s $19 trillion) by the year 2019. This is calculated by adding the CBO’s projected budget deficit of $7,137 billion to our current debt. If the debt is not addressed until 2019, the cost of interest over the next 10 years would be $6,271 billion, since no principal payments will have been made (see chart below). Then, assuming that a plan is put in place to pay the debt off over the ensuing 30 year period, ending in fiscal year 2050, the total cost of interest over the next 40 years will be $20,397 billion (that’s $20.4 trillion). If the government starts making payments after 2019, the annual P&I payment would be around $1.1 trillion or 49% of current government revenues.

PLAN B - click to enlarge

Obama’s Debt Crisis

If we address the National Debt now it will cost roughly $8.9 trillion in interest. If we wait until 2019 it will cost closer to $20.4 trillion in interest. If we never address our debt and continue to treat it as an interest only loan, then this number will “skyrocket”. In fact we may already be at the point of no return.

This is Barack Obama’s failure. Obama talks the talk but he doesn’t walk the walk. Obama will cost America $6.3 trillion in interest over the next 10 years by his failure to address the national debt. Add that to his $7.1 trillion (and rising) budget deficit and Obama will have cost America at least $13.4 trillion. So any success that Obama touts short of $13.4 trillion in savings, revenue or benefits is a joke.

The Consequences

What consequences could American’s face if the debt is not dealt with? Well, for one interest rates are currently at an all time low, and there is only one direction they can go, up. When interest rates begin to rise, so will the cost of the debt. As shown here, if interest rates rise to 5.0% and the debt is not brought down by fiscal year 2050, then the total interest cost jumps from $20.4 trillion to $36.8 trillion. That’s about the equivalent of three times annual GDP wasted on interest payments.

Also, the United States could lose its AAA-credit rating. Once AAA status is gone it will be tougher for the nation to borrow money and lenders will charge higher interest rates. Lenders may also begin to impose stringent standards on our nation’s fiscal policies. Don’t forget that a lot of this borrowed money comes from foreign countries. In other words, if we don’t deal with the debt now it will only cost more in the future and we could potentially lose some of our freedom in the process.

Is Congress Brain Dead?

When Congress talks about saving the country a couple of hundred billion over 30 years, by passing a health care entitlement bill, I can’t help but wonder if anyone is awake at the helm. Congress is on the path of costing the country roughly $6.3 trillion in interest over the next 10 years, plus another $14.1 trillion over following 30 years, and these are probably low-ball figures, and what are they up to? Telling us how they will save a few pennies by adding a few trillion more to the National Debt. Yet, if Congress fails to address the Debt by 2019, the interest costs will soar well beyond the $20 trillion mark.

Those who truly love this country could care less about the Congress saving $200 billion on a new entitlement program. I could especially care less since I know that it will cost 5 times as much to implement and more down the road. Don’t talk to me about Health Care reform while your back is turned on the more pressing $20 trillion problem. Will somebody please wake up the Congress, the Media, and the Borrower in Chief? Wake them up before it’s too late.

Note: This posting is based on the following assumptions: (1) that interest rates are fixed at 4.0%, and (2) that the debt is repaid over a 30 year term.

References/Related:

GAO Financial Audit of Public Debt 2007-2008

CBO Budget Projections through 2019

U.S. Treasury Direct

The Real November Job Loss Number Was 255,000

Joe Weisenthal Dec. 4, 2009, 2:56 PM

Source: BusinessInsider.com

Just about every time the monthly jobs numbers comes out, economic research firm TrimTabs comes out and slams the government’s methodology, usually honing in on the Birth/Death model of new businesses entering the market.

This week is no exception.

Frankly, we’re not sure what to make of their arguments. We’ve been hearing about this Birth-Death issue for a long time, but unless you believe they’re changing their methodology from month to month, then that issue only goes so far.

We welcome your thoughts.

————

TrimTabs’ Estimates 255,000 Jobs Lost in November, While BLS Reports a Decline of Only 11,000

BLS Revises September and October Results Down a Whopping 45%

Something’s Not Right in Kansas!

TrimTabs employment analysis, which uses real-time daily income tax deposits from all U.S. taxpayers to compute employment growth, estimated that the U.S. economy shed 255,000 jobs in November. This past month’s results were an improvement of only 10.2% from the 284,000 jobs lost in October.

Meanwhile, the Bureau of Labor Statistics (BLS) reported that the U.S. economy lost an astonishingly better than expected 11,000 jobs in November. In addition, the BLS revised their September and October results down a whopping 203,000 jobs, resulting in a 45% improvement over their preliminary results.

Something is not right in Kansas! Either the BLS results are wrong, our results are in error, or the truth lies somewhere in the middle.

We believe the BLS is grossly underestimating current job losses due to their flawed survey methodology. Those flaws include rigid seasonal adjustments, a mysterious birth/death adjustment, and the fact that only 40% to 60% of the BLS survey is complete by the time of the first release and subject to revision.

Seasonal adjustments are particularly problematic around the holiday season due to the large number of temporary holiday-related jobs added to payrolls in October and November which then disappear in January. In the past two months, the BLS seasonal adjustments subtracted 2.4 million jobs from the results. In January, when the seasonal adjustments are the largest of the year, the BLS will add anywhere from 2.0 to 2.3 million jobs. In our opinion, trying to glean monthly job losses numbering in the tens of thousands or even in the hundreds of thousands are lost in the enormous size of the seasonal adjustments.

In November, the BLS revised their September and October job losses down a surprising 44.5%, or 203,000 jobs. In the twelve months ending in October, the BLS revised their job loss estimates up or down by a staggering 679,000 jobs, or 13.0%. Until this past month, these revisions brought the BLS’ revised estimates to within a couple percent of TrimTabs’ original estimates.

The large divergence between the two results begs the question of what is causing the difference. While we don’t have an answer today, we will be poring over the data in an attempt to answer that question.

A comparison of TrimTabs’ employment results versus the BLS’ results from January 2008 through November 2009 is summarized below.

click to enlarge

Source: TrimTabs Investment Researchhttp://www.trimtabs.com/ and Bureau of Labor Statistics – http://www.bls.com/

Several other employment related data statistics support the conclusion that the labor market is not as robust as the BLS is reporting:

  • Automatic Data Processing reported on Wednesday that 169,000 jobs were lost in November.
  • The Institute of Supply Management (ISM) Non-Manufacturing Survey reported that the majority of companies surveyed were still shedding employees.
  • The ISM Manufacturing Survey reported weaker employment conditions in November.
  • Weekly unemployment claims were 457,000 in the week ended November 27, 2009. While last week’s results were below the important psychological level 500,000, the weekly claims are still uncomfortably high and point to a contracting labor market.
  • The TrimTabs Online Jobs Index reported lower online job availability in the past three weeks.
  • The Monster Employment Index declined in November.

We will have the opportunity to truth our employment model estimates at the end of January 2010 when the BLS releases its annual benchmark revisions. The BLS revisions are based on actual payroll data for March 2009. The BLS revision is then divided by twelve to correct prior month’s data back to April 2008. We also use the March 2009 revisions to adjust our model inputs and make any necessary corrections.

For a complete analysis of the current employment situation and economic conditions, refer to TrimTabs Weekly Macro Analysis published this coming Tuesday, December 8, 2009

Paying The National Debt For Dummies 2.0

Ignoring The Problem?

[updated below]

The Cost of Paying the Debt Now

By starting today, the Federal Government can pay off the National Debt in 30 years by making interest and principal payments of $699,013,323,930.52 per year (see the chart below). In Fiscal Year 2009 the government made interest payments of $383,656,592,545.78. So it would take an additional $315,356,731,384.74 in annual payments to completely extinguish the debt in 30 years. By starting now, the total cost of interest will be $8,883,038,042,900.88 (8.883 trillion), at 4%, over 30 years.

Amortization Schedule - click to enlarge

Opportunity Cost: Waiting until 2019 [updated]

If the Federal Government chooses to wait until 2019 before addressing the debt, the cost rises dramatically. If we choose to wait, our annual principal and interest payments will rise to $1,111,746,741,447.46 per year (see chart below), an increase of $412,733,417,516.94 in annual P&I payments. The total interest on the debt will rise to $20.4 trillion which is computed by adding the $14,128 billion at 4%, over 30 years plus the $6,271 billion in 4% interest only payments, over the first 10 years (shown here). Thus, the cost of waiting is an additional $11.514 trillion ($20,397 billion minus $8,883 billion) in interest.

Amortization Schedule 2.0 - click to enlarge

So What Are You Waiting For?

Are you wondering what will happen when interest rates rise? If politicians were serious about fiscal responsibility, surely they would find a way to cut government spending. All of Washington, DC is guilty. The longer you ignore a problem, the greater it becomes. America needs to stop the deficit spending ‘now’. Politicians need to start paying off the debt, and to put an end to annual budget deficits. Politicians need to stop making excuses, and quit playing political games.

References:

http://www.treasurydirect.gov/govt/reports/ir/ir_expense.htm