Catch 22 –
By: Larry Walker, Jr. –
Point #1 – As I pointed out previously here, and as you can see in the top portion of the table below, Mr. Obama has outlined a budget which contains deficit spending of $-3.7 trillion more than the CBO’s Baseline Budget, between the years 2011 and 2020. The CBO’s Baseline Budget was already $-5.9 trillion in the red for the budget years 2011 through 2020. If you start with fiscal year 2010, the CBO’s Baseline Budget deficit was already $-7.3 trillion. The CBO’s estimate of the President’s budget calls for total deficit spending of $-11.2 trillion beginning with fiscal year 2010 and ending in fiscal year 2020. (Note: The baseline budget total is for 2011-2020, so you have to add 2010 to get this figure.) Now if you add the President’s budget deficit of $-11.2 trillion to our National Debt which was $-12.1 trillion at the end of 2009, then the national debt will reach $-23.3 trillion by the year 2020.
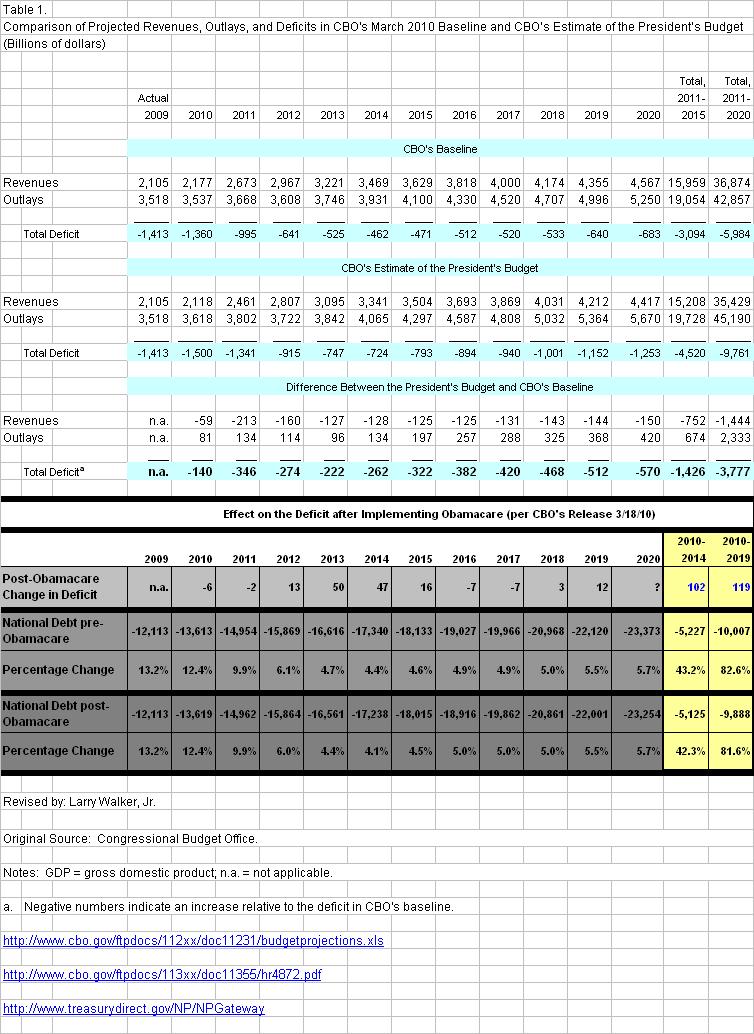
Point #2 – You will note in the bottom half of the table above (re-posted below), that the National Debt, which was $-12.11 trillion at the end of 2009, is projected to grow to $-22.12 trillion by the year 2019. (Note: The totals on this table end with fiscal year 2019 to correspond with the scoring of Obamacare.) This represents a percentage increase of 82.6% over the 10 year period. So before Obamacare, the President was already on target to increase our National Debt by 82.6% over the present decade.
Point #3 – Also in the table below, you will note that after implementing Obamacare, if one adds in the savings projected by the CBO of $119 billion over the first decade, then the National Debt is projected to grow to just $-22.00 trillion, or a percentage increase of 81.6% over the decade. This means that Obamacare will decrease the rate of growth of the national debt by just 1.0% in the first decade (82.6% vs 81.6%). In other words, by the year 2019, the National Debt will either be $-22.00 trillion with Obamacare, or $-22.12 trillion without it. (Note: I omitted the other $19 billion of savings which the CBO projected because I do not believe it to be attributable to Obamacare, however this is diminimus.)
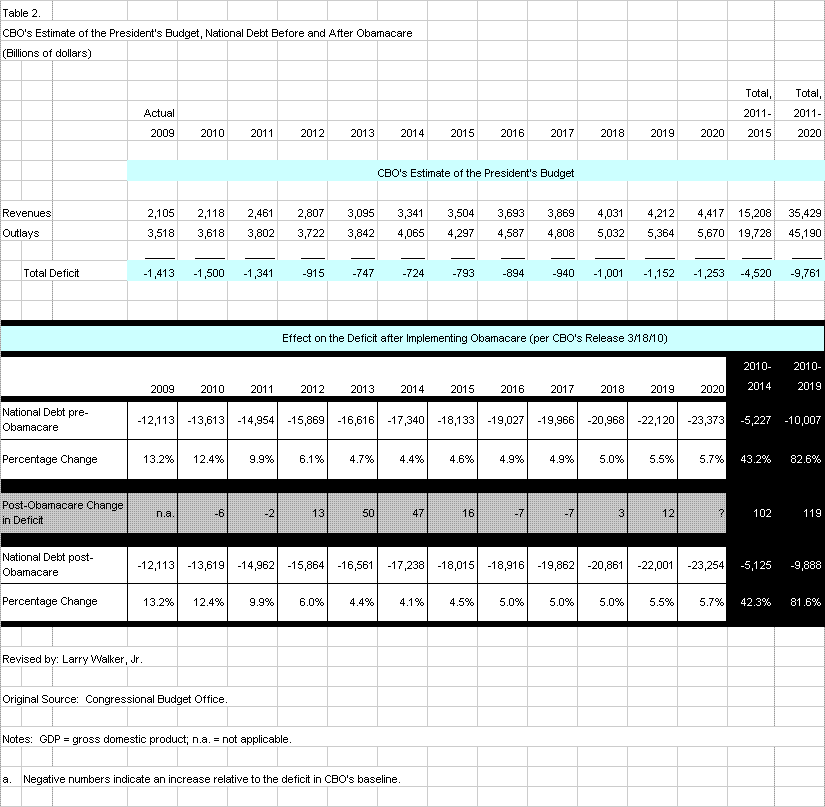
Point #4 – You will note that the CBO projects the savings from Obamacare to be $102 billion over the first five years, and only $17 billion over the second five, for a total of $119 billion in the first decade. The greatest savings appear in the years 2013 and 2014, $50 billion and $47 billion respectively. Why would anyone believe that there would suddenly be savings of over $1 trillion in the second decade, when the rate of savings decreases so dramatically in just the second five year period? If you study the numbers closely, the rate of savings from Obamacare declines by 83% from the first five years to the second. Yet, we are expected to believe that the rate of savings will suddenly jump by 740% (to over $1 trillion) during the second decade. This is simply unrealistic. Not to mention, unreliable, because the CBO calculated the savings rate in the second decade as a percentage of GDP. What we don’t have from the CBO is a projection of the Federal Budget that far out. If budget deficits continue to soar during the second decade after Obamacare, then any savings projected will be nullified.
Point # 5 – With government spending so out of control – with the national debt projected to grow to either $-22.12 trillion without, or $-22.00 trillion with Obamacare by 2019 – with the national debt projected to grow by either 82.6% without Obamacare, or 81.6% with it – it’s as if Obama and his Progressive colleagues have chosen to stick their heads in the sand, and to ignore the problem. The problem being the inability to pay for current federal programs. They are giddy and claiming victory because they think they have finally come up with a deficit neutral program, but what have they really done?
What have they done? – The term ‘deficit neutral’ implies that a program is implemented in a way that will not add to the deficit. But what does it mean for us as relates to Obamacare? What does it mean when government spending is already out of control? It means that the government will raise around $500 billion in new taxes, fees and fines in order to pay for a new entitlement program, Obamacare. It’s one thing to raise revenues in order to begin to balance the existing budget, but entirely another to ignore the debt, and to take more money out of our pockets for a new program. Meanwhile, the National Debt continues to grow at essentially the same rate. Obamacare solves nothing. By the year 2020, the national debt will be nearly twice the amount of our current GDP. If we don’t take the debt crisis seriously, then by the year 2020 there will be no Obamacare, no Social Security, no Medicare, no Education, no Defense, and possibly not even a United States of America. Obamacare and its sister entitlement programs are not the solution to our problems, Obamacare and its sister entitlement programs are the problem.
Sources:
http://www.treasurydirect.gov/NP/NPGateway
http://www.cbo.gov/ftpdocs/113xx/doc11355/hr4872.pdf
http://www.cbo.gov/ftpdocs/112xx/doc11231/budgetprojections.xls

I made a few corrections. I went back through this after being disgusted in listening to everyone in Congress spouting erroneous numbers. I wish someone would put up a chart and explain this stuff. However, it is a bit complicated to convey in an intelligible manner.
LikeLike