War on Wealth | Obama Visits Master Lock

:: By: Larry Walker, Jr. ::

Mr. Obama visited the padlock maker Master Lock in Milwaukee, Wisconsin on Wednesday, but wasn’t joined by Republican Gov. Scott Walker, who greeted the president upon arrival, but canceled his escort duties. Hey, so he was already sick to his stomach, and hanging out with Obama would have surely made matters worse.

During the event, after taking full credit for the whopping 100 jobs that Master Lock has brought back to Wisconsin from China, one of Obama’s many fabrications for the day, he added, “For the first time since 1990, American manufacturers are creating new jobs.”

However, according to the Bureau of Labor Statistics (BLS), there were 17,881,000 manufacturing jobs in the United States at the beginning of 1990, and only 17,395,000 by the end of that year (as seasonally adjusted). And by the end of the year 2000, the number had declined to 17,178,000 (shown graphically above).

Following the decline through to the end of the year 2008, the number of manufacturing jobs had fallen all the way to 12,849,000. In fact, by January of 2012, the latest statistics available prior to Obama’s speech, the BLS reported that the number of manufacturing jobs had fallen to just 11,862,000, which is almost one million fewer than when Obama first implemented his vision for America. So Obama is still delusional. What else is new?

Obama then continued with his own brand of manufacturing; the truth that is. He said, “It’s time to stop rewarding companies that ship jobs overseas and start rewarding companies that are creating jobs right here in the United States of America.”

So was it a reward that caused Master Lock to bring an entire 100 jobs back from China to Wisconsin? Did the company’s actions have anything remotely to do with Obama’s tax and regulatory policies? Obviously not, since Obama has yet to do anything to encourage such behavior. What has he done other than threaten companies with higher income taxes, Obamacare taxes, and more regulations? Not much to speak of, other than bailing out big banks and the GSE’s, and subsidizing the auto industry and the soon to be bankrupt Green Energy sector.

He rambled on, “Manufacturing is coming back. Companies are starting to bring jobs back. The economy is getting stronger. The recovery is speeding up. We’re moving in the right direction. And now we have to do everything in our power to keep our foot on the gas… And the last thing we can afford to do is go back to the same policies that got us into this mess.” YeeHa!

Man, that’s a lot of hoopla over 100 jobs. Studying the chart above, and considering Obama’s pedal to the metal analogy, if manufacturing is coming back, and if this alleged comeback is attributable to his Administration, then it looks like the government just needs to borrow and spend another $10 trillion (or so) and that should be enough get us back to where we left off in 1989. Keep on dreaming Mr. Obama!

Now as far as the policies that got us into this “mess”, I’m not sure which mess he’s referring to. Does he mean the mess we’re in now (i.e. $16 trillion in debt), or the mess that got us into the mess, that got us into the mess we’re in now? Does he mean that the policies of the relatively high tax era were bad, or the two relatively low tax eras which surrounded it? Or does he mean that the free-trade policies implemented in the 1990’s are the problem? I don’t think Obama even knows what he means. Not that anyone really cares what he says anymore.

Most of us are more focused on the $5 trillion the government has borrowed over the last three years, in this massive effort to get us virtually nowhere. What about that Mr. Obama? I think Congress should appoint an independent auditor to determine exactly where all that money went. I mean Obama has squandered a heck of a lot of money, and we have next to nothing to show for it.

Who knew? Maybe our future lies in padlocks. I suppose we’re going to need lots of locks just to keep our stuff safe from this new breed of fair share politicos. And in the meantime, it wouldn’t hurt to place one of those gigantic Master Locks on the U.S. Treasury.

The Great, Obama Unemployment Rate Scam | LibertyWorks

The Great, Obama Unemployment Rate Scam *

February 9, 2012 | By BoomerJeff *

Political communication in America is largely an effort to influence the perceptions of those who pay little attention to politics by stripping complex concepts and issues down to easily understood statistics and simplistic soundbites. In each of his first 33 months in office President Obama suffered because the easily understood Unemployment Rate remained very high. But over the past four months it fell from 9% to 8.3% and Obama and his media supporters are making the most of it. They tell us the economy has improved so much it is no longer an election issue and the President is no longer at risk of losing.

But it turns out that the Unemployment Rate statistic is misleading. It turns out that another statistic, the “Labor Force Participation Rate” has also declined. [Continued below the chart]

  • The Labor Force is the sum of all persons who have jobs plus all who are officially classified as “unemployed.”

  • The unemployment rate is computed by dividing the number of unemployed by the the labor force.

  • The labor force participation rate is the percentage of all working age adults who are officially counted as “in the labor force.”

Today, there are millions of people who want jobs but don’t qualify as “unemployed” by meeting government criteria and are thus counted as “not in the labor force.” We know this to be true because, as the chart shows, the participation rate has steadily declined for three years. Excluding people from the labor force artificially lowers the unemployment rate.

The chart above shows that the decline in the unemployment rate coincides with a decline in the labor force participation rate. The next chart shows what would have happened to the unemployment rate if the labor force participation rate had not not changed since the beginning of 2009. [Continued below the chart]

The last chart below tracks labor force participation and unemployment during the Reagan Administration. The labor force grew by 9% or 15.5 million people during the Reagan years. Participation grew from 63.9% to 66.1%. This chart is the picture of successful economic policies that increased liberty and decreased taxes and government intervention in the economy. Millions of new people entered the labor force but after the severe Recession Reagan inherited the unemployment rate declined because employers were able to replace all the jobs lost in the recession and hire the millions of people who entered the labor force. Reagan’s unemployment rate was not artificially reduced by excluding millions from of the labor force calculation and he was rewarded with reelection to a second term by the largest Electoral College landslide in American history.

Via: LibertyWorks – The Great, Obama Unemployment Rate Scam

I concur!

Manipulation 201: Playing With Unemployment

*“Mene, Mene, Tekel u-Pharsin” ~ Book of Daniel, Ch. 5 *

* By: Larry Walker, Jr. *

The writing’s on the wall! The massive decline of new entrants to the civilian labor force, which is shown graphically in the chart above, directly impacts the unemployment rate, making the employment situation appear far better than it actually is. If the 9.3 million workers who have effectively dropped out of the labor force, since the end of 2008, were instead of being excluded, counted as unemployed, the real unemployment rate would be 13.0% instead of yesterday’s published rate of 8.3%. Even if only 55.0% of those who have been incontestably and wrongfully removed from the labor force were counted, which would be consistent with the eight-year average prior to Obama, the real unemployment rate would be 10.9%, not 8.3%. Never before in history has there been a more blatant manipulation of official labor statistics.

Those focusing all their attention on the number of jobs created in recent months are focusing on the wrong data. Lest we forget, the Bureau of Labor Statistics includes in its definition of the word employed “persons 16 years and over in the civilian non-institutional population who, during the reference week, did any work at all (at least 1 hour) as paid employees.” So for all we know, a huge portion of those 200K and some odd jobs, allegedly created last month, were people hired for one hour, paid with taxpayer subsidized grants or loans, and working to register democrat voters in an effort to guarantee another round of Obamanomics. You laugh!

While we do need to watch out for the above, we really need to focus on the number of persons who have been summarily deleted from the labor force over the past three years. According the Bureau of Labor Statistics, the civilian labor force declined by 802,000 over this period. And even worse, another 8,481,000 new entrants, the majority of whom would normally have entered the labor force, are unaccounted for. So where are they? The Great Recession officially ended in June of 2009, yet 9.3 million Americans have gone missing over the past three years and one month. Thus, the question is, are they really missing, or has someone manipulated the unemployment rate in an effort to improve Obama’s chances for re-election?

The dilemma posed by a declining labor force is that as the civilian non-institutional population continues to grow by approximately 1.0% each year, millions of potential workers are forced out of the market. In other words, if there are not enough jobs for the existing workforce, then there are no jobs at all for the approximately 2 million new entrants who come into the job market each year. The devastating result is that a smaller proportion of the populace is working today, to support a much larger cluster of retirees, the unemployed, and those who are otherwise unaccounted for.

As you can see in the table above, according to the Bureau of Labor Statistics (Table A-1, not seasonally adjusted), the labor force grew from 142,583,000 at the end of the year 2000, to 154,287,000 by the end of 2008, for an increase of 11,704,000 workers over the eight-year period immediately preceding Obama. As such, the labor force was expanding by an average of 1,463,000 new entrants per year, for the eight years prior to 2009.

But from the beginning of 2009 through the end of 2011, the labor force declined from 154,287,000 to 153,617,000. Thus, after three consecutive years of Obamanomics, the labor force declined by a total of 670,000, for an average loss of 223,333 workers per year. The table has been extended through January of 2012, and as you can see, the labor force continued to decline by another 132,000 in January of 2012, as the number of workers fell from 153,617,000 to 153,485,000. Thus, a total of 802,000 have left the labor force since the end of 2008.

So it may be said that Obamanomics has caused the labor force, which should be expanding each year by a multiple of the increase in civilian non-institutional population, to instead be slashed by a total of 802,000 workers in just 37 month’s. This would be bad enough in and of itself; however if we are to believe the Bureau of Labor Statistics, from a macro view, the real employment situation is far worse.

When Obama’s declining labor force is compared with the growth of the civilian non-institutional population, also shown in the table above, we can see that a total of 9.3 million Americans have effectively been removed from the labor force during the last three years and one month (add together the amounts highlighted in the lower right-hand corner). This is the difference between periodic changes in the civilian non-institutional population (the 3rd column from the left), minus periodic changes in the labor force (the 2nd column from the right). It represents the periodic increase in the civilian working age population, which has been unfortunately added to the ranks of those counted as not in the labor force. And as we pointed out previously, a total of 6.5 million workers were removed in the three year period ending with 2011.

To be specific:

  1. In 2009, the civilian non-institutional population grew by 2,013,000, yet the labor force declined by 145,000, resulting in an increase of 2,158,000 persons counted as not part of the labor force. In other words, 2.1 million workers went missing in action (MIA).

  2. In 2010, the civilian non-institutional population grew by 2,029,000, yet the labor force continued to decline by another 253,000, resulting in an additional 2,282,000 counted as not in the labor force. That’s another 2.3 million MIA’s.

  3. Then in 2011, the civilian non-institutional population again grew, this time by 1,788,000, yet the labor force declined by another 272,000, resulting in 2,060,000 more persons counted as not part of the labor force. This resulted in another 2.1 million MIA’s.

  4. To top things off, in the first month of 2012, the civilian non-institutional population grew by an additional 2,651,000, yet the labor force further declined by 132,000, resulting in an additional 2,783,000 persons counted as not part of the labor force. Although January data is, as always, affected by changes in population controls, nevertheless it is what it is. Thus another 2.8 million Americans went MIA.

In effect, there have been no new entrants to the labor force in the past three years and one month, as 802,000 existing workers have dropped out of the workforce, and all 8,481,000 potential new entrants have fallen by the wayside. In all, that’s a total of 9.3 million workers who have effectively been pushed out of the labor force. For those paying attention, that’s a total of 8,373,000 persons who are not included in yesterday’s official unemployment calculation (9,283,000 less a seasonal adjustment of 910,000).

According to the Bureau of Labor Statistics, the official unemployment rate through January 2012 is 8.3%, as calculated in the table below, where:

[ (A) Total Unemployed / (B) Labor Force = (C) Unemployment Rate ]

However, if we were to add back the 8,373,000 workers who have effectively dropped out of the labor force, during Obama’s reign of misery, the real unemployment rate would be 13.0%, as calculated in the following table.

Even if only 55.0% of those who have been incontestably and wrongfully removed from the labor force were counted, which would be consistent with the eight-year average prior to Obama, the real unemployment rate would be 10.9%, not 8.3%. Eventually the majority of these 9.3 million working age Americans will start looking for work, and if upon entering the labor force, they are unable to find gainful employment, the unemployment rate should begin to rise towards its true rate, which would be between 10.9% and 13.0%, as stated.

Conclusion: In going all the way back to the year 1929, besides the years 2009, 2010, 2011, and potentially 2012, the only other years that the United States has ever suffered annual declines in its civilian labor force were 1943, 1944, 1945, and 1951. And as far as the 6.5 million who dropped out of the labor force entirely, over the past three years (not including 2012), that represents the worst consecutive 36 month period in United States history, also dating back to 1929. Since we are not presently engaged in a World War, with millions being drafted out of the civilian workforce, and with millions being killed in action, isn’t this proof positive that the unemployment rate is being manipulated?

Based upon the facts, the Great Recession never really ended, and the unemployment rate has been manipulated. I am 99.9% certain that the Obama Administration is playing with unemployment.

Prerequisites: Manipulation 101: The Real Unemployment Rate

Related: Unemployment Actually Rose in January, Media Screams “Unemployment Rate Declines!” – Is INCREASING Unemployment Something To Brag About?

** Updated on 2/7/2012 & 2/10/2012!

Manipulation 101: The Real Unemployment Rate

* Fake it until you make it. *

* By: Larry Walker, Jr. *

The following passage is from my last post, “Labor Force Contraction with Obama – And other hidden truths” :

“Most of the electorate understands that as the size of the labor force shrinks the unemployment rate declines. But is anyone really paying attention? Since this massive decline in the civilian labor force is a verifiable fact, it’s not surprising that the Obama Administration and much of the propagandist media have chosen to ignore it.”

Okay, I confess that I was begging the question. I am fully aware that most of the population doesn’t have a clue as to how the unemployment rate is calculated, and that a healthy subset could probably care less. So in this post I will explain in more detail how, as the size of the labor force contracts, the official unemployment rate declines.

First, here are a few key definitions, which are shown in more detail at the bottom of this post.

  1. The term “non-institutional civilian population” includes persons 16 years of age and older residing in the 50 States and the District of Columbia who are not inmates of institutions (for example, penal and mental facilities, homes for the aged), and who are not on active duty in the Armed Forces.

  2. The term “labor force” includes all persons, in the non-institutional civilian population, classified as employed or unemployed.

  3. And the term “not in labor force” includes persons aged 16 years and older, in the civilian non-institutional population, who are neither employed nor unemployed.

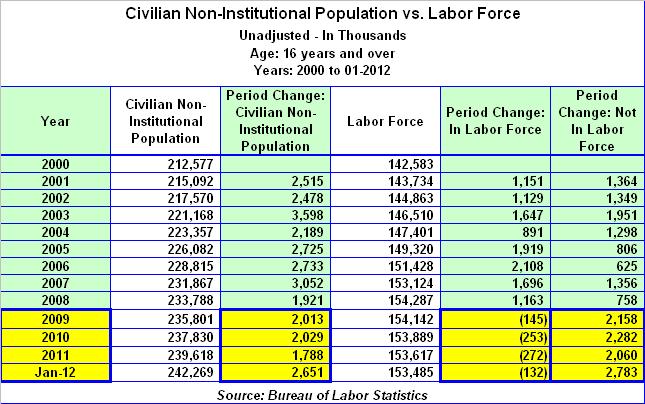
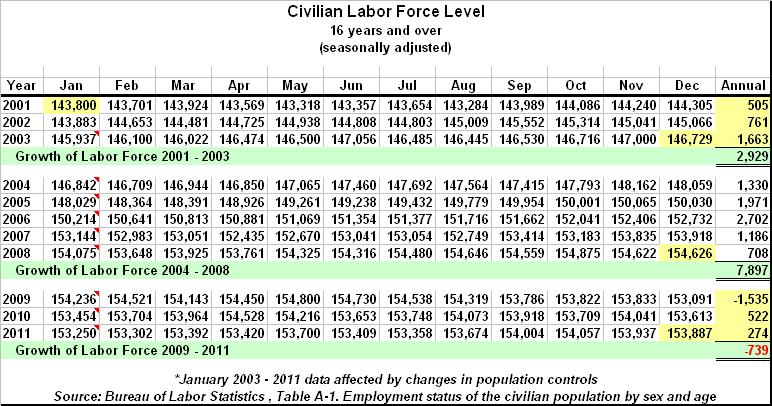
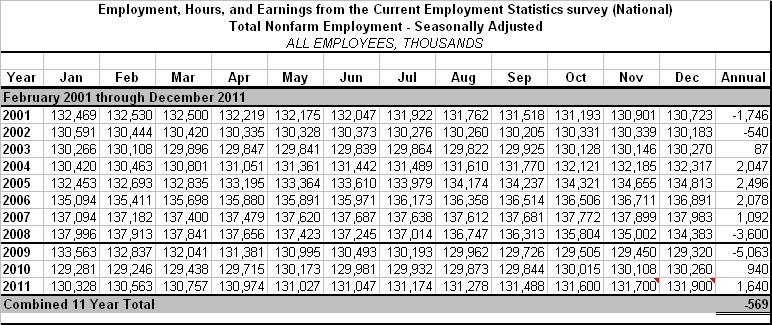
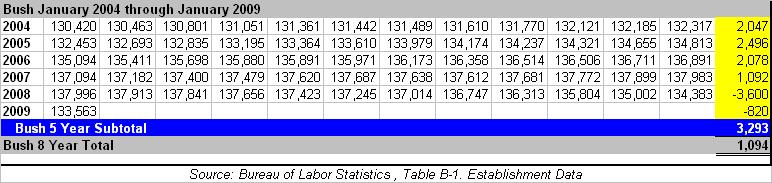
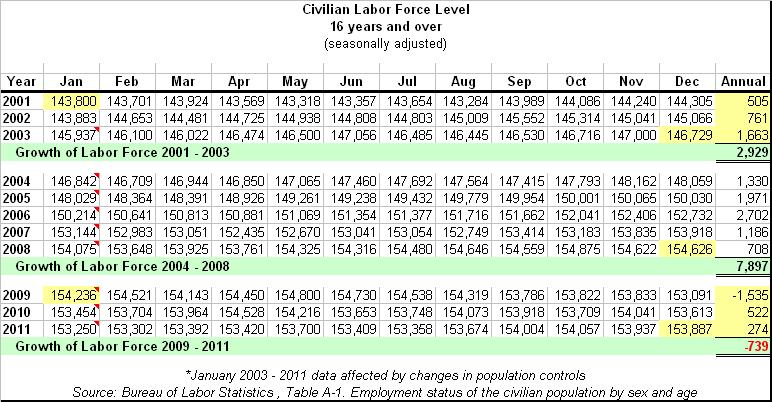
The table above shows the number of Americans counted as part of the labor force, from 2001 through 2011. It does not include those considered, “not in labor force”. You can see that during Bush’s first three years in office, although the economy was in recession, the labor force grew by 2,929,000 (on a seasonally adjusted basis). In contrast, the labor force has contracted by 739,000 during Obama’s first three years.

The dilemma posed by a declining labor force is that the non-institutional civilian population has continued to grow by approximately 1.1% each year. So in reality, the labor force didn’t only decline by 739,000 workers over the last three years (on a seasonally adjusted basis), but rather a total of 6.5 million workers dropped out (on a non-adjusted basis). What this means is that a smaller proportion of the populace is working to support a much larger cluster of retirees, unemployed, and those who have dropped out of the labor force.

As you can see, the labor force grew from 143,800,000 at the end of January 2001, to 154,626,000 by December of 2008, for an increase of 10,826,000 workers over the eight-year period immediately preceding Obama. The labor force was expanding by an annual average of 1,353,250 new entrants prior to 2009. But since January of 2009, the labor force has declined by an average of -246,333 workers per year. However, in the macro sense, the real employment situation is dramatically worse.

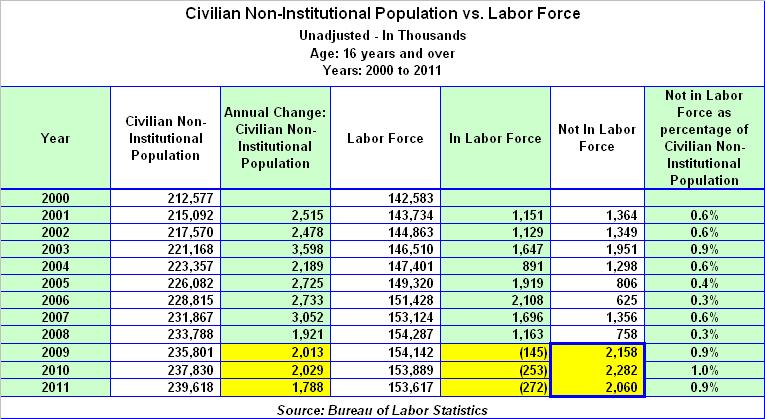
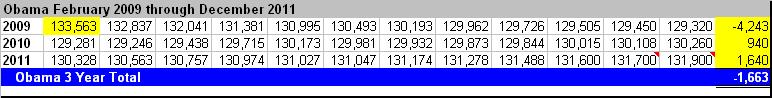
When the declining labor force is compared with growth of the civilian non-institutional population, as shown in the table below, it is clear that a total of 6.5 million Americans have dropped out of the labor force during Obama’s three years in office. This is the sum of the amounts highlighted in yellow (below). It is the difference between annual changes in the civilian non-institutional population, minus annual changes in the labor force. It represents the annual increase in the working age population, who are not being counted as part of the labor force.

For example, in 2009, the civilian non-institutional population grew by 2,013,000, yet the labor force declined by 145,000, resulting in 2,158,000 persons who should have, but did not enter the labor force. In effect, they dropped out. In 2010, the civilian non-institutional population grew by 2,029,000, yet the labor force declined by 253,000, resulting in 2,282,000 more persons who should have, but did not enter the labor force. Then in 2011, the civilian non-institutional population grew by 1,788,000, yet the labor force declined by another 272,000, resulting in 2,060,000 more persons who should have, but did not enter the labor force.

In effect, there have been no new entrants to the labor force in the past three years, as 670,000 existing workers dropped out (on an unadjusted basis), and all 5,830,000 potential new entrants fell by the wayside. Overall, 6.5 million working age persons have dropped out of the labor force under Obama. Is this change you can believe in?

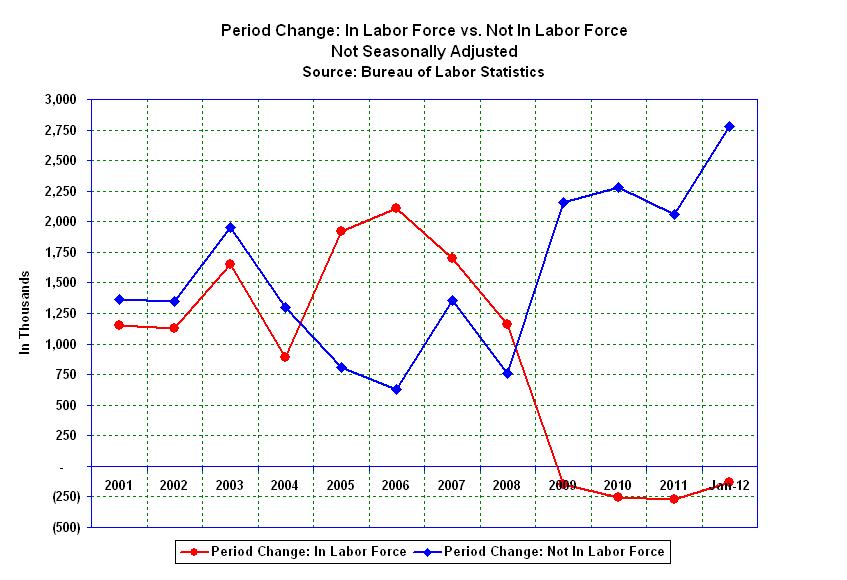
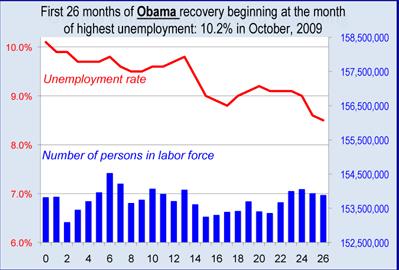
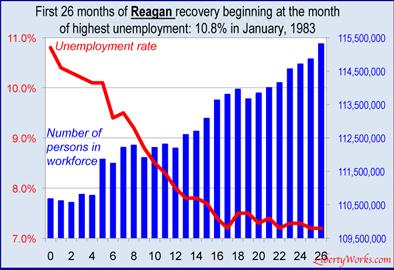
The massive decline of new entrants to the labor force, which is shown in the table above, and graphically in the chart at the top, directly impacts the unemployment rate, making the employment situation appear better than it actually is. How so?

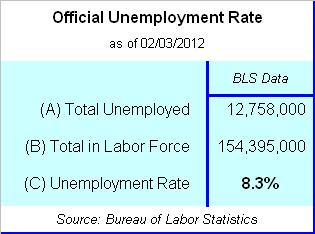
First, we must understand how the unemployment rate is calculated. The unemployment rate is calculated by dividing the number of unemployed persons by the size of the labor force:

[ (A) Total Unemployed / (B) Labor Force = (C) Unemployment Rate ]

Thus, the official unemployment rate of 8.5%, as reported by the Bureau of Labor Statistics in the January 6, 2012, Employment Situation Report, is calculated as follows:

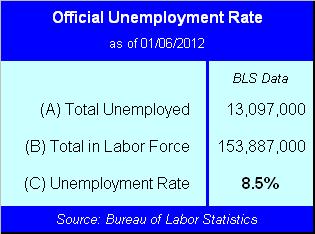
[ 13,097,000 / 153,887,000 = 8.5% ]

What this means is that, at the end of the year 2011, 13,097,000 persons were officially unemployed, out of a labor force totaling 153,887,000. And so 13,097,000 divided by 153,887,000 equals the unemployment rate of 8.5%. So how could this result have been manipulated? Why, that’s easy.

Manipulation 101

“There are three kinds of lies: lies, damned lies and statistics.” ~ Mark Twain

First of all, it is a fact that not everyone who is actually unemployed is officially counted as such. In fact, according to the Bureau of Labor Statistics, millions of Americans of working age, who are not working, are excluded from the official calculation.

Mathematically, what this means is that they have been removed from both the numerator and denominator of the equation (i.e. from both the number of unemployed and size of the labor force). Those eliminated from the official unemployment equation are classified as, “Not in the Labor Force.

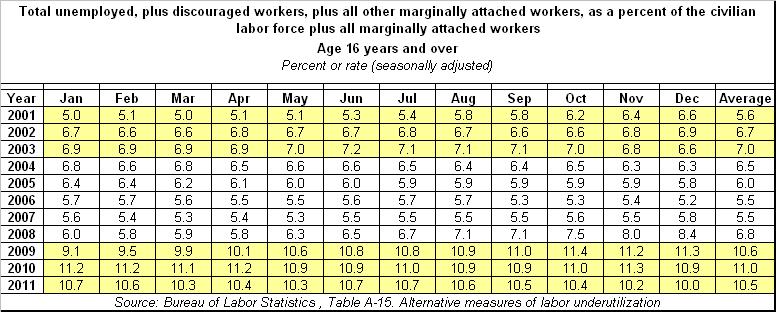
A subset of those not included in the labor force is referred to as “marginally attached”. The marginally attached are persons not in the labor force who want and are available for work, and who have looked for a job sometime in the prior 12 months (or since the end of their last job if they held one within the past 12 months), but were not counted as unemployed because they had not searched for work in the 4 weeks preceding the survey. Discouraged workers are a subset of the marginally attached.

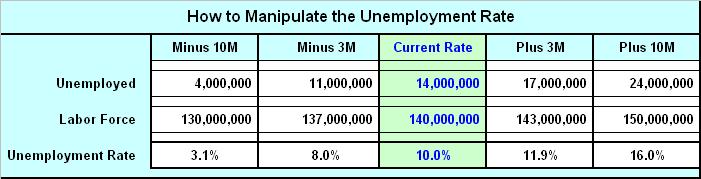
When it comes to manipulating the unemployment rate, the main question is: What happens when an equal number of persons are subtracted from both the number of unemployed and the labor force? To answer this, let’s look at an example in the table below.

Starting in the middle of the chart, let’s assume that there are 14,000,000 unemployed persons out of a labor force totaling 140,000,000. That would make the unemployment rate 10.0%. Are you with me so far?

Now, let’s remove 3,000,000, from the labor force, and see what happens. Moving one column to the left, you will note that the unemployment rate falls to 8.0%, or by 2.0 percentage points, as 3,000,000 people are removed. That’s a decline of 20%. Wow! That was easy.

If we were to remove 10,000,000 from the labor force, we would get an even more dramatic result. Moving two columns left of center; you will notice that the unemployment rate falls even farther, to 3.1%, or by 6.9 percentage points, as 10,000,000 people are removed. That’s a decline of 69.0%.

Just to add some perspective, it works both ways. Moving one column to the right, you can see that the addition of 3,000,000 to the labor force causes the unemployment rate to rise to 11.9%, or by 1.9 percentage points (an increase of 19.0%). And finally, the addition of 10,000,000 to the labor force causes the unemployment rate to rise by 6.0 percentage points, or to 16.0% (an increase of 60.0%).

So it may be stated that, the act of removing workers from the labor force causes the unemployment rate to decline. It is also evident that an expanding labor force, in which new workers are unable to find work, should cause the unemployment rate to rise. Another fact is that classifying more workers as “not in the labor force” causes a greater percentage decline in the unemployment rate, than the percentage increase realized by allowing a natural expansion of the labor force. Got it?

Therefore, when the unemployment rate is higher than desired, all one has to do is remove a few million workers from the labor force, and voilà, “We are moving in the right direction.”

Now I’m not necessarily saying that the Obama Administration purposefully manipulated the unemployment rate, but since the Bureau of Labor Statistics is a governmental agency, run by a presidential appointee, it’s highly probable. I’m just saying that I no longer have faith in the Bureau of Labor Statistics’ ability to remain impartial. Perhaps going forward the functions of this agency, as well as others, should be factored out to private non-partisan concerns.

What’s the real unemployment rate?

The Bureau of Labor Statistics (BLS) itself admits that among those it has subtracted from a labor force, several million actually want to work. So I ask you this, If an individual is not working, but desires to have a job, is he (or she) not essentially unemployed? I say, “Yes”, but the BLS says, “No”. So is this a material issue, or is it diminimus? In other words, how many people are we really talking about?

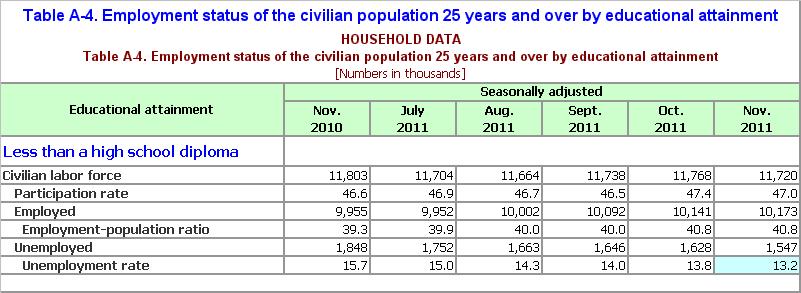
Well, let’s turn to Bureau of Labor Statistics – Table A-38, Persons not in the labor force by desire and availability for work, age, and sex (below). To be precise, as far as BLS methodology goes, as of December 31, 2011, a staggering 87,212,000 working age Americans were not counted as part of the labor force. Among these, it is reported that 81,077,000 do not want a job, and that another 6,135,000 actually want to work.

To reiterate, in my book, if someone wants a job and doesn’t have one, that person is unemployed and should be counted as such. What’s the point of calculating an unemployment rate, which doesn’t include all persons who are unemployed?

Regarding those included or excluded from the labor force, here are a couple of important items to note:

  1. First of all, the BLS only surveys around 60,000 households per month in order to come up with these figures. So as far as we know, the number of unemployed persons who want to work, but are not counted as part of the labor force, could be much greater than what’s being reported.

  2. Secondly, according to Footnote No. 1, in Table A-38 (above), not everyone reported as wanting or not wanting to work is asked. Wait, so not everyone is asked? You know the old saying, “Never assume.”

So, in light of the fine print, the entire sampling outcome is at best grossly inaccurate, and at worst subject to outright manipulation.

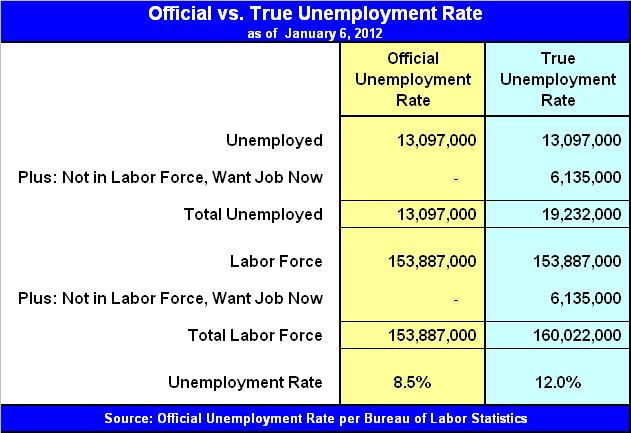
From Table A-38, we can see that 6,135,000 workers, not counted as part of the labor force, actually want to work. So what would happen if we added them back into the labor force? Well, let’s run it and see.

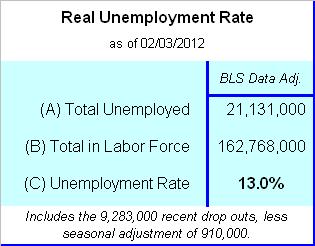
In the table below, when the 6,135,000 workers are added back to the labor force, and rightfully counted as unemployed, the unemployment rate jumps from 8.5% to 12.0% (an increase of 41.2%). Is a deviation of 41.2% of material importance? I would think so.

I would contend, that based on BLS data, the true unemployment rate is closer to 12.0%. But at the same time, since only a small sample is surveyed, who’s to say that a large portion of the other 81,077,000 working age individuals, not counted as part of the labor force, don’t want jobs? Did anyone bother to ask them? No. So the actual unemployment rate could easily be much greater than 12.0%. Are you still with me?

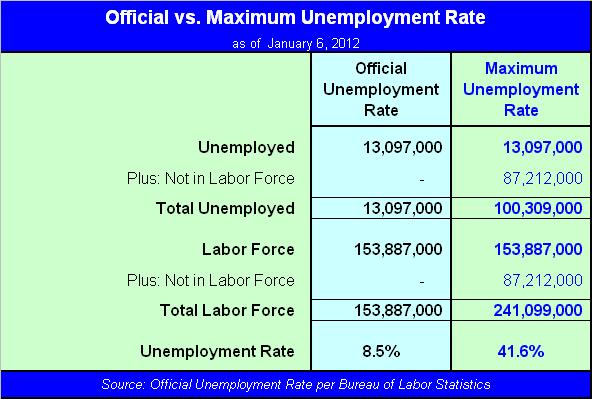
In the table below, I have calculated the maximum unemployment rate. That is to say, what it would be if all 87,212,000 working age individuals, not presently included as part of the labor force, were included. When we count them all, the maximum unemployment rate jumps to 41.6%.

You laugh? Well, I’m not laughing. So, based on information published by the federal government, the actual unemployment rate is somewhere between 12.0% and 41.6%. That leaves a lot of room for play, as the lowest the rate can possibly go is 0.0%, and the highest 41.6%. [By the way, the maximum rate doesn’t include those considered to be employed who, for all practical purposes, really aren’t (see the definition of “Employed”, below).]

Disregarding the Bureau of Labor Statistics sampling assumptions, the methodology of which you may find at http://www.bls.gov/, for all we know, a larger segment of the population is becoming homeless, generationally dependent, or permanently unemployable. I believe that there are several million more unemployed Americans, who want to work, than we are being told.

In my entire life-time, neither the Bureau of Labor Statistics nor the Census Bureau has ever called upon me to participate in one of these monthly, 60,000 household employment surveys. So who are they calling? How can they call someone who doesn’t have a phone? Where do these numbers really come from? From what I can tell, that’s classified information. Have they ever called you?

So while Obama tells us on the one hand, “We’re making progress,” in reality, all that’s happened is that a larger segment of society has given up any hope of ever having a job. Based upon the job killing policies of his Administration, I would say this is more likely to be the case today, than at any time in U.S. history. So this is progress? And now Obama wants another term to, “finish the job.” I think we’re already finished; the baby boom implosion will take care of the rest.

The Bottom Line: The official unemployment rate is misleading, and can be easily manipulated. By simply removing two or three million persons from the labor force (a little here, a little there), one can easily trim a couple of percentage points off of the official unemployment rate, and then declare that the economy is improving.

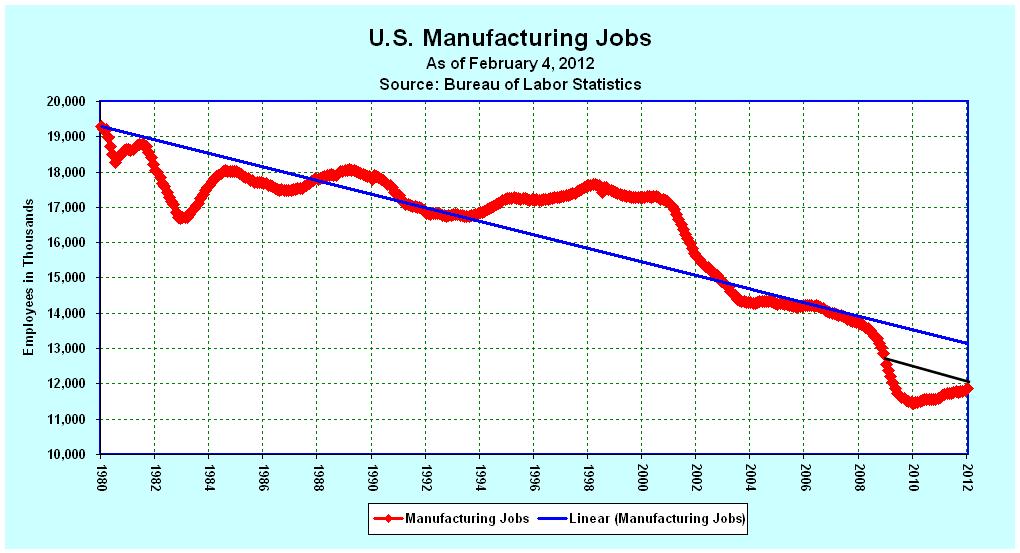
Since the beginning of 2009, the net result of Obama’s anti-success rhetoric, coupled with the most reckless deficit-spending record in U.S. history, has been an increase of 6.5 million workers who are no longer counted as part of the labor force. And on top of this, the economy has lost 1.7 million jobs, since February of 2009. The real unemployment rate isn’t 8.5%, it’s somewhere between 12.0% and 41.6%, perhaps even higher, depending upon one’s perspective.

In light of this reality, I find Obama’s statement, “We are moving in the right direction,” to be most absurd. Come on man! But on the brighter side, there is a tremendous opportunity for a new Administration to step in, in 2013, and show the Socialists, Progressives, and Communists who have taken over the Democrat Party, and the delusional fakers and wannabe’s in the White House, who are on their way out of power, what the “right” direction genuinely looks like. Godspeed!

Definitions:

  • Labor force (Current Population Survey) – The labor force includes all persons classified as employed or unemployed in accordance with the definitions contained in this glossary.

  • Civilian non-institutional population (Current Population Survey) – Included are persons 16 years of age and older residing in the 50 States and the District of Columbia who are not inmates of institutions (for example, penal and mental facilities, homes for the aged), and who are not on active duty in the Armed Forces.

  • Employed persons (Current Population Survey) – Persons 16 years and over in the civilian non-institutional population who, during the reference week, (a) did any work at all (at least 1 hour) as paid employees; worked in their own business, profession, or on their own farm, or worked 15 hours or more as unpaid workers in an enterprise operated by a member of the family; and (b) all those who were not working but who had jobs or businesses from which they were temporarily absent because of vacation, illness, bad weather, childcare problems, maternity or paternity leave, labor-management dispute, job training, or other family or personal reasons, whether or not they were paid for the time off or were seeking other jobs. Each employed person is counted only once, even if he or she holds more than one job. Excluded are persons whose only activity consisted of work around their own house (painting, repairing, or own home housework) or volunteer work for religious, charitable, and other organizations.

  • Unemployed persons (Current Population Survey) – Persons aged 16 years and older who had no employment during the reference week, were available for work, except for temporary illness, and had made specific efforts to find employment sometime during the 4-week period ending with the reference week. Persons who were waiting to be recalled to a job from which they had been laid off need not have been looking for work to be classified as unemployed.

  • Not in the labor force (Current Population Survey) – Includes persons aged 16 years and older in the civilian non-institutional population who are neither employed nor unemployed in accordance with the definitions contained in this glossary. Information is collected on their desire for and availability for work, job search activity in the prior year, and reasons for not currently searching. (See Marginally Attached Workers.)

  • Marginally Attached Workers (Current Population Survey) – Persons not in the labor force who want and are available for work, and who have looked for a job sometime in the prior 12 months (or since the end of their last job if they held one within the past 12 months), but were not counted as unemployed because they had not searched for work in the 4 weeks preceding the survey. Discouraged workers are a subset of the marginally attached. (See Discouraged Workers.)

  • Discouraged Workers (Current Population Survey) – Persons not in the labor force who want and are available for a job and who have looked for work sometime in the past 12 months (or since the end of their last job if they held one within the past 12 months), but who are not currently looking because they believe there are no jobs available or there are none for which they would qualify.

Link to Chart Data: Google Docs

Charts: Unemployment Rate vs. Size of Labor Force

– Courtesy of Liberty Works

* The following charts track the unemployment rate and the size of the labor force. *

The chart above shows that over the first 25 months of the current recovery the unemployment rate has declined from 10.1% to 8.5% while the size of the labor force is virtually unchanged even though the working age population has grown.

Since the beginning of 2008 the working age population has grown by 7.2 million people.  Yet the labor force which is normally about two-thirds of the working age population has shrunk over the same period by 49,000.

Thus, 4.8 million men and women who should be included in the unemployment rate calculation as both in the labor force and unemployed are not counted at all because they have become too discouraged to look for jobs.

If those men and women were included in the unemployment rate calculation the December rate would have been 11.3%, higher than any time since 1940.

The second chart above tracks the first 25 months of the Reagan recovery of the 1980s. President Reagan inherited a sick economy and a deep recession that by most measures was worse than what President Obama inherited.  As the chart shows, the unemployment rate soared even higher but then there was a steep drop even as the labor force grew by 4.3 million!  People did not give up looking for jobs during the Reagan boom because there was robust growth in the economy and employers were creating hundreds of thousands of jobs every month.

[…]

There is a potential downside that could blow up Obama’s propaganda campaign. If the “good news” about the unemployment rate encourages several million people to come back into the labor force and seek jobs, the number officially classified as “unemployed” will increase and the unemployment rate will tick back up as the November election approaches.

Read the full story at – Liberty Works

Labor Force Contraction with Obama

– And other hidden truths

– By: Larry Walker, Jr. –

On January 7, 2012, Barack Obama boasted, “We’re moving in the right direction. We have made real progress.” Then he went on to exaggerate that, “Altogether more private sector jobs were created in 2011 than any year since 2005.” Naturally, such jovial assertions propelled many left-wing moonbats back to work today, if you can call blogging false claims such as that ‘Obama created more jobs in one year than Bush did in eight’, and other malarkey, work. It’s funny that these same cherry-pickers never attempt to match wits when it comes to the national debt. We all know that Obama has borrowed $1.0 trillion more in 3 years, than Bush did in eight, but I digress. So let’s examine Obama’s latest victory on the jobs front, for what it really represents.

Are we heading in the right direction?

To find out, we took a closer look at the official data published yesterday by the Bureau of Labor Statistics (BLS). According to Table B-1, Establishment Data, the American economy has lost a total of -569,000 non-farm jobs since January of 2001. So in terms of jobs growth, what is factual is that not one new net job has been realized over the last 11 years (see table below). So are we headed in the right direction? I am reminded of a quote from the movie “2012” – “When they tell you not to panic, that’s when you run.”

Zooming in a little closer, we can see that -1,663,000 jobs have been lost since February of 2009, the month after Obama’s inauguration (see table below). So although 1,640,000 jobs were gained in the year 2011, and 940,000 in 2010, long forgotten by Obama are the -4,243,000 jobs that were lost during his first year in office. Granted, the fact that the economy is no longer losing jobs is a good thing, but it doesn’t necessarily mean we are heading in the right direction. One would have to examine a number of other factors in order to make that affirmation, such as the recent downgrade to the U.S.A.’s credit rating, and the 333% growth in government debt over Obama’s first three years.

By comparison, George W. Bush, who also inherited a recession from his predecessor, suffered total job losses of -2,199,000 by the end of his third year in office (see table below), while Obama lost -1,663,000 during his first three years (see table above).

So for starters, it is incorrect to state that any jobs have been created since Obama became president, because net jobs have been lost (not gained). Therefore, a more fair and balanced statement would be that, ‘during their first three years in office, Obama lost -536,000 fewer jobs than Bush’. Now as far as I’m concerned, that’s hardly worth breaking out the caviar and champagne. What it really means is that in comparing both presidents up to this point in their terms, Obama is less of a loser than Bush. But two losers don’t make a winner.

Were more jobs created in 2011 than in any year since 2005?

Next, since Obama remarked that ‘more jobs were created in the year 2011 than in any year since 2005’, we must verify his claim. Actually this is not true, as you can see in the table below. The facts show that in 2004, 2005, 2006, and 2007 the economy produced total jobs growth of 2,047,000, 2,496,000, 2,078,000, and 1,092,000 jobs, respectively. So although it may have been correct to state that more net jobs were realized in 2011 than in any year since 2006, because 2,078,000 were realized in 2006, while 1,092,000 were attained in 2007, versus 1,640,000 in 2011, pulling the year 2005 out of a hat was a stretch.

“It is hard to believe that a man is telling the truth when you know that you would lie if you were in his place”.  ~ Henry Louis Mencken

Aside from twisting the truth, all that this really means is that fewer net jobs were realized in 2007, 2008, 2009, and 2010 than in 2011. So what? The recession officially ended in June of 2009, and now finally, two and a half years later, Obama beat what are essentially recessionary benchmarks. Congratulations! But what about the -3,600,000 jobs that were lost in 2008? And the -5,063,000 that were lost in 2009? It’s as if a tiny accomplishment, cherry-picked from an arbitrary year, isolated from the rest of recent history, has the power of changing that very history. Sure thing chief!

In the end, over Bush’s eight-year term, from February of 2001 through January of 2009, a total of 1,094,000 net jobs were realized; while during Obama’s first three years in office, from February of 2009 through December of 2011, a total of -1,663,000 net jobs have been lost. So that means Obama must gain another 2,757,000 jobs before his left-wing moonbats can boast of even equaling what they consider to be the miniscule accomplishment of George W. Bush. Good luck with that, since you’ve got less than 12 months to get there.

Omitting Marginally Attached and Discouraged Workers

Now we will turn attention to the unemployed, and the uncounted, marginally attached and discouraged workers. You will note in the data from BLS Table A-15, Alternative Measures of Labor Utilization, (below) that during Bush’s first three recessionary years, the percentage of unemployed, plus marginally attached and discouraged workers averaged between 5.6% and 7.0%. You can also see that during Obama’s first three years, the rate has jumped to an average of between 10.5% and 11.0%. In fact, as of December 31, 2011, a larger percentage of Americans are unemployed, discouraged, or marginally attached to the labor force than at anytime since 1994 (when the statistic was first measured). So does this hidden fact somehow back up the words, “we are moving in the right direction”? Only if the direction Obama is espousing entails enslaving millions more to lives of perpetual government dependency. We’ve seen brighter mornings.

The Shrinking Labor Force

Finally, the data from BLS Table A-1, Employment Status of the Civilian Population by Sex and Age, (below) shows the number of Americans counted as part of the civilian labor force, from 2001 through 2011. We can see that during Bush’s first three years, the civilian labor force grew by 2,929,000. In contrast, the labor force has contracted by -739,000 during Obama’s first three years. So is this good, or bad? Well, since the population is growing by 1.2% each year, a contracting labor force means that a smaller proportion of the populace is working to support a larger group of retirees, unemployed, and those who have dropped out of the labor force. So I would say this isn’t exactly “morning in America”.

As you can see, the labor force grew from 143,800,000 at the end of January 2001, to 154,236,000 by January of 2009, for an increase of 10,436,000 workers over the eight-year period immediately preceding Obama. So while the labor force was expanding by an annual average of 1,304,500 new entrants before Obama, it has suddenly declined by an average of -246,333 workers per year since January of 2009. So as Obama has been out golfing, vacationing and as he now celebrates his grand achievement, better than 1,000,000 Americans have fallen through the cracks during each of his three years in office. These are either not working, not currently looking for work, or have permanently given up looking. They are not counted in the official December unemployment rate.

Most of the electorate understands that as the size of the labor force shrinks, the unemployment rate declines. But is anyone really paying attention? Since this massive decline in the civilian labor force is a verifiable fact, it’s not surprising that the Obama Administration, and much of the propagandist media have chosen to ignore it.

The Bottom Line: Obama has lost a total of -1,633,000 net jobs since he entered office. Not one new net job has been gained since the year 2007. The percentage of unemployed, plus marginally attached and discouraged workers stands at 10.5% as of December 2011, versus an average of 5.5% to 7.0% during the prior eight years. The civilian labor force has contracted by -739,000 workers since January of 2009, for an average loss of -246,333 per year, versus average growth of 1,304,500 per year in the eight years prior to Obama. So perhaps, Obama’s latest fabrication isn’t all it’s cracked up to be.

Related:

Obama’s lost labor force – NetRight Daily

Civilian Employment to Population Ratio Lowest Since Carter / Early Reagan … And Flat-lined! Employment Misery Index Increasing! – Confounded Interest

So Now, It’s ‘Recovery Winter’!! – Joshua Pundit

Obama’s Fraudulent Unemployment Rate – Liberty Works

What Does $40 per Week Mean To You?

– Let’s see, to me one thing it means is that the federal government will be adding another $120 billion to the national debt. For my friend Jeff, at Liberty Works, it means – we’ve been bamboozled again. –

By: BoomerJeff | Liberty Works

“… On Thursday Obama ramped up the theatrics and gave us a preview of his New Year strategy for diverting attention away from his manifest failures. He stepped to the microphones to prove he identifies with the struggles of the helpless against those cruel Republican Scrooges (transcript). His tone dripping with pious solicitude, he began:

We’ve been doing everything we can to make sure that 160 million working Americans aren’t hit with a Holiday tax increase on January First…If you’re a family making about $50,000 a year this is a tax cut that amounts to about a thousand dollars a year. That’s about forty bucks out of every paycheck.

So far the President’s math is correct, since most employees are paid either bi-weekly or semi-monthly.

It may be that there are some folks in the House who refuse to vote for this compromise because they don’t think forty bucks is a lot of money. But anyone who knows what it’s like to stretch a budget knows that at the end of the week or the end of the month forty dollars can make all the difference in the world…

So on Tuesday we asked folks to tell us what it would be like to lose forty bucks every week.

Wait a minute! “Every week?” He just changed it from $40 out of every paycheck to $40 every week! But the temporary tax cut is worth only $19 every week to his hypothetical $50,000 per year family.

You’d have to earn $104,000 a year for Obama’s Social Security tax markdown to be worth $40 every week.

Obama then quoted some of the emails from his “folks” about how they would deal with the loss of $40 per week.

Joseph from New Jersey would have to sacrifice the occasional pizza night with his daughters. My 16 year old twins will be out of the house soon – I’ll miss this.

Richard from Rhode Island wrote to tell us that having an extra $40 in his check buys enough heating oil to keep his family warm for three nights. In his words, and I’m quoting, If someone doesn’t think that 12 gallons of heating oil is important invite them to spend three nights in an unheated home.

Pete from Wisconsin told us about driving more than 200 miles each week to keep his father in law company in a nursing home. $40 out of his paycheck would mean that he could only make three trips instead of four.

Dinner out for child who’s home for Christmas, a pair of shoes – these are the things that are at stake for millions of Americans. They matter a lot.

Obviously these emails are absurd. If you earn $104,000 and have to give up $40 per week, are you really going to have to deny your kids a pizza or a pair of shoes? Will you shiver for three nights without heating oil?

Of course, there are some folks to whom $40 every week would be make a real difference:

  • A hotel maid who works full time for $8.50 per hour

  • A construction worker who has been cut back to half time work at $17 per hour

  • A self employed business owner whose customers were hammered by the recession and now barely survives by depleting his savings. He generated only $17,700 profit this year after paying his employees and the employer’s half of the payroll tax which was not reduced by the Obama payroll tax markdown.

To each of these people Obama’s temporary payroll tax cut is worth not $40 but $6.80 per week.

But much of the media have already begun to help Obama plant a false perception in the minds of uninformed voters that Republicans would deny everyone $40 per week. (For example, see the headline here.)

Obama knows that informed voters will figure out the deception. But he doesn’t care about informed voters. They won’t vote for him anyway.”

Obama’s Last Stand | A Level Playing Field

Unemployment and Educational Attainment

– By: Larry Walker, Jr. –

In a speech given on December 6, 2011, Barack Obama, the Debtor-In-Chief, called for a Level Economic Playing Field. “This isn’t just another political debate. This is the defining issue of our time. This is a make-or-break moment for the middle class, and all of those who are fighting to get into the middle class,” he said. “At stake is whether this will be a country where people can earn enough to raise a family, build a modest savings, own a home and secure their retirement.” Yeah whatever! His populist tone, however, has fallen mostly upon deaf ears, as America has come to realize that the $5 trillion of debt, which he has racked up over the last 3 years, is the real defining issue of our time. And that in spite of all of his irresponsible borrowing and spending, Obama has delivered next to nothing in the way of improved permanent living standards for any American.

Newsflash! The recession ended in June of 2009. The economic crisis is over. What we are witnessing at this point is what an economy looks like, some 29 months after a recession has ended, when an emaciated government Administration has miserably failed its people. No, this isn’t a recession, it’s an Obama recovery. If things aren’t moving fast enough for you, it just may be that the Class-Warfare-Instigator-In-Chief has been focused more on disarming the economy than fortifying it. Those who are content with waiting on Obama to remake America, in his own image and likeness, will find themselves waiting a long time, as it originally took some 244 years to get where we were prior to his anointing.

But as for the rest of us, we don’t have to wait any longer than November of 2012 to bury Obama’s dated ideals of crony capitalism and political pandering back underneath the trash heap from which they emanated. As the self-ascribed millionaire, and so called, spokesman for the poor and downtrodden, engages in an irrational personal conflagration to extend a contrived $8 to $16 per week payroll tax cut for most working Americans, while at the same time bankrupting the nation as a whole, most of us realize that it’s going to take a lot more than a temporary handout to fix what is likely a systemic problem.

Does Obama seriously believe that someone hearing his class-warfare vitriol will suddenly be inspired to run out and enroll in a G.E.D. program, or college; or to start a new enterprise? Because I don’t think his divisive tone cuts the mustard. Will an $8 to $16 per week bounty seriously be enough to usher us into the Promised Land? Yeah, right! So Obama has chosen to make his last stand — the act of doling out a one-year, deficit-financed, premature social security distribution (for the 3rd year in a row), while at the same time handing each American citizen our “fair share” of a national debt, that is now $48,254 for each and every one of us. But it seems to me that he might want to take care of his own issues first, since he (Obama) has already inflated the national debt by 50% of the amount incurred by the first 43 presidents, in just 3 years. The thought of another nickel of reckless spending coming out of this White House makes me want to see him rot in a federal penitentiary, for the rest of his days. After all, has he not essentially stolen the future away from my children and grandchildren?

What is the Playing Field?

So let’s look at the facts surrounding what would be involved in leveling the so called playing field, as Obama so ineptly echoes. According to the Bureau of Labor Statistics (BLS), the unemployment rate among those, 25 years of age and older, who have attained less than a high school diploma is a whopping 13.2%, while it is only 4.4% for those with a Bachelor’s Degree or higher. And according to the U.S. Census Bureau, households with a householder 25 years old and over, with less than a high school diploma have median incomes of $24,787, while those with a Bachelor’s Degree or higher have median incomes of $82,109. So what does that tell you? It tells me that some people achieve more than others, but it doesn’t tell me that the playing field is not level.

The following table, courtesy of the BLS, was split up into four parts, mainly due to the overall size, but also to focus on the characteristics of each category. First, as of November of 2011, the unemployment rate among those age 25 and over who have attained less than a high school diploma was a colossal 13.2%, while the labor force participation rate was a mere 47.0%. That means that while some 10.2 million in this category were employed, another 1.5 million were unemployed, and that there were another 13.2 million people somewhere out there who never made it through high school. Although this is the smallest of the four categories, one’s chances of employment are greatly diminished by not finishing high school.

Next, according to the BLS, the unemployment rate among those 25 years of age and over who are high school graduates was 8.8%, which is still rather high, while the labor force participation rate was 60.3%. That means that while some 33.8 million in this category were employed, another 3.3 million were considered unemployed. Note: It’s curious that the overall unemployment rate dropped from 9.0% in October 2011 to 8.6% in November of 2011, primarily due to the fact that 315,000 workers dropped out of the labor force, and that the civilian labor force among high school graduates — with no college, fell by 302,000. Is this just a coincidence?

In comparison, for those equipped with a high school diploma, along with some college or an Associate’s Degree, the unemployment rate was 7.6%, which isn’t all that great, but better than the former categories, and the labor force participation rate was also an improvement at 68.4%. This means that while some 33.9 million in this category were employed, another 2.8 million remained unemployed.

Finally, among those with a Bachelor’s Degree or higher, the unemployment rate was a mere 4.4%, while the labor force participation rate was a tolerable 76.0%. What a dramatic improvement. This means that some 45.0 million college graduates were employed, while just 2.1 million were considered unemployed. Thus, one’s chances of employment are immensely greater after attaining a college degree.

So from the above, we can state that we have a civilian labor force of 132.7 million people, 25 years of age or older, and that among these, as of last month, 123.0 million were employed, and 9.7 million were unemployed. And as far as the unemployed, 2.1 million have a Bachelor’s Degree or higher, 2.8 million attended some college, 3.3 million stopped after high school, and another 1.5 million never graduated from high school. Among those who are employed, 45.0 million are college graduates, 33.9 million attended some college, 33.8 million stopped after high school, and 10.2 million dropped out of high school.

What should be rather obvious from the preceding tables is that the higher one’s level of education, the greater one’s chances of employment, especially in a tough economy. So how does Obama propose to level this playing field? Will he give non high school graduates honorary diplomas? Or will he take money and opportunities away from achievers and hand it over to non-achievers? For the most part, all I ever hear from Obama is nonsense such as, ‘tax high achievers and give a portion of their earnings over to non-achievers’, or ‘tax the rich, and give $8 to $16 per week tax cuts to those who already have jobs’. But how would either method fix the achievement inequality gap which is evident in the preceding tables? They won’t.

You see, there is no way to make this playing field any more level than it already is. I mean it is what it is. If you want a good life, the first step is to finish high school, and if you don’t, it’s not the responsibility of those who did to take care of you. If you want to do a little better, then plan on attending college because, even if you don’t finish, your life will be immensely better. Heck, I’m not ashamed to say that I didn’t finish college until I was 32 years old. And I managed to trudge through it with a full-time job, and a wife and four children at home. Had I not done so, my advancement would have been limited at best. And when I finished, I didn’t have a dime of student loan debt. So it can be done, and it must be done in order to obtain anything in this society. That’s just the way it is.

Digging a little deeper, according to the U.S. Census Bureau’s 3-Year Estimates, among those 25 years of age and over, only 27.8% attained a Bachelor’s Degree or higher, while 15.1% didn’t make it through high school (see table below). According to the data, 29.0% graduated from high school (including equivalency), 20.7% attended some college but did not get a degree, 7.5% attained Associate’s Degrees, 17.6% earned Bachelor’s Degrees, and 10.2% obtained Graduate or Professional Degrees. So although 84.9% of Americans graduated from high school, a much smaller percentage went on to complete college. So that brings us to the big question: Does one’s level of educational attainment make any significant difference in economic standing?

Well, according to the U.S. Census Bureau’s 3-Year Estimates, we can see (in the table below) that the poverty rate among those with less than a high school diploma is 24.5%, while it was 11.8% among high school graduates, 8.2% for those with some college, and only 3.7% for those with a Bachelor’s Degree or higher. So the chances of living a life in poverty are greatly enhanced for those who fail to graduate from high school, while being very slim for those attaining at least a Bachelor’s Degree. So does this mean that the playing field isn’t level? Do high achievers have a responsibility to take care of non-achievers? Did some of us start out on a different playing field, other than kindergarten? And is it possible for Obama’s wealth redistribution vision to turn back the hands of time and place everyone back on Square One? The answers to all of the above — a solid “No”.

As I mentioned in, Obama’s Square Deal and Just Deserts, and according to the U.S. Census Bureau, in 2010, households with a householder 25 years old and over with less than a 9th grade education earned median incomes of $21,254 and mean incomes of $30,232, while those with some college earned median incomes of $48,722 and mean incomes of $61,026, and those with a Bachelor’s Degree or higher earned median incomes of $82,109 and mean incomes of $104,555 (see table below). So anyone who wants to earn their ‘fair share’ should be prepared to plot their ‘own course’, and to complete the necessary steps. How high you reach, and how you get there is simply a matter of free will. So unless Obama is proposing to take away free will, or to somehow make college education mandatory, all of this “level playing field” rhetoric is just smoke.

I will go ahead and submit that America is firmly planted on an even playing field. It begins in kindergarten and ends where it ends, due to personal choices, parental upbringing, and life experiences. I will also state that high achievers do not owe non-achievers a single solitary dime. Nor is it the responsibility of the federal government to improve the lives of those who make bad choices. Sure, government can and should encourage upward mobility, but as the saying goes, “You can lead a horse to water, but you can’t make him drink.” It is not the federal government’s responsibility to knock high achievers back a few steps so that non-achievers can catch up. Sorry, but it doesn’t work like that. Just like God helps those who help themselves, governments should only venture to help those who help themselves.

Now will somebody please explain to me how giving out $8 to $16 per week deficit-financed handouts (i.e. the payroll tax cut), to people who are already working, will manage to level the playing field for the 11.7 million civilian workers who, for one reason or another, didn’t bother to graduate from high school? Or for that matter, for the 37.1 million who chose to climb no higher than high school? My short answer is that it won’t. In fact, nothing that Obama has been spewing will miraculously turn lower levels of educational attainment into higher learning, nor bigger paychecks. For all his rhetoric, Obama hasn’t inspired one American to pick themselves up by the bootstraps and try to make progress.

In truth, all that I’ve heard from Obama are the following misnomers — society isn’t fair, and under-achievers are owed something by those who have been more successful. Yet it turns out that the most successful members of our society are mainly those who finished high school, and went on to graduate from college. Hopefully someone in the ‘class’, that either didn’t finish high school or is thinking about dropping out, will be inspired by what you have just read, to indeed pick “yourself” up and move forward. And I would to God that some Ronald Reagan protégé would take up the mantle, and again speak those words that so inspired me to pick myself up by the bootstraps, return to school, and seek a better life.

We must not look to government to solve our problems. Government is the problem.” ~Ronald W. Reagan

Obama’s Square Deal and Just Deserts

What? Obama Borrowed $5 Trillion in 3 Years?

– By: Larry Walker, Jr. –

It was back on July 3, 2008 when Barack Obama exclaimed, “The problem is, is that the way Bush has done it over the last eight years is to take out a credit card from the Bank of China in the name of our children, driving up our national debt from $5 trillion for the first 42 presidents – #43 added $4 trillion by his lonesome, so that we now have over $9 trillion of debt that we are going to have to pay back — $30,000 for every man, woman and child. That’s irresponsible. It’s unpatriotic.”

To be fair, it took Bush a full 8 years to run up a $4 trillion dollar tab, yet just three years into his one-term proposition, Obama has already run up another $5 trillion, by his lonesome. So what does that make him, a genius? Today we have a national debt of $15.1 trillion that we are going to have to pay back — $48,254 for every man, woman and child, and $133,993 for every U.S. taxpayer. So it may be said that Obama’s record on the national debt is 333 times more irresponsible, and 333 times more unpatriotic, right? But let’s just call it, “Not Fair”.

To be equitable, all that Obama has accomplished, thus far, is to hand every citizen a $48,254 handicap, and to put every U.S. taxpayer $133,993 in the hole. Since I officially became a grandfather in October of this year, the thought of this lying, hypocrite lecturing my children and grandchildren about fairness, as he hands them each their share of $133,993 of the U.S. debt, because they will surely inure their ‘fair share’, makes me sick. Fair shot, fair share, same rules?

The quotation “All men are created equal” has been called an “immortal declaration“. So can Obama top this?

“We hold these truths to be self-evident, that all men are created equal, that they are endowed by their Creator with certain unalienable Rights, that among these are Life, Liberty, and the Pursuit of Happiness. That to secure these rights, Governments are instituted among Men, deriving their just powers from the consent of the governed….” ~U.S. Declaration of Independence

I didn’t think so. Somebody needs to tell the idiot-in-chief that in America, everybody has a fair shot, everybody pays their fair share, and everyone plays by the same rules; the only exception being perhaps he and his cronies.

According to the U.S. Census Bureau, household income is a product of one’s level of education. It’s a fact that households with a Bachelor’s Degree, or greater, earn higher incomes. So if you want more income, you better finish college, otherwise, be happy with what you get, because it could be a lot worse. After all, this isn’t the 3rd world. American’s know the drill, and we make the choices that we need to make, to get where we want to be. And if we fall short, we push our children forward.

Those with less than a 9th grade education can expect to earn median incomes of $21,254, and mean incomes of $30,232, while those with some college can expect median incomes of $48,722, and mean incomes of $61,026. In contrast, those with professional degrees may expect to earn median incomes of $119,825, and mean incomes of $159,202. So anyone who wants to earn their ‘fair share’ should be prepared to plot their ‘own course’, and complete the necessary work. How high each wants to rise, and how they get there is a matter of free will.

Don’t lecture me about fairness. As far as I’m concerned it would be fair to put debt ridden administrations, like this one, and their political minions away – in the nearest penitentiary. Yeah, 14 years would send a powerful message. You want to overspend and force me, my children and grandchildren into debt; then you should pay the ultimate price. You talk about a fair deal? Is it fair for the federal government to be sitting on its collective butt, borrowing $4 billion per day on “our” behalf? I say not. That’s why you can take your 2% payroll tax cut and shove it! Then you can get off the stump, cancel that vacation, curb government spending and balance our collective budget. Otherwise prepare to be ‘thrown’ out of office, and to inherit your just deserts.

Related:

National Debt Bomb | 1976 to 2011

Four More Trillion | Not Change

National Debt: A National Disgrace

Photo via: http://ibloga.blogspot.com/2009/02/new-one-trillion-dollar-bill.html

Endless Stimulus | Payroll Tax Cut

Common Sense vs. Nonsense: Bankrupting the Future –

By: Larry Walker, Jr. –

Facts: The 2% payroll tax cut not only boosted workers’ take-home pay by $120 billion in 2011, but it also widened the government’s budget deficit, and left the social security trust fund in the red.

Since Social Security and Medicare taxes are collected in order to realize future benefits, why would the federal government choose to refund a portion of those collections today? Are its entitlement programs in such good shape that the government can afford to distribute benefits prematurely? I don’t think so. For that would infer that future benefit payouts are on the decline. However, to the dismay of many, in fiscal year 2011 the net cost of social security benefits increased by 18.9%, over fiscal year 2008, while tax collections declined by 13.5%, widening the breach by 1,678%.

Since at least 1975, a growing portion of social welfare spending has been introduced by Congressional tax-writing committees and administered by the Internal Revenue Service. As I outlined in Tax Simplification, Part II, the Earned Income Credit, Child Tax Credit, and Making Work Pay Credit were primarily responsible for IRS administered giveaways of $171 billion in fiscal year 2010, or if you prefer $1.7 trillion over 10 years. In fiscal year 2011 the amount was upped to $231 billion per year, due to the payroll tax cut. And today, some members of Congress are urging others to increase these tax giveaways to $351 billion annually, which I think will end up costing closer to $471 billion (as explained below). But in all of this pandering, what is even more illogical than charging additional debt to Obama’s unlimited credit line, is the rebating of funds “supposedly” earmarked for future liabilities.

As Sherlock and I proved in Social Security: A Breach of Trust, the federal government has summarily confiscated and spent every dime of the $2.6 trillion surplus, which would have comprised the Social Security Trust Fund, and has replaced it with non-marketable, special-issue, Treasury securities. And since these special-issue securities are an asset to the Trust Fund and a liability to the U.S. Treasury, they therefore cancel each other out. In other words, since there is no surplus, every dime of Social Security and Medicare tax collected today is spent today, therefore any shortfall rests squarely on the shoulders of the general budget. And as you may know, the general budget is currently more than $15 trillion in arrears.

When the Making Work Pay Credit expired at the end of 2010, it was replaced with the 2% Payroll Tax Cut, as part of the Tax Relief, Unemployment Insurance Reauthorization and Job Creation Act of 2010. The newest tax gimmick allowed a 2% cut in payroll taxes for employees, which reduced the Social Security Tax from 6.2% to 4.2%, without affecting Social Security benefits. But in the big picture, all it really accomplished was to elevate the amount of social welfare tax expenditures already in the tax code, from $171 billion in 2010, to $231 billion in 2011, or by another $60 billion (see table below).

According to an editorial in Bloomberg-Businessweek, the 2% payroll tax cut boosted workers’ take-home pay by $120 billion in 2011. The editors contend that, “… this should stay in force for another year, be extended to the employer portion of payroll taxes, and increased for both employers and employees to a 3% cut.” And further that, “… the payroll tax cut should be widened to temporarily relieve employers of the entire 6.2% levy for new hires and pay raises.” They conclude their unbalanced argument by stating that, “Republicans should be willing to go along. We are talking about tax cuts, after all, that would pump some $240 billion into a struggling economy.”

So in other words, Bloomberg-Businessweek thinks that annual social welfare tax expenditures of $171 billion in 2010, and $231.3 billion in 2011 were not enough. According to the editor’s, social welfare tax expenditures should be increased to $351.3 billion, and conservatives should be willing to go along, to get along. But stepping back from the easel, to gain some aesthetic distance, the inference appears to be that a 10-year tax expenditure of $1,710 billion wasn’t enough, that $2,313 billion is insufficient, and that $3,513 billion is somehow the magic number (assuming that expenditures for the child tax credit and earned income credit remain fixed). I don’t know any true Conservative, in my neck of the woods, which would go along with blowing a bigger hole in the federal budget than already exists, for any reason; especially not to extend another temporary economic stimulus, some 29 months after the recession officially ended.

Endless Stimulus

These days, it’s as if every time a temporary measure expires, its reversal is deemed to be a tax hike. But the expiration of this one-year, one-time, re-election ploy isn’t a tax hike at all; it’s merely the death of what was probably a bad idea in the first place. If we follow the logic that every temporary measure is permanent, then Obama’s entire 2009 stimulus spending binge must represent the new normal, and any reduction in government spending must be deemed a deviation from the norm, and thus a bad thing. But if not a descent towards Greece, where will this road end? Italy? France? Sheol?

I am not sure how the editor’s of Bloomberg-Businessweek arrived at their $120 billion and $240 billion figures, but let’s assume the former is correct. If so, then it would seem to me that since the cost of the 2% tax cut was estimated to have been $120 billion, that upping the employee payroll tax cut from 2% to 3%, and adding an employer tax cut of 3%, would come to more than double the current giveaway. Simple math leads me to a price tag closer to $360 billion [(120 / .02) * .06], than $240 billion. And that doesn’t include adding the 6.2% tax cut on new hires and pay raises, which would up the ante even more. Other than that little boo-boo, the major omission from Bloomberg-Businessweek’s one-sided endorsement of Barack Obama, because that’s what it is, is that any cut in the Social Security payroll tax translates directly into an increase in the budget deficit, and by extension, the national debt.

The following table was extracted from the Social Security Administration’s Consolidated Statements of Changes in Net Position for the Years Ended September 30, 2008 through 2011. If you wish, you may view the actual financial statements by following the links provided at the end of this post. After navigating this rather murky tome, the bottom line, exclusive of appropriations and interest payments derived from the general fund, may be summarized as follows:

The total amount of tax revenues collected dropped from $671.2 billion in fiscal year 2008, to $580.9 billion in fiscal year 2011, or by $90.3 billion. And the total cost of operations jumped to $782.7 billion in fiscal year 2011, from $658.4 billion in fiscal year 2008, or by $124.3 billion. In a nutshell, the fiscal year 2008 annual surplus of $12.8 billion has been transformed into a $201.8 billion annual deficit in just three fiscal years. In fact, expenditures have exceeded revenues by $370.9 billion over the past three fiscal years.

In other words, social security tax revenues have fallen by 13.5%, since 2008, while operating costs have risen by 18.9%. Another way of stating this is that the shortfall in Social Security tax collections, versus expenditures, has widened by 1,678%. This is significant because any shortfall, whether covered by interest on the debt or appropriations, must be siphoned directly from the general budget. In effect, these annual deficits have increased the national debt, while simultaneously compromising the future of our troubled entitlement programs.

Following the wisdom of Bloomberg-Businessweek, and implementing this fraction of Obama’s misnamed American Jobs Act, would add another $120 to $240 billion to what is already a $201.8 billion deficit on the Social Security Administration’s account. The idea of a payroll tax cut is not a bad one in and of itself, for a nation where the net cost of social benefits is on the decline, however under the circumstances, which some of us refer to as reality, it is probably the dumbest idea proffered by the Obama Administration to-date (although that’s pretty much a tossup).

Personally, I can do without the 2% payroll tax cut, since it has done nothing to increase my personal consumption, has accelerated the national debt, and has compromised the future of Social Security. No. I’m not on the band wagon with those harping for more social insurance rebates. Nor am I opposed to a surtax on those making more than $1 million per year, as long as it’s accompanied by a greater amount in spending cuts. What good is an equal increase in both spending and taxes? And what government-manufactured problem would a tax cut for some, and a tax hike on others solve? I say, ‘no good’, and ‘none’. As far as I’m concerned, anyone who votes for either keeping or increasing the payroll tax cut, under any circumstance, short of a 10-fold cut in spending, is an idiot. And anyone against raising taxes on taxable incomes greater than $1 million per year, in exchange for a 10-fold reduction in spending, is devoid of common sense.

References:

Social Security Administration 2011 Financial Statements – http://ssa.gov/finance/2011/Financial%20Statements.pdf

Social Security Administration 2010 Financial Statements – http://ssa.gov/finance/2010/Financial%20Statements.pdf

Social Security Administration 2009 Financial Statements – http://ssa.gov/finance/2009/Financial%20Statements.pdf