*“Mene, Mene, Tekel u-Pharsin” ~ Book of Daniel, Ch. 5 *
* By: Larry Walker, Jr. *
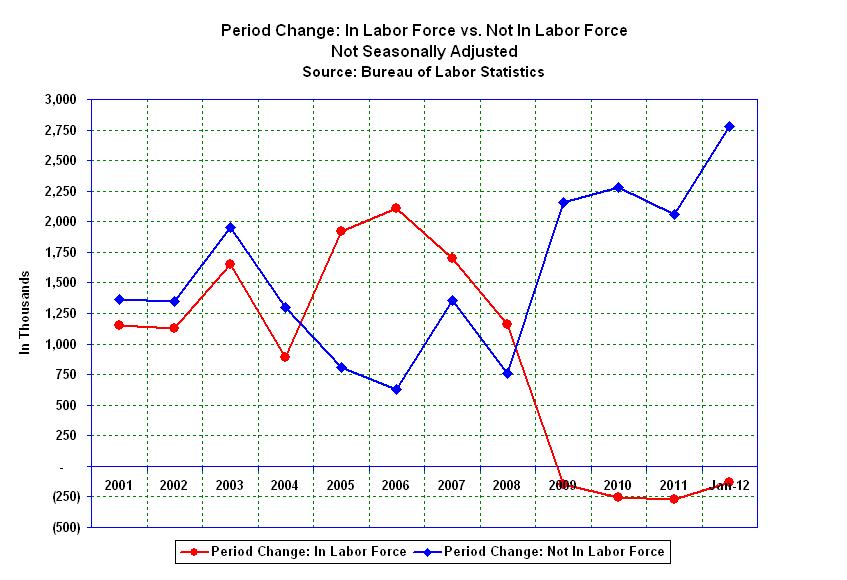
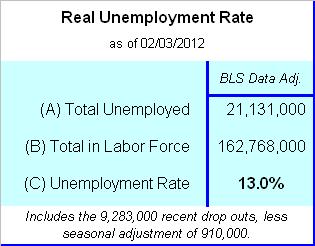
The writing’s on the wall! The massive decline of new entrants to the civilian labor force, which is shown graphically in the chart above, directly impacts the unemployment rate, making the employment situation appear far better than it actually is. If the 9.3 million workers who have effectively dropped out of the labor force, since the end of 2008, were instead of being excluded, counted as unemployed, the real unemployment rate would be 13.0% instead of yesterday’s published rate of 8.3%. Even if only 55.0% of those who have been incontestably and wrongfully removed from the labor force were counted, which would be consistent with the eight-year average prior to Obama, the real unemployment rate would be 10.9%, not 8.3%. Never before in history has there been a more blatant manipulation of official labor statistics.
Those focusing all their attention on the number of jobs created in recent months are focusing on the wrong data. Lest we forget, the Bureau of Labor Statistics includes in its definition of the word employed – “persons 16 years and over in the civilian non-institutional population who, during the reference week, did any work at all (at least 1 hour) as paid employees.” So for all we know, a huge portion of those 200K and some odd jobs, allegedly created last month, were people hired for one hour, paid with taxpayer subsidized grants or loans, and working to register democrat voters in an effort to guarantee another round of Obamanomics. You laugh!
While we do need to watch out for the above, we really need to focus on the number of persons who have been summarily deleted from the labor force over the past three years. According the Bureau of Labor Statistics, the civilian labor force declined by 802,000 over this period. And even worse, another 8,481,000 new entrants, the majority of whom would normally have entered the labor force, are unaccounted for. So where are they? The Great Recession officially ended in June of 2009, yet 9.3 million Americans have gone missing over the past three years and one month. Thus, the question is, are they really missing, or has someone manipulated the unemployment rate in an effort to improve Obama’s chances for re-election?
The dilemma posed by a declining labor force is that as the civilian non-institutional population continues to grow by approximately 1.0% each year, millions of potential workers are forced out of the market. In other words, if there are not enough jobs for the existing workforce, then there are no jobs at all for the approximately 2 million new entrants who come into the job market each year. The devastating result is that a smaller proportion of the populace is working today, to support a much larger cluster of retirees, the unemployed, and those who are otherwise unaccounted for.
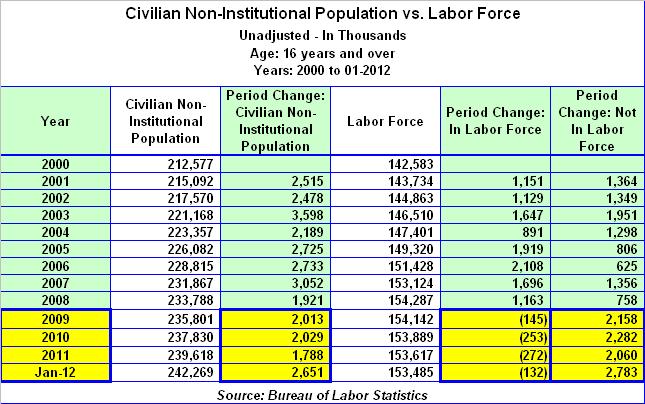
As you can see in the table above, according to the Bureau of Labor Statistics (Table A-1, not seasonally adjusted), the labor force grew from 142,583,000 at the end of the year 2000, to 154,287,000 by the end of 2008, for an increase of 11,704,000 workers over the eight-year period immediately preceding Obama. As such, the labor force was expanding by an average of 1,463,000 new entrants per year, for the eight years prior to 2009.
But from the beginning of 2009 through the end of 2011, the labor force declined from 154,287,000 to 153,617,000. Thus, after three consecutive years of Obamanomics, the labor force declined by a total of 670,000, for an average loss of 223,333 workers per year. The table has been extended through January of 2012, and as you can see, the labor force continued to decline by another 132,000 in January of 2012, as the number of workers fell from 153,617,000 to 153,485,000. Thus, a total of 802,000 have left the labor force since the end of 2008.
So it may be said that Obamanomics has caused the labor force, which should be expanding each year by a multiple of the increase in civilian non-institutional population, to instead be slashed by a total of 802,000 workers in just 37 month’s. This would be bad enough in and of itself; however if we are to believe the Bureau of Labor Statistics, from a macro view, the real employment situation is far worse.
When Obama’s declining labor force is compared with the growth of the civilian non-institutional population, also shown in the table above, we can see that a total of 9.3 million Americans have effectively been removed from the labor force during the last three years and one month (add together the amounts highlighted in the lower right-hand corner). This is the difference between periodic changes in the civilian non-institutional population (the 3rd column from the left), minus periodic changes in the labor force (the 2nd column from the right). It represents the periodic increase in the civilian working age population, which has been unfortunately added to the ranks of those counted as not in the labor force. And as we pointed out previously, a total of 6.5 million workers were removed in the three year period ending with 2011.
To be specific:
-
In 2009, the civilian non-institutional population grew by 2,013,000, yet the labor force declined by 145,000, resulting in an increase of 2,158,000 persons counted as not part of the labor force. In other words, 2.1 million workers went missing in action (MIA).
-
In 2010, the civilian non-institutional population grew by 2,029,000, yet the labor force continued to decline by another 253,000, resulting in an additional 2,282,000 counted as not in the labor force. That’s another 2.3 million MIA’s.
-
Then in 2011, the civilian non-institutional population again grew, this time by 1,788,000, yet the labor force declined by another 272,000, resulting in 2,060,000 more persons counted as not part of the labor force. This resulted in another 2.1 million MIA’s.
-
To top things off, in the first month of 2012, the civilian non-institutional population grew by an additional 2,651,000, yet the labor force further declined by 132,000, resulting in an additional 2,783,000 persons counted as not part of the labor force. Although January data is, as always, affected by changes in population controls, nevertheless it is what it is. Thus another 2.8 million Americans went MIA.
In effect, there have been no new entrants to the labor force in the past three years and one month, as 802,000 existing workers have dropped out of the workforce, and all 8,481,000 potential new entrants have fallen by the wayside. In all, that’s a total of 9.3 million workers who have effectively been pushed out of the labor force. For those paying attention, that’s a total of 8,373,000 persons who are not included in yesterday’s official unemployment calculation (9,283,000 less a seasonal adjustment of 910,000).
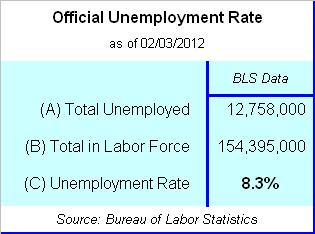
According to the Bureau of Labor Statistics, the official unemployment rate through January 2012 is 8.3%, as calculated in the table below, where:
[ (A) Total Unemployed / (B) Labor Force = (C) Unemployment Rate ]
However, if we were to add back the 8,373,000 workers who have effectively dropped out of the labor force, during Obama’s reign of misery, the real unemployment rate would be 13.0%, as calculated in the following table.
Even if only 55.0% of those who have been incontestably and wrongfully removed from the labor force were counted, which would be consistent with the eight-year average prior to Obama, the real unemployment rate would be 10.9%, not 8.3%. Eventually the majority of these 9.3 million working age Americans will start looking for work, and if upon entering the labor force, they are unable to find gainful employment, the unemployment rate should begin to rise towards its true rate, which would be between 10.9% and 13.0%, as stated.
Conclusion: In going all the way back to the year 1929, besides the years 2009, 2010, 2011, and potentially 2012, the only other years that the United States has ever suffered annual declines in its civilian labor force were 1943, 1944, 1945, and 1951. And as far as the 6.5 million who dropped out of the labor force entirely, over the past three years (not including 2012), that represents the worst consecutive 36 month period in United States history, also dating back to 1929. Since we are not presently engaged in a World War, with millions being drafted out of the civilian workforce, and with millions being killed in action, isn’t this proof positive that the unemployment rate is being manipulated?
Based upon the facts, the Great Recession never really ended, and the unemployment rate has been manipulated. I am 99.9% certain that the Obama Administration is playing with unemployment.
Prerequisites: Manipulation 101: The Real Unemployment Rate
** Updated on 2/7/2012 & 2/10/2012!

Pingback: The Malaise of 2012 | Part III | Black and Center
Pingback: The Malaise of 2012 | Part I | Black and Center
Pingback: War on Wealth, Part II | Keeping Our Foot on the Gas | Black and Center