Real Per Capita GDP Declines on Obama’s Watch

slacker

~ By: Larry Walker, Jr. ~

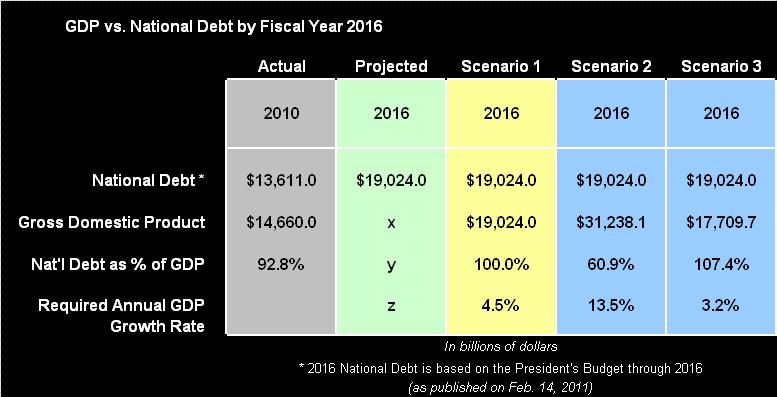
According to the latest report from the Bureau of Economic Analysis, real gross domestic product increased at an annual rate of 1.8% in the first quarter of 2011. But by now most of us understand that this is merely calculated by measuring an increase of roughly 0.45 percent from the fourth quarter of 2010 to the first quarter of 2011, and then multiplying the result by four (.045 * 4 = 1.8). That’s all well and good, but it doesn’t necessarily tell us the truth. What most of us really want to know is the annual rate of GDP growth since Obama’s policies were implemented, and how that compares to the previous administration. To arrive at the answer, one must first measure the annual rate of GDP growth from the time Obama took ownership of the economy, and then compare this to the previous rate. In terms of real (i.e. inflation-adjusted) per capita (i.e. population-adjusted) GDP, the U.S. economy has declined at an annual rate of -0.29% since 2008, as compared to an annual growth rate of 1.15% during the eight-years prior. That’s a decline of 396.5% for the mathematically inclined.

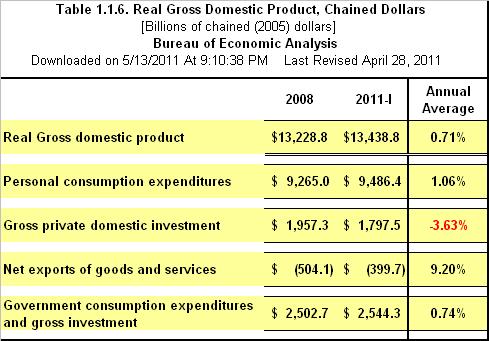
Real Gross Domestic Product: 2009 through 2011-1

The table below shows that real GDP grew at an annual rate of 0.71% from the end of 2008 through the first quarter of 2011. During the same period, personal consumption increased at an annual rate of 1.06%, private investment declined at an annual rate of -3.63%, net exports increased at an annual rate 9.2%, and government consumption increased at an annual rate of 0.74%.

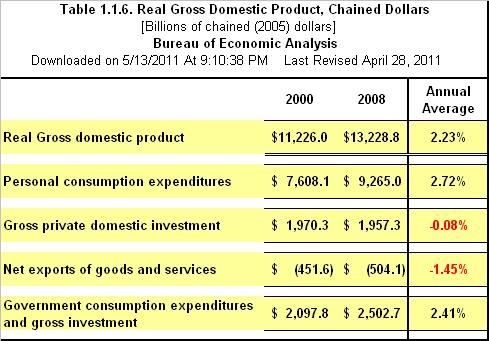
Real Gross Domestic Product: 2001 through 2008

As the next table reveals, real GDP grew at an annual rate of 2.23% from the end of 2000 through 2008. During the same period, personal consumption increased at an annual rate of 2.72%, private investment declined at an annual rate of -0.08%, net exports declined at an annual rate -1.45%, and government consumption increased at an annual rate of 2.41%.

Definitions and Comparisons

Real Gross Domestic Product (GDP)

Gross Domestic Product is comprised of four components, personal consumption, gross private investment, government expenditures, and net exports [GDP = C + I + G + (X – M)]. Under Obama’s policies, real GDP has grown at an annual rate of 0.71% as compared to an annual rate of 2.23% during the previous eight-year period. In other words, GDP grew 214.1% faster in the eight-years before Obama. During the previous administration, an annual growth rate of 2.23% wasn’t bad considering the economy went through one of the worst recessions since the Great One. So exactly how can an annual growth rate of 0.71% be called a recovery? Now let’s compare all four components of GDP.

Personal Consumption (C)

Personal consumption is the largest component of GDP. Personal expenditures fall under one of the following categories: durable goods, non-durable goods, and services. For example, expenditures on rent, food, clothing, tobacco, alcohol, jewelry, gasoline, computers, cellular phones, and medical expenses are included, while the purchase of a new home is not. Real personal consumption is currently slumping along at an annual growth rate of 1.06% versus 2.72% before Obama. In other words, personal consumption was growing 156.6% faster before Obama’s fundamental transformation. All of the federal governments deficit-financed spending on unemployment benefits and food stamps doesn’t appear to be doing the trick after all.

Gross Private Investment (I)

Gross private investment includes business investments such as construction of new facilities, purchases of software, and purchases of machinery and equipment. Personal spending on new homes is also included. Real gross private investment has declined at an annual rate of -3.63% under Obama’s leadership, versus a marginal decline of -0.08% previously. In other words, real gross private investment has slowed by -4,437.5% since Obama implemented his vision for America. What does that tell you? It tells me that the business community lacks confidence in the direction our nation is heading. For example, Obama’s policies of hindering new oil drilling, and seeking to end tax deductions which encourage expansion of the U.S. oil and gas industry won’t exactly translate into any improvement in private investment for the near future.

Government Consumption Expenditures and Gross Investment (G)

Government spending is the sum of government expenditures on final goods and services such as salaries of public servants, purchases of weapons for the military, and any investment expenditure by the federal, and state or local governments. It does not include transfer payments, such as social security, welfare, food stamps or unemployment benefits. Real government consumption is presently growing at an annual rate of 0.74% as compared to an annual rate of 2.41% before Obama. In other words, although the Obama administration has added almost as much to the national debt in the last two-and-a-quarter years as was added in the previous eight, government spending under the previous administration actually added 225.7% more towards economic growth. Perhaps it’s not how much government spends, but rather what it buys. The numbers don’t lie. It’s clear that Obama’s idea of government investment is not the kind that adds anything to our economy.

Net Exports (X – M)

Net exports are the difference between gross exports (what our nation produces in goods and services for other nations’ consumption), and gross imports (what our nation purchases in goods and services from other nations). Imports are subtracted from exports since imported goods are already included in C, I, and G. The only component of GDP with a more favorable result under Obama’s policies is real net exports, which is growing at an annual rate of 9.2% versus a decline of -1.45% in the previous eight years. However, this grand improvement has only added $104.4 billion to real GDP, representing just 0.78% of the total.
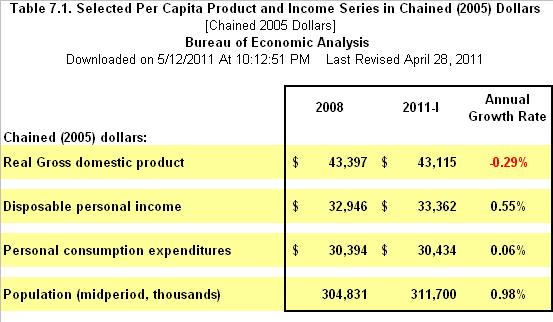
Real Per Capita GDP

Of course the best measurement of GDP is found in real per capita results, after all the economy is not static. The effects of population growth combined with inflation can weigh heavily on the economy. The U.S. population has continued to grow at an annual rate of 1.0% since 2000; meanwhile inflation has grown from nearly 0.00% to 3.16% since January of 2009. So let’s see how this combination has affected GDP, disposable personal income, and personal consumption.

As you can see in the tables below, real per capita GDP has declined at an annual rate of -0.29% under Obama’s policies, compared to an annual growth rate of 1.15% in the 8-years prior. Secondly, real per capita disposable personal income has grown at an annual rate of 0.55% versus 1.75% under the previous administration. Finally, real per capita personal consumption has grown at an annual rate of 0.06% versus an annual rate of 1.60% previously. Yet they call this a recovery.

To summarize, real per capita GDP is presently declining at an annual rate of -0.29% versus a positive growth rate of 1.15% under the previous administration. Would you call this an economic expansion? Not hardly. So what’s wrong with the present administration? It acts like it has accomplished something by putting more Americans on unemployment, welfare, and food stamps than ever. It acts like it won’t be satisfied until the last U.S. oil company is run out of business, or until every last local bank, Wal-Mart or McDonald’s franchise is shut down. What will real per capita GDP look like if Obama’s policies are allowed to continue? It’s time to get serious about the matter of peaceful domestic regime change. It’s time for this slacker and his court jesters to go.

Note: Chained-dollar estimates can be used to compute “real” (i.e. inflation-adjusted) rates of growth. However, comparisons of two or more different chained-dollar series must be made with caution, because the prices used as weights in the chained-dollar calculations usually differ from the prices in the reference period, and the resulting chained-dollar values for detailed GDP components usually do not sum to the chained-dollar estimate of GDP or to any intermediate aggregate. In other words, the columns in chained-dollar GDP component columns do not necessarily add up to total GDP, due to rounding differences.

References:

Gross Domestic Product, 1st quarter 2011 (advance estimate)

Bureau of Economic Analysis, Table 1.1.6, Real Gross Domestic Product, Chained Dollars

Bureau of Economic Analysis, Table 7.1, Selected Per Capita Product and Income Series

Inflation reaches 3.16% in April

Payroll Tax Cut Forsakes the Poor

None and Done

Obama’s Phantom Tax Cut

– By: Larry Walker, Jr. –

When Barack Obama signed what was touted by the mainstream media as the middle-class cut bill on December 17, 2010, it was praised as a historic measure which would extend tax cuts for families at every income level, renew jobless benefits for the long-term unemployed and enact a new one-year cut in Social Security taxes that would benefit nearly every worker who earns a wage.

But first of all, extending last year’s tax rates actually didn’t do anything for anybody (i.e. nothing gained, nothing lost). Secondly, renewing jobless benefits for the long-term unemployed was simply the price we had to pay for a failed $887 billion economic stimulus program. Thirdly, and to the point of this blog post, as far as the one-year cut in Social Security taxes, exactly what does the term “nearly every worker” mean?

Well, just two months after its enactment, tens of thousands of American’s are beginning to find out. Many are noticing that their paychecks are actually smaller than they were last year, while others are seeing just an extra dollar or two per month. In fact, the only ones actually receiving the full 2% payroll tax cut are those making over $70,000 per year. Those making under $20,000 per year are actually ingesting a tax hike.

In an effort to determine why so many folks are complaining, we compared Internal Revenue Service Publication 15, (Circular E) Employer’s Tax Guide, for tax year 2010 to the 2011 publication. Then we created a spreadsheet to compare the differences. What we discovered is that in 2010 the amount of federal income tax withheld from paychecks was lowered, to compensate for the $400 Make Work Pay Credit. But with the expiration of the credit at the end of 2010, income tax withholding tables have been readjusted back to pre-stimulus levels. This adjustment in income tax withholding rates has completely negated the Social Security tax cut for the poor, and greatly reduced its effect on those with moderate incomes.

On its face, the new law lowers the amount of Social Security tax withheld from all paychecks from 6.2% to 4.2%, however not all paychecks are affected equally. Had this tax cut been implemented on its own, it would have been a good thing for all wage earners; however due to the corresponding expiration of the Make Work Pay Credit, the end result favors those making over $70,000 per year, and discriminates against those who earn less. The word on the street is that Obama’s 2% Social Security tax cut is just one more in a series of lies emanating from the White House. If we could impeach a POTUS for lying (or ignorance), Obama would have been impeached 10 times over.

The following calculations are based on the IRS’s monthly percentage method tables for single taxpayers (Table 4). If you’re not convinced, you may always visit www.irs.gov, search for Publication 15, and make your own assessment. But if you don’t want to go through all of that trouble, you can simply compare your latest payroll tax report, or pay stub, to one from last year.

As the table above displays, rather than receiving a tax cut, those making $15,000 per year, or less, are actually receiving at least a 0.68% payroll tax hike. Although this may not have been the Democrat’s intent, this is what he delivered.

According to the table above, those making exactly $20,000 per year are receiving a mere 0.08% tax cut. Wow, that’s a whole $1.13 in tax savings each and every month, leaving many on Main Street in shock and awe. Since those making under $20,000 all got a tax hike, those whose lives have been improved by a buck a month must be so proud of their Democrat saviors.

The next table (above) reveals that although those making $30,000 per year received a bona fide tax cut, it is effectively only 0.88%, or $17.80 per month. I suppose $17.80 per month, which equals $213.60 per year, will have some impact on the economy, but not likely much.

The table above shows that those making $40,000 per year are receiving a 1.48% tax cut. Although it’s not a full 2.0%, the extra $39.07 per month can at least be banked, or perhaps donated to the poor and needy.

As the table above exhibits, those making $50,000 per year are receiving a 1.74% tax cut. Now we’re talking real money, a whole $55.73 per month, although perhaps this would have been more appropriately directed toward those making less than $20,000.

The table above affirms that those making $60,000 per year are now taking home a 1.92% tax cut. It’s getting there, although it’s not quite 2%, an extra $72.40 per month can at least buy some extra food, or pay a bill. Then again, if you’re lucky enough to still have a job paying $60,000 per year under the present regime, how important is an extra $72.40 per month?

Finally as exposed in the last table (above), those making $70,000 per year are picking up the full 2% tax cut and then some (actually 2.15%), a savings of $92.89 per month. The percentage of taxes saved tops out at about the 2% level with the monthly dollar amount continuing to advance up to the $106,800 cap on Social Security wages.

In conclusion, those who needed a diminutive tax cut the least are receiving it the most. It all goes to show that in spite of a far left-wing progressive like Obama, “The rich keep on getting richer while the poor get poorer.” While other countries like China directed payroll tax cuts toward employers, you know, the ones who can actually provide jobs and a real boost to an economy, Obama has blown his 3rd and final chance to get it right. Three strikes and you’re out! Perhaps our next POTUS will be one who not only takes the time to read the bills presented for signature, but one who is actually capable of understanding cause and effect. Obviously, the present White House occupant is a wash. Obama is ‘one and done’, but in terms of American jobs, this could be more effectively expressed as ‘none and done’.

References:

Blindsided | White House Fiscal Lunacy

Back in the Ditch

2016 GDP vs. National Debt

– By: Larry Walker, Jr. –

We will not be adding more to the national debt.” ~ Barack Obama ~

Say what? You must mean that you will not be adding more to your national debt, because I know that I certainly won’t be adding to the national debt, so you need to take the we out of that statement buddy. The real question is how are you going to pay back the trillions of dollars that you have already squandered? And here’s another riddle – What will the U.S.A.’s gross domestic product (GDP) need grow to by the year 2016 in order to keep pace with the present White House occupant’s irrationally exuberant spending spree? And based on the answer to that question, at what annual rate must our economy grow?

If we add the inexperienced CEO’s 2011 to 2016 projected annual budget deficits to fiscal year 2010’s ending national debt balance of $13.6 trillion, then the national debt will equal $19.0 trillion by the year 2016. And you call that “not adding more to the national debt”? So is this guy a pathological liar, or what?

At the end of 2010, the Bureau of Economic Analysis (BEA) reported that gross domestic product (GDP) for the year was $14.6 trillion. So depending on the rate of economic growth over the next 6 years, the national debt may sooner or later exceed GDP. Although even the present White House occupant once stated that the national debt is unsustainable, the question is – as juxtaposed to what? If we take a look back to the days when our debt was sustainable, when the economy was growing at roughly 5% per year with low unemployment, such as in 2003, we will discover that the debt-to-GDP ratio back then was 60.9%. So the question is what do we need to do in order to reduce our debt-to-GDP ratio from its present level of 92.8% back down to 60.9%?

In Scenario #1 (below) we will determine the rate of economic growth necessary in order for GDP to equal our projected debt by the year 2016. In Scenario #2 we will discover the rate of economic growth needed to return to a more healthy debt-to-GDP ratio of 60.9%. Finally, in Scenario #3 we reveal what the debt-to-GDP ratio will be by 2016 if GDP maintains its present growth rate of 3.2% per annum.

Scenario #1 – The budget to nowhere

Gross domestic product must grow from $14.6 to $19.0 trillion in order to equal the National Debt by 2016. In other words, GDP must maintain an average sustained growth rate of 4.5% per year, over the next 6 years, in order to achieve a debt-to-GDP ratio of 100%. This represents ‘the budget to nowhere’. Although, the Bureau of Economic Analysis reports that GDP grew at the rate of 3.2% in the 4th quarter of 2010, as you can deduce, this will not be sufficient to reach the current White House occupant’s pitiful goal of a 100% debt-to-GDP ratio.

Scenario #2 – Back to sanity

In order to return to the more prosperous 2003 debt-to-GDP ratio of 60.9%, GDP must grow at a sustained annual rate of 13.5% over the next 6 years. How likely is this? In order to achieve such a rate of growth, our economy would need to expand at the pace of an emerging market economy, a feat which is hardly doable. This is precisely why the Debt Commission recently stated that we will never grow our way out of this fiscal disaster.

Scenario #3 – Your new reality

Finally, if GDP maintains the present annual growth rate of 3.2%, then our debt-to-GDP ratio will have reached 107.4% by 2016. Welcome to reality, and to a future of bonded labor. This doesn’t look like winning the future to me, it looks more like a donkey in a quagmire.

Conclusion

The present White House occupant’s budget plan leads to disaster. What most of us wanted to hear was a plan for paying off the debt which he alone has run up over the last two years, not more debt evasion. Face it, there is only one way out of this mess. The first thing we need to do is to derail all of this administration’s reckless spending initiatives. Secondly, government spending must be cut, slashed, and cut again. And finally, we must get this fiscally bankrupt pathological liar out of the White House, by any means necessary. By any means necessary. And as far as who will be the next POTUS; throw a dart. While I am not certain about who it will be, I definitely know who will be packing up at the end of 2012, if not sooner.

Sources:

http://www.whitehouse.gov/sites/default/files/omb/budget/fy2012/assets/hist01z1.xls

http://www.bea.gov/newsreleases/national/gdp/2011/xls/gdp4q10_adv.xls

http://www.treasurydirect.gov/NP/NPGateway

Obama: The Era of Flimflam Economics, Part III

Transformation

Jobs Inheritance Mantra

By: Larry Walker, Jr.

Every time I turn on the news I hear the same sob story, whether it’s Obama, Geithner, Biden, Pelosi, Reid, a left-wing congressperson, or some low level administration official, they all repeat the same Democrat mantra (give or take a few thousand Americans), “We inherited an economy that was losing 700,000 jobs a month.” “We inherited an economy that was losing 750,000 jobs a month.” “We inherited an economy that was losing 800,000 jobs a month.” “Aum – Bush bad, Obama good”. I’m so sick of it that I decided to pull the Bureau of Labor Statistics historical archive to see for myself. Where did they come up with these numbers? Why does it keep growing? Does anyone ever refute the bull…, excuse me, lies? And better still, who cares?

Based on the facts, unemployment didn’t really fall off a cliff until Obama won the election, in November of 2008. That’s when everything went to hell in a hand basket. And where are we today? Other than a few gains in March, April and May of 2010, in large part due to the hiring of around 500,000 temporary census workers, there’s not much to be proud of. The unemployment rate stood at 9.5%, last month, essentially the same as it was in May of 2009. So much for the “Recovery Summer”.

The truth is that in September of 2008 the economy lost (-159,000) jobs which was 89% worse than the previous month’s loss of (-84,000). Then in October of 2008 we lost (-240,000) jobs which was 51% worse than September. Then once Obama was elected, in November 2008, we lost (-533,000) jobs, an increase of 122% over October, and then we lost another (-524,000) in December. Was it just a coincidence that the economy fell off a cliff as soon as Obama won the election? I think not.

The greatest declines in employment occurred as soon as Obama won the election (and really as soon as took the lead in the polls).

August 2008 -84,000

September 2008 -159,000

October 2008 -240,000

—————————-

November 2008 -533,000

December 2008 -524,000

January 2009 -598,000

February 2009 -651,000

March 2009 -663,000

April 2009 -539,000

May 2009 -345,000

June 2009 -467,000

I’m sorry, but I don’t see where Obama inherited an economy that was losing 700,000 to 800,000 jobs per month. Sorry, but the facts don’t support the mantra. The sad truth is that once Obama won the election it was his questionable – identity, qualifications, philosophy, intentions and relations that did the greatest harm to the economy. And even if it turns out to be true, who cares. Who needs a leader who’s constantly making excuses?

I don’t remember President G. W. Bush, or President R. W. Reagan ever complaining about what they inherited from the previous administration, they just did their jobs, gave us some relief through tax cuts, and then things turned around. Somebody needs to stop whining, chanting, and making up numbers – and just do their jobs. Cut taxes, cut spending, then sit down and shut up. If you can’t handle that, then resign.

You may review the archived Employment Situation Reports available from the Bureau of Labor Statistics and decide for yourself.

If you’re not part of the solution, you’re part of the problem. And if all you can do is make excuses, then you’re not part of the solution.

[Revised on 9/5/2010 – Chopped down to emphasize the point about: Who cares? Stop making excuses and deal with reality. Obama was a threat to the economy long before his official election date, and people simply cut their losses and fled as he came into power. Things will get better the day he leaves office.]

Obama: The Era of Flimflam Economics, Part II

Too Much Stimulus

Untimely and Proven to Fail

By: Larry Walker, Jr.

Near the end of 2007, prominent economists began advising the federal government that the economy was heading into a recession. They also mistakenly advised that the recession could be avoided if the government were able to implement some kind of economic stimulus program. In order to work successfully, such a stimulus needed to be large, targeted, and timely. Tax refund checks needed to reach taxpayers in a matter of weeks not months. Economists must have forgotten that they were dealing with the federal government.

Recessions are a normal part of the business cycle. The U.S. has averaged a recession about once every five years since WWII. Although economists have gotten better at predicting business cycles, it’s fairly clear that no one has ever been able to sidestep a recession. Avoiding a recession is like trying to stop an oncoming hurricane, when you see it coming you get out of the way, wait for the storm to subside, and then focus on recovery.

An economic stimulus package was proposed in January of 2008, in order to avert the recession. Although a similar stimulus plan had been attempted in 2001, and failed to prevent a recession, Congress was compelled to it try again. By the time the checks reached taxpayers, in April of 2008, it was too late, the recession had commenced.

In February of 2009 President Obama enacted a second stimulus plan. What was that about? Was he trying to prevent something that had already occurred? The Obama stimulus plan occurred more than a year after it was originally called for. By the time Congress passed Obama’s stimulus plan, the economy was well in the midst of recession. The only purpose of an economic stimulus is to avert a recession. Once an economy is in recession, a whole new set of policies is required. As of this month, around nineteen months after Obama’s first failed stimulus program, and nearly 2 1/2 years after Bush’s tardy attempt, Obama is still talking about a stimulus plan. Isn’t this just economic flimflam?

It should be obvious by now that stimulus programs don’t work in the real world. Although the classroom theory is plausible, the federal government is not an efficient vehicle for carrying one out. What should also be obvious is the type of recovery policies that work, once a recession has occurred. The 2003 Bush Tax Cuts and the 1983 Reagan Tax Cuts were effective tools in creating economic expansions following severe recessions.

If the goal is to grow the economy, create jobs, and increase tax revenues, then tax cuts are the way to go. However, if the goal is to flush trillions of borrowed dollars down the drain by attempting something that’s untimely and proven to fail, then maybe that’s Obama’s fate. Obama’s first stimulus plan was untimely and proven to fail, a kind of Flimflam Economics. And even today, he is talking about another economic stimulus program. Again, is Obama trying to prevent something which has already occurred? Does Obama really have the best interests of America at heart?

Stimulus: The Need for Speed

In a January 20, 2008 Dow Jones News article entitled, “The Need for Speed”, it was stated that, “A plan out of Washington to stimulate the flagging US economy may be a day late, but it certainly isn’t a dollar short.” Two days earlier, President George W. Bush called for fast tax relief for individuals and tax incentives for businesses that would total up to $150 billion.

Economists said that would be enough of a jolt to have a notable impact on growth, if done right and quickly. Bush said the tax relief for consumers could be a “shot in the arm to keep a fundamentally strong economy healthy.” Bush’s rough draft proposal highlighted the US economy’s big problem: the consumer.

“Americans could use this money as they see fit: to help meet their monthly bills, cover higher costs at the gas pump or pay for other basic necessities,” the president said.

Bush wasted no time announcing the rescue plan after getting a firm nod of approval Thursday from the country’s pre-eminent economic policymaker, Fed Chairman Ben Bernanke. The central bank chief said he would approve of such a fiscal stimulus plan so long as it was “timely” and implemented “decisively” and “quickly.”

The need for speed in such a plan is no doubt important, as Bernanke pointed out Thursday. If Congress dilly-dallies on the matter, rebate checks may not arrive to consumers in time to fortify the weak economic growth that is likely to continue throughout 2008.

Lakshman Achuthan, managing director of the Economic Cycle Research Institute in New York, said the fiscal plan essentially calls for “throwing a ‘money wrench’ into the system.” That plan, he said, can be successful, but he said rebate checks need to start arriving in “the next few weeks.”

Democrat Congress Drags Feet

Now scroll forward to a March 21, 2008, Financial Week article entitled, “U.S. can’t avoid recession, says influential forecaster”. The subtitle reads, “Economic Cycle Research Institute claims economy ‘on a recessionary course’; blames Congress for tardy rebate checks.”

Mr. Achuthan argued that this recession could have been averted had Congress considered “innovative ways” to get tax rebates into consumers’ hands sooner. (The rebates still have not begun to reach taxpayers). “Following a presidential initiative, Congress passed a tax rebate package with unusual speed, as officials noted that time was of the essence,” he wrote, “but they were content to let the rebates start reaching consumers several months later.”

Choosing Recession

Moving forward to an April 21, 2008, Forbes article entitled, “Choosing Recession”, Lakshman Achuthan and Anirvan Banerji stated, “This recession was actually avoidable as recently as several weeks ago.” They added, “The 2008 recession guarantees many months of job losses that will boost foreclosures and feed the credit crisis. But if fiscal stimulus had reached consumers quickly, it would have forestalled a recession, helping to stabilize the housing market. Such a soft landing would have bought some breathing room in which to resolve the credit crisis until the lagged effect of monetary policy kicked in.”

They continued, “Policy makers seemed to get the urgency. In January, Treasury Secretary Hank Paulson declared that “time is of the essence.” House Speaker Nancy Pelosi spoke of “timely, targeted and temporary” stimulus, and the administration and Congress enacted a tax rebate package with exemplary speed. The fatal flaw was their willingness to allow a delayed delivery of the stimulus. It was as if the medics had arrived and taken a quick decision to administer CPR–but in a few months rather than a few seconds.”

Stimulus Arrives Late

Later, an April 28, 2008 report on CNN Money summed it up, in an article entitled, “U.S. can’t avoid recession, says influential forecaster”. Tax rebates had started to arrive in bank accounts. But many economists we’re doubtful that they would keep the economy from recession. The stimulus package was to give rebates to about 130 million Americans, at a cost of more than $110 billion. Married taxpayers earning $150,000 or less were to receive up to $1,200, while single taxpayers earning under $75,000 would get up to $600. But it was too late.

“This will not avert a recession, because it is too late,” said Lakshman Achuthan, the managing director of the Economic Cycle Research Institute. “For this to have kept us out of what was an avoidable recession, it needed to happen a couple of months ago, in January or February.”

Obama’s Plan: A Year Late and $900 Billion Short

Months later appeared a November 22, 2008 article by NPR entitled, “Obama Offers Plan to Revive Economy“. The author lead with, “President-elect Barack Obama set out plans for an ambitious economic stimulus that would create 2.5 million jobs by January 2011”.

“We’ll put people back to work rebuilding our crumbling roads and bridges, modernizing schools that are failing our children, and building wind farms and solar panels, fuel-efficient cars and the alternative energy technologies that can free us from our dependence on foreign oil and keep our economy competitive in the years ahead,” he said.

In the same November 22, 2008 NPR article, business and economics historian John Steele Gordon stated that, “the New Deal didn’t end the Great Depression, World War II did.” He added that “building bridges and painting schools won’t provide a quick fix.” He was right. The Great Depression lasted from 1929 until 1945, or around 15 years, and it didn’t end through the action of any clever government policy.

According to Liberty Works, the Obama Economic Team promised that stimulus borrowing and spending would create 678,000 new construction jobs by December of 2010. However, by July of 2010, the construction industry had actually lost 862,000 jobs.

Tax Cuts Work

During the 2001 economic recession, the government attempted an economic stimulus in the form of tax rebates (similar to the 2008 rebates), but it likewise failed. Then finally in May of 2003, the Bush tax cuts were enacted. The tax cuts were responsible for the creation of 7.3 million new jobs beginning in August of 2003 and lasting through the end of 2007. Tax cuts are the only proven method for bringing an economy out of recession. The deeper the tax cut, the greater the expansion.

As the website Liberty Works so aptly reminds us, “President Obama and the Democrat Congress have implemented a series of measures that defy the lessons of past recessions”, especially that of 1981, which was by some measures worse than this one.

The chart above shows, “the job market recovery is faltering at best, after 31 months of Bush/Obama policies. There are 8 million fewer Americans now employed than in December, 2007.”

The results in the second chart (above), speak for themselves. “Reagan’s policies turned the job market around after 16 months of losses. The Reagan economy grew continuously for 90 months, creating a total of 21 million new jobs, or a 24% increase in the number of Americans who were employed.”

You’ve Been Flimflammed

If the goal is to grow the economy, create jobs, and increase tax revenues, then tax cuts are the way to go. However, if the goal is something more sinister, then one must brainwash their constituents into believing that ‘tax cuts cause recessions’. The Bush tax cuts brought us through another successful business cycle. Then the housing bubble burst, credit markets froze, and we fell back into recession. But tax cuts didn’t cause the recession. I don’t mind cutting Bush to pieces where warranted, and I was doing just that in 2007/08, but to say that the Bush tax cuts didn’t work because you disagree with his foreign policy is ignorant.

Whether or not the recession could have been avoided is highly doubtful due to the severity of the housing bubble and credit crisis. Yet if you listen closely, a year ago Obama was saying the recession was caused by the ‘lack of affordable health insurance’, and today he’s saying that it was caused by the ‘Bush tax cuts’. I suppose next he’ll be saying the recession was caused by whatever supports the legislation du jour.

It’s sinister enough to take advantage of a crisis in order to pass an unwanted legislative agenda. It’s entirely another matter to purposefully prolong a crisis to the detriment of every American: black, white, red, yellow, and brown; Democrat, Republican, and Independent. In fact, Obama’s looking more and more like another FDR. In FDR’s policies prolonged Depression by 7 years, UCLA economists calculate, you will find the following quote: “We found that a relapse isn’t likely unless lawmakers gum up a recovery with ill-conceived stimulus policies.”

Congress needs to cut spending, and cut taxes, now. If you’re not part of the solution, you’re part of the problem.

Obama: The Era of Flimflam Economics, Part I

Flimflammer in Chief

Economic Flimflam – Deceptive Nonsense

By: Larry Walker, Jr.

Down here on Main Street, while company X is waiting for person Y to pay their past due bill, company X is cutting back on everything it can, and borrowing money to fill the void. When person Y finally gets that stimulus money and pays their debt, company X will use the money to payback what was borrowed. Company X is not aggressively pursuing new business out of fear of attracting more deadbeat customers, but instead is focused on downsizing and preserving trusted relationships. Company X is now practicing sound business policy (i.e. fiscal responsibility). After nearly two years of being flimflammed, we find that demand has not been sparked, and that not one new job has been created.

Theory P – Temporary Stimulus Drives the Economy (False)

Rationale: If we give 150 million taxpayers a $400 annual tax credit for working, they will go out and spend it, which will spark additional demand, which will in turn fuel an economic recovery. Once the demand begins, Joe the widget maker will start getting a flood of calls for his product and will hire new employees, and buy new equipment as he expands his operation. So next we will need to make loans available for small businesses so they can prepare for the massive expansion. Problem solved. Government stimulus works, right? Wrong.

In Reality – When the government gives a $400 annual tax credit to a person who is broke, in debt, behind on bills, about to lose a job, or behind on their rent (or house note), it won’t be spent on anything new. It will be either saved, used to pay a debt, expedited to pay a past due bill, eaten, drank or smoked.

Under theory P, when the federal government gives a little extra money to person Y, person Y will go out and buy a new car, or a new house, or I-Pad, or something to help the economy. One problem is everyone knows that what the government is promoting is just a tiny, temporary fix. Lets get real, it’s not like person Y is going to get an extra $400 per month, which would possibly pay a car note. Instead, person Y is receiving an extra $33.33 per month (money that normally goes towards income taxes), and $33.33 per month doesn’t go very far in 2010 (it’s amazing that millionaire, Washington elitists don’t understand this). The clincher is that a stimulus, by its nature, is only temporary. Sure, tax credits were provided in 2009 and 2010, but will be capped off by a massive tax increase in 2011. The proposed tax increase will likely be at least double the pathetic stimulus.

‘As the government giveth, so the government taketh away.’

The other part of theory P involves making loans available for small businesses. The loans will theoretically be used to keep the doors open, and to meet payroll while small businesses wait on the massive flood of demand that’s sure to come. The only problem is that the demand came and went with the stimulus checks. So company X is reluctant to commit collateral for additional loans (loans that it may not be able to repay). So the government is encouraging small businesses to take the loans anyway. “Take a chance,” they say. “Hire some people, spend some money, add another location, get things moving and surely the demand will come.” In response, businesses have cut back more, and layoffs persist.

Theory C – Permanent Tax Cuts Do Drive the Economy (True)

Rationale: Under this theory taxes are cut permanently, and incentives are provided for business investment. Let’s give person Y an extra $400 per month, permanently, and see what happens. At the same time, let’s give business X a large incentive to invest and expand. What happens?

The Reality – Initially, person Y will pay off any past due bills, but within a few short months may go ahead and purchase that new car, or a new home, or an I-Pad (or two). Company X will begin to see real sustained demand, and will begin to hire and to think about expansion. With more people working, and with multiples of increased demand, the flame will have been kindled, and recovery will have begun. Tax revenues will increase as the economy grows, and as 15 million unemployed begin to become productive members of society.

The Flimflam Guys – Now, in step the flimflam guys (Krugman, Obama, Geithner, Greenspan, Reid, Pelosi and company) claiming that such a huge tax cut will only add to the current budget deficit.

After adding $2.7 trillion to the federal debt over the past two years and achieving nothing, now these geniuses want to complain about the deficit? Shut the hell up. Sorry but we’re not buying it this time. You had your shot and you failed. Those guys that you call the ‘party of no’, you know, the ones who have offered, “Not one new idea,” told you about ‘theory C’ before you flushed our money down the toilet and you mocked them. Now I guess you have to choose between eating crow, and sending the economy into an endless spiral of debt, inflation and higher taxes.

‘If you can’t stand the crow, just add a little more of Krugman’s Flimflam Sauce.’

The smart money’s on Theory C. Tax cuts work, but they will only work, if you cut spending on everything else across the board, and this is exactly what needs to happen. Cut out the wasteful spending, and give us a real tax cut.

2011 Tax Jam: Wrong Way, Wrong Road

Directions for Misguided Democrats

by: Larry Walker, Jr.

In my last blog post, 2011 Tax Increase: A Reality Check, I attempted to point out how the Bush tax cuts applied to all Americans at every level of income, and that with their expiration at the end of 2010, income taxes will rise across the board. Although valid enough to ignite renewed interest, I now want to expand on this in a more technical manner with examples.

The following table compares the pending change in tax rates (assuming no change for inflation).

2010 vs. 2011 Tax Rates

As evident with a quick glance, those in lower income levels will see their taxes increase the most with taxes increasing by 50% (from 10% to 15%), but this doesn’t tell the whole story. Only by looking at effective tax rates, can we see the impact of the pending tax increase on hard working Americans, and small business decision makers. [Note: The effective tax rate is calculated by dividing the amount of taxes paid, by the amount of gross income.]

When it comes to taxes, there are many variables that will effect the calculation of ones effective tax rate, such as filing status, number of children, whether or not one itemizes deductions, and whether one has income from pass-throughs (i.e. Partnerships, and S-Corporations), or from capital gains. So in an effort to keep this somewhat simple, the examples that follow assume a married couple without children, without capital gains, who does not itemize deductions, and whose income is limited to $500,000.

[Note: The following tables place income on the cusp of each tax bracket, and thus were prepared on a ‘give or take a dollar or two’ basis. (You may click on each table to enlarge.)]

2010 Effective Tax Rates

2011 Effective Tax Rates

2011 Marginal Tax and Rate Increases

Example 1 – 10% Bracket: Joe and Jane are married and have combined wages of $35,450.00. In 2010 they will pay income taxes of $1,675 with an effective tax rate of 4.7%. Their 2010 after-tax income is $33,775. In 2011 they will pay income taxes of $2,512.50 with an effective tax rate of 7.1% which represents a tax increase of 50%. Their after tax income in 2011 will fall by $837.50.

Example 2 – 15% Bracket: Lance and Lori are married and have combined income of $86,700.00. In 2010 they will pay income taxes of $9,362.50 with an effective tax rate of 10.8%. Their 2010 after-tax income is $77,337.50. In 2011 they will pay income taxes of $10,200 with an effective tax rate of 11.8% which represents a tax increase of 8.9%. Their after tax income in 2011 will fall by $837.50.

Example 3 – 25% Bracket: Nick and Nancy are married and have combined income of $156,000.00. In 2010 they will pay income taxes of $26,687.50 with an effective tax rate of 17.1%. Their 2010 after-tax income is $129,312.50. In 2011 they will pay income taxes of $29,604.00 with an effective tax rate of 19.0% which represents a tax increase of 10.9%. Their after tax income in 2011 will fall by $2,916.50.

Example 4 – 28% Bracket: Paul and Penny are married and have combined income of $227,950.00. In 2010 they will pay income taxes of $46,833.50 with an effective tax rate of 20.5%. Their 2010 after-tax income is $181,116.50. In 2011 they will pay income taxes of $51,908.50 with an effective tax rate of 22.8% which represents a tax increase of 10.8%. Their after tax income in 2011 will fall by $5,075.00.

Example 5 – 33% Bracket: Ronald and Rhonda are married and have combined wages $392,350.00. In 2010 they will pay income taxes of $101,085.50 with an effective tax rate of 25.8%. Their 2010 after-tax income is $291,264.50. In 2011 they will pay income taxes of $111,092.50 with an effective tax rate of 28.3% which represents a tax increase of 9.9%. Their after tax income in 2011 will fall by $10,007.00.

Example 6 – 35% Bracket: Tom and Tammy are married and have combined income of $518,700.00. In 2010 they will pay income taxes of $145,308.00 with an effective tax rate of 28.0%. Their 2010 after-tax income is $373,392.00. In 2011 they will pay income taxes of $161,127.10 with an effective tax rate of 31.1% which represents a tax increase of 10.9%. Their after tax income in 2011 will fall by $15,819.10.

Does the government deserve 30-40% of your money? From the examples provided, those making over $392,350 will pay between 31.1% up to 39.6% of every additional dollar earned in taxes. This particularly impacts small business owners whose income is taxed at the personal level. It’s hardly worth the effort to expand operations and provide jobs when the government will get 30% to 40% of the paper profits.

All income is not created equal. The federal government should understand that just because a small business has taxable income of $400,000 doesn’t mean that its owner has $400,000 in the bank. Some of that money was used to pay non-deductible principal payments on loans, and some of it is necessary for working capital in order to continue operations. Although the interest paid on loans is deductible for tax purposes, principal repayments are not, so the government really shouldn’t assume that taxable income is the same thing as disposable income.

A tax increase is a tax increase. Those making under $36,000 per year will see the highest tax rate increase of 50%. Although those making between $36,000 and $87,000 will see the smallest increase at potentially 8.9%, a tax increase is a tax increase. For those in the remaining brackets, taxes will increase by approximately 10% to 11%. This is a far cry from Obama’s bold declaration that we would not see our taxes increase by ‘one dime’. Technically it will be more like a dime to fifty cents on the dollar. Yes, income taxes will increase for all who pay taxes, without quick action.

Taxes will rise by a lot more than a dime. When the Bush tax cuts expire at the end of this year, couples making over a nickel and under $500,000 per year, will see their effective income tax rates rise, from between 8.9% to 50.0%. Lower income wage earners face the largest increase. Couples with income above $392,350 will be effectively handing the government 30% – 40% of each additional dollar earned.

Unusual uncertainty is unusually uncertain. The longer Congress delays in giving the public clarity, the more prolonged this period of ‘unusual uncertainty’. Individuals and small businesses are already in process of making plans for the remainder of 2010 and forward, and without knowing for certain whether or not the Bush tax cuts will be extended, planning has come to a halt. Under the assumption that taxes will rise in 2011, plans for further spending in 2010 have been shelved, because those deductions will be of better use next year. Delaying a decision until year-end would not be wise.

What’s your total tax bill? Now when you add to the above effective tax rates: State and Local taxes, Social Security and Medicare taxes, sales taxes, property taxes, excise taxes; and possibly new health care and carbon taxes, the situation is not only unusually uncertain, but unbearable and unsustainable. Politicians should listen when taxpayers holler the acronym, T.E.A., which stands for taxed enough already. Congress should not only re-instate the Bush tax cuts, but should consider further cuts in both income taxes and its own out-of-control spending (which leads to higher and higher taxes). Failure to take the public seriously will result in the death of the American economy. Yes, Misguided One, when it comes to taxes and spending, we wish to go backwards, not further into the abyss.

A Potential Solution – One solution would be to extend the Bush tax cuts for another three years with one minor change. There should be an additional standard deduction granted to small business owners. Job creators who own Partnerships and S-Corporations should specifically be granted an additional deduction based on the level of business income reported on their personal tax returns. This incentive would encourage small business owners to expand, will create more jobs, and will improve the overall economy. Let’s start putting the incentive where it matters and stop punishing those who drive the American economy.

Related: Liberals, Conservatives Agree: Re-Imposing the Death Tax Designed to Penalize the Wealthy

Recovery (dot) Fail | Not Jobs

Wrong Track

Employment Situation Worse: Year-Over-Year

By: Larry Walker, Jr.

The Bureau of Labor Statistics (BLS) released their employment situation report on Friday July 2, 2010. My analysis is meant to expose facts that most casual observers ignore. Instead of the general month-to-month comparison, I am assessing changes in the employment situation over the last twelve months. This expanded view will tell us whether or not the Recovery Act is working. I will begin with my conclusions, followed by excerpts from the BLS report, and end with my analysis.

Conclusion: The employment situation is worse than it was a year ago. Although the U-6 unemployment rate stood unchanged at 16.5%, the population increased by 2.0 million, while the labor force fell by 1.0 million, making the employment situation unsustainable. The number of marginally attached and discouraged workers rose to 2.6 million, an increase of 415,000 year-over-year. The number of unemployed persons rose by 317,000. There are 919,000 fewer jobs than there were a year ago.

So much for, “the recovery is working.” So much for Progressive-Economics, the main tenets of which appear to be:

  1. Borrow huge sums of money from taxpayers and foreigners.

  2. Spend it in ways that won’t necessarily lead to job creation (i.e. tax cuts for all except for those who would use it to create jobs; more government jobs; mandatory health care; etc…)

  3. Raise taxes on the remaining smaller pool of workers who survive Steps 1 and 2, in order to pay for Step 1.

  4. Repeat Steps 1 through 3 (if you manage to survive after Step 2).

The following excerpts are from the latest BLS report entitled, THE EMPLOYMENT SITUATION — JUNE 2010:

Total nonfarm payroll employment declined by 125,000 in June, and the unemployment rate edged down to 9.5 percent, the U.S. Bureau of Labor Statistics reported today. The decline in payroll employment reflected a decrease (-225,000) in the number of temporary employees working on Census 2010. Private-sector payroll employment edged up by 83,000….

Both the number of unemployed persons, at 14.6 million, and the unemployment rate, at 9.5 percent, edged down in June….

In June, the number of long-term unemployed (those jobless for 27 weeks and over) was unchanged at 6.8 million. These individuals made up 45.5 percent of unemployed persons….

In June, about 2.6 million persons were marginally attached to the labor force, an increase of 415,000 from a year earlier. (The data are not seasonally adjusted.) These individuals were not in the labor force, wanted and were available for work, and had looked for a job sometime in the prior 12 months. They were not counted as unemployed because they had not searched for work in the 4 weeks preceding the survey….

Among the marginally attached, there were 1.2 million discouraged workers in June, up by 414,000 from a year earlier. (The data are not seasonally adjusted.) Discouraged workers are persons not currently looking for work because they believe no jobs are available for them. The remaining 1.4 million persons marginally attached to the labor force had not searched for work in the 4 weeks preceding the survey for reasons such as school attendance or family responsibilities….


Table A (click to enlarge)

A Year-over-year Analysis of the Employment Situation (Table A)

Unemployment Rate – The official unemployment rate has changed by 0.0%, from 9.5% in June of 2009 to 9.5% in June of 2010. This can be attributed to the success of the Economic Recovery Act, if you call ‘no change’ a success. However, according to table A-15, counting all marginally attached and discouraged workers, the U-6 unemployment rate, currently 16.5% was also unchanged year-over-year. (U-6 takes into consideration the total that BLS considers unemployed, plus all persons marginally attached to the labor force, plus total employed part time for economic reasons, as a percent of the civilian labor force plus all persons marginally attached to the labor force.)

The U-6 unemployment rate stood unchanged at 16.5% year-over-year.

Table A-15, click to enlarge

Civilian Labor Force – According to the BLS, the civilian labor force has declined by a little over 1 million workers, from 154.8 million in June of 2009 to 153.8 million in June of 2010. From table A-16 we learn that out of the 1 million who disappeared, 415,000 are no longer being counted because they are considered to be marginally attached (i.e. persons who want a job, have searched for work during the prior 12 months, and were available to take a job during the reference week, but had not looked for work in the past 4 weeks). Once identified, marginally attached workers are no longer counted as part of the labor force. Out of the 415,000, 414,000 are considered to be newly discouraged workers.

The number of persons no longer counted as part of the labor force, because they have stopped looking for work, increased by 415,000 year-over-year.

Civilian non-institutional population – The civilian population increased by slightly more than 2 million, from 235.6 million in June of 2009 to 237.7 million in June of 2010. So while the population increased by a little over 2 million, the labor force shrunk by 1 million, which is clearly unsustainable.

The employment situation is unsustainable.

Persons no longer in the labor force – The number of persons no longer in the labor force increased by 3.0 million, from 80.9 million in June of 2009 to 83.9 million in June of 2010. We learn from Table A-16 (below) that out of this 3.0 million, 415,000 more than a year ago are considered marginally attached (i.e. persons who want a job, have searched for work during the prior 12 months, and were available to take a job during the reference week, but had not looked for work in the past 4 weeks). We also learn from Table A-16 that a total of 6.5 million Americans who want jobs are not counted as part of the labor force, an increase of 7,000 year-over-year.

The number of marginally attached and discouraged workers rose to 2.6 million, an increase of 415,000 year-over-year.

Table A-16, click to enlarge

Number of unemployed – According to the BLS, the number of unemployed persons fell by 98,000 from 14.7 million in June of 2009 to 14.6 million in June of 2010. However, this figure ignores the increase in those considered marginally attached, so in reality the number of unemployed persons increased by 317,000 (415,000 more marginally attached minus 98,000 fewer unemployed persons) year-over-year. See Civilian Labor Force (above).

The number of unemployed persons rose by 317,000 year-over-year.

Number of employed – The number of persons employed fell by 919,000, from 140.0 million in June of 2009 to 139.1 million in June of 2010. In other words, there are 919,000 fewer people working than there were a year ago. I don’t know why Obama is out boasting about the success of his ‘Recovery Program’ when it is clearly a dud. Speaking in plain English, since there are currently 919,000 fewer jobs than there were a year ago, no jobs have been created or saved within the last twelve months (see Table A above).

There are 919,000 fewer jobs than there were a year ago.

Data Sources:

BLS Employment Situation: http://bls.gov/news.release/empsit.toc.htm

BLS Employment Summary: http://bls.gov/news.release/empsit.nr0.htm

Table A: http://bls.gov/news.release/empsit.a.htm

Table A-15: http://bls.gov/news.release/empsit.t15.htm

Table A-16: http://bls.gov/news.release/empsit.t16.htm

Obama on Jobs: Reality is Not Optional

Reality is not optional

To: Obama and other Quasi-Socialist Progressive Fundamentalist Racism Chasers

In response to various comments regarding my last blog post: Obama on Jobs: Worst Track Record in History.

By: Larry Walker, Jr.

Actually the full quote as attributed to Economist, Thomas Sowell was: “Hope is not reality, and reality is not optional.”

Of all the jobs created, and recovered before progressives co-opted the Democrat party, how many were created by the lie that it is up to the Government to borrow money and use it to provide economic stimulus? The answer is none. The old liberal policy used to be called tax and spend (i.e. get the money first and then spend it). The tried and true conservative policy is to cut taxes and let the people spend their own money (i.e. let the free market dictate). The progressive slant has regressed into a new policy called, borrow and spend (i.e. borrow money by the trillion, spend it first, and then tax the hell out of anyone who survives).

We know that the first two methods worked to some degree, although we often disagreed on which was better. All we have to do is go back in history to measure their results. The goal has always been to grow our economy in line with the population, with limited inflation and full employment. But under this new borrow and spend philosophy, all we have is the hope that, if you are ever able to get your head above water, you will be taxed back into oblivion to pay for all the money spent to get you there. In the meantime you just hope that the $250 or $400 per year government handout is enough to get you by.

The hope that an unproven policy will be able to produce the same result as proven methods is not only uncertain, but in this matter impossible. Uncertainty is optional, but reality is not.

Joe Biden recently stated, “We will never be able to recover the eight million jobs that were lost.” Why would he say that? Because there is no way that it can be done under progressive ideology. It doesn’t take a rocket scientist to figure that out.

Under progressive ideology, the economy is something that will continue to function efficiently no matter which policies are crammed down its throat: stimulus, health care, energy policy, financial reform, etc… All of which may be noble goals in a fictitious world, but neither has anything to do with economic growth, nor job creation. True, each may create a few (net) jobs in the next 20 to 40 years, but there may not be any need by that time. In the end, you may be able to force all of these wonderful policies upon the peons, but by then no one will care because the great economy that once existed will be no more.

We need an economy that works for us today, not 20 years from now.

In reality, mandatory health insurance won’t do much good if there are no doctors or hospitals to visit. And where will one go to purchase it when all the insurance companies are gone? Renewable energy and carbon taxes won’t do much for the masses then living in cardboard boxes. Financial reform will be for naught if no one has any money left to save or invest. You can’t have it both ways. Either you put jobs and the economy first, or you fail on all counts.

Hoping that an unproven set of policies will work is not reality. We gave it a shot by spending well over $1 trillion, and it didn’t work. The national debt is now almost 100% of GDP and there is nothing to show for it. So what do you want to do? Do you want to keep on borrowing and stimulating until there’s nothing left? Or should we perhaps pause and consider making a u-turn? I say we heed the warning and make a u-turn before it’s too late.

We know what works, all we have to do is look back in our history at the policies that made America great.

“Reality is not optional.”

___________________________

My previous blog post may also be found at the following sites:

http://www.bookerrising.net/2010/06/larry-walker-jr-commentary-obama-on.html and,

http://aipnews.com/talk/forums/thread-view.asp?tid=15308&posts=1#M40159

Obama on Jobs: Worst Track Record in History

Obama: Worst President in History Award

Progressive Policies are Losing 4.2 Million Jobs Annually

By: Larry Walker, Jr.

On January 9, 2009, a staff writer for the Wall Street Journal wrote a smear piece entitled, “Bush On Jobs: The Worst Track Record On Record,” in which an attempt was made to show that Bush was somehow the worst President, and that therefore, Conservative economic policies (i.e. tax cuts) don’t work.

According to the staff writer, George W. Bush created a dismal +375,000 jobs per year during his eight year term; Bill Clinton created +2.9 million jobs per year; while George H.W. Bush created +625,000; Reagan prospered by +2.0 million; Carter by +2.6 million; etc… The staff writer also went into population growth during each term and the percentage of change in the population (for whatever reason). You can find the smear piece and the WSJ table here. Following is an excerpt:

President George W. Bush entered office in 2001 just as a recession was starting, and is preparing to leave in the middle of a long one. That’s almost 22 months of recession during his 96 months in office.

His job-creation record won’t look much better. The Bush administration created about three million jobs (net) over its eight years, a fraction of the 23 million jobs created under President Bill Clinton’s administration and only slightly better than President George H.W. Bush did in his four years in office.

Naturally it is important to use this same benchmark to measure how Barack H. Obama stacks up against his predecessors. So I went over to the good old Bureau of Labor Statistics website and made up my own table, based on the raw data. I brought my chart up to date through May 31, 2010. True, Obama has only been in office for 17 month’s, but we can at least get an idea of how he measures up.

Like the WSJ writer, the counts are based on total payrolls between the start of the month the president took office (using the final payroll count for the end of the prior December) and his final December in office (May 31, 2010 for Obama). Thus, there is no blaming the last POTUS for inheriting a bad economy, and no foul in taking credit for inheriting a good one. After all, being President is about leadership, and leaders take what is in front of them and do the best they can.

Net Job Creation by President (Click to Enlarge)

According to my table, Barack Obama has lost a total of -4.2 million jobs per year, making him, to date, the worst President in history. G.W. Bush actually created 1.1 million jobs per year during his eight-year term. Bill Clinton is responsible for 2.3 million jobs in each of his years. George H. W. Bush can lay claim to 881,000 during each of his four years. Reagan gets credit for 2.0 million jobs per year. And finally, even Jimmy Carter can boast in having created 2.6 million jobs per year. Net job creation is so much better than, economy killing, Progressive policies that there really is no comparison.

Now I am not naïve enough to believe that Presidents, or that governments for that matter, are responsible for job creation, but if you want to make that case, at least get the numbers right. It looks like the WSJ staffer padded Clinton’s numbers while taking away from both of the Bush’s. At the same time, he did manage to get both Reagan’s and Carter’s numbers right.

In conclusion, thus far, the Progressive policies of Barack H. Obama are failing. There ought to be a law. Actually there is a law. It’s called, ‘The Law of Supply and Demand’. When prices fall, demand increases. When taxes are reduced, investment, production and employment increase. And when supply is increased, prices fall, leading to increased demand. Government intervention in the private sector has never worked, and it never will. Reducing the size of government, lowering taxes, and decreasing government regulation actually work after all. We will most definitely be following up.

References:

ftp://ftp.bls.gov/pub/suppl/empsit.cpseea1.txt

http://blogs.wsj.com/economics/2009/01/09/bush-on-jobs-the-worst-track-record-on-record/