The Malaise of 2012 | Part II

* Inordinate Stimulus, Undue Debt and Global Warming Foolishness Caused the Recession

* By: Larry Walker, Jr. *

“… an unprecedented degree of federal government spending and intervention vis-à-vis the $787 billion dollar economic stimulus package, the $81 billion dollar bailouts of GM and Chrysler, and the enactment of health care and financial regulatory and reform bills have done nothing to stimulate our anemic recovery and have fundamentally failed at creating private sector jobs, or generating economic growth necessary for a sustainable, healthy recovery.” ~ Douglas Schoen via: The Daily Beast

Inordinate Stimulus

According to Economist Raymond Richman of Ideal Taxes Association, “The recession of 1937-38 indicated that there was no Keynesian multiplier.” That is to say, as soon as the stimulus of the preceding four years was reduced, the economy tanked. Nevertheless, Keynesians believe that the Roosevelt administration reduced stimulus spending too soon. The same argument has been made by Nobel Prize winner Prof. Paul Krugman and former Chairman of the Council of Economic Advisers, Prof. Christina Romer, and many others, after the failure of the $787 billion Recovery Act of 2009.

If four years of government stimulus isn’t enough, how long should it take, until the nation declares bankruptcy? The truth is it really doesn’t matter how long a stimulus program lasts, whether it endures for a day, a week, a month or a century; as soon as the program ends, so does all of the propped up economic growth. Is there any proof to the contrary? No, not unless hot air can be likened to proof. Let’s us ponder the stimulus theory.

For example, if the government were to give each citizen a $40 per month advance out of their future Social Security retirement entitlement, such stimulus may provide a small boost to personal consumption, or private savings. Why a family of four might even be able to purchase an extra half-tank of gasoline, at today’s prices. But will the ability to buy an extra half-tank of gas lead to a permanent $40 per month pay raise?

Not unless the extra mileage is used to obtain either a second, or higher paying job. Short of that, once the stimulus ends, so will the temporary boost to disposable monthly income. The point is that unless a stimulus program results in a permanent increase to future income, when the program ends, the recipient is demoted back to square one, or in the current economy, square zero.

With inflation soaring as it is today, an extra $40 per month will, if one is lucky, afford the same amount of gasoline that could have been purchased three years ago, at half the cost. And what’s the trade off? Well, one can either look forward to a smaller retirement annuity in the future or a tax hike in the near-term in order to make up the difference.

Green wasn’t as green as we thought!

To further drive home the point, if the government were to identify certain promising green energy companies, and to grant them billions of dollars in loan guarantees; would this represent the kind of stimulus capable of permanent growth? Well, that would depend on whether such companies produced marketable products. We know the U.S. Department of Energy has already engaged in precisely such activity. And what were the results?

As soon as the funds were disbursed, the companies purchased buildings, equipment, hired workers, and began to manufacture. But in most cases, the products in question have turned out to be overpriced and unmarketable. Since there was no unsubsidized present day demand for imaginary 22nd Century products, once the stimulus well ran dry, most of these grand endeavors collapsed. The remainder will soon follow suit.

Dr. Valerie Ramey, Professor of Economics at the University of California, San Diego recently published a Working Paper Series in the National Bureau of Economic Research (NBER) entitled, “Government Spending and Private Activity,” in which she drew the following conclusions:

  • Private spending falls significantly in response to an increase in government spending.

  • Increases in government spending lower unemployment, but in most cases virtually all of the effect is through an increase in government employment, not private employment.

  • And that on balance, government spending does not appear to stimulate private activity.

Although in early 2010 the economy received a jolt, the bump in the road we all felt was nothing but a speed bump on the way to another recession. The sheer size of the injection propelled us upward for a fleeting moment, but in the aftermath, GDP declined from a year-over-year growth rate of 3.0% in 2010, to a year-over-year growth rate of just 1.7% in 2011. Alas, once the stimulus subsided, economic growth was cut nearly in half. Inordinate stimulus is a major contributor to the Malaise of 2012.

No matter how you slice it, deficit-financed government stimulus doesn’t provide the requisite spark essential to permanent economic growth, it never has, and it never will. There is no Keynesian multiplier. So what else is new?

To be continued …

Continued from Part I

Related:

Tax Simplification, Part II – Saving $1,756 Billion, Overnight

Why Our Recession Call Stands – Economic Cycle Research Institute (3/15/12)

The Malaise of 2012 | Part I

* Inordinate Stimulus, Undue Debt and Global Warming Foolishness Caused the Recession

* By: Larry Walker, Jr. *

Despite Obama’s optimism, the Economic Cycle Research Institute (ECRI), the same organization which successfully predicted the last recession, and which over the last 15 years has gotten all of its recession calls right while issuing no false alarms, has recently opined that a 2012 recession is now inevitable.

According to ECRI, the four basic metrics that define an economy are gross domestic product (GDP), personal income, broad sales and employment. GDP peaked in the 2nd quarter of 2010, and has since been cut in half. Personal income and broad sales have closely tracked GDP. And although there has been a firming in jobs growth, when the four are taken together, the data confirm that the economy is slowing. We are heading into recession.

Employment is a lagging indicator.

Many mistakenly believe that if jobs growth gets a little better, then consumption, production and income will all improve; but in the real world jobs follow consumption, production and income. In other words, as consumption, production and income improve higher levels of employment follow. But since consumption, production and income are all on the decline, the jobs market will soon follow.

Case in point: During the recession of 2001, which lasted from March until November of 2001, employment peaked at an all-time high of 132,529,000 jobs in February, a month ahead of the recession. Six years later, during the recession of 2007, which lasted from December of 2007 through June of 2009, the number of jobs hit a new all-time high of 138,023,000 in January of 2008, the month following the start of the recession.

At the other ends of the spectrum, during the former recession (March 2001 – November 2001), the number of jobs didn’t reach a bottom of 129,840,000, until June of 2003, some 19 month’s after the recession ended. While during the latter malaise (December 2007 – June 2009), the jobs market hit a bottom of 129,244,000, but not until February of 2010, a full 8 month’s after the recession ended.

So which came first, the chicken or the egg? In other words, does a slow down in hiring lead to a slow down in hiring? Or does the tanking of GDP, personal income and broad sales lead to recession, and recession to the loss of jobs? I think we know the answer.

What’s sad is that the U.S. never fully recovered from the recession of December 2007, yet here we go again. Just look at employment. As of the February 2012 Employment Situation Report, employers logged in a total of 132,697,000 jobs, which is just 170,000 more than we had in February of 2001. Yet over the same period of time, the civilian non-institutional population has grown by some 29,692,000 persons. So as the working age population has grown by over 29 million, the number of jobs has grown by a mere 170,000. The handwriting is on the wall.

The point is that any improvement we are seeing in today’s employment situation isn’t necessarily cause for celebration, at least not for Mr. Obama, as it is likely the end of his (temporary) stimulus based, debt laced, global warming panic induced, anemic recovery. If you still don’t get it, go back to the top and re-read paragraphs 1 through 3, and it might help if you follow the links.

To be continued…

U.S. Tax Compliance Costs $44B, not $400B

Tax Foundation’s Runaway Compliance Estimates

By: Larry Walker, Jr. –

“There are three kinds of lies: lies, damned lies and statistics.” ~ Mark Twain –

According to the Tax Foundation, federal income tax compliance costs were projected to reach $392 billion by 2011, and $483 billion by 2015. Now they say it’s probably in the ballpark of $400 billion as of 2011. So in other words, they figure that it costs taxpayers an additional 20 to 40 percent of the amount paid in income taxes just to fill out and file the forms. However, what people echoing these numbers overlook is the fact that these figures are based on Internal Revenue Service estimates made during an era in which tax forms were completed with a tax booklet, pencil and calculator, a methodology that even the IRS discontinued in 2006.

The fact that the Tax Foundation assigned a dollar value to outmoded time estimates, based on a taxpayer’s average hourly earnings, is even more appalling. The real eye opener ought to be that a huge chunk of the dollar cost mentioned is not money that anyone actually spends. It is rather the value placed on the time each taxpayer would spend preparing their income tax return if (1) they actually prepared their own tax return, (2) they prepared their return with a tax instruction booklet, paper forms, a pencil, and calculator, and (3) they were compensated for their time.

To prove just how bogus this figure is, I pored over the Tax Foundation’s 2005 report. The first thought that occurred to me is that the reason the report hasn’t been updated since then is because the IRS stopped estimating the time it takes to manually fill out tax forms in 2006, and without these estimates, the Tax Foundation’s theoretical foundation disintegrated. And why did the IRS stop making these estimates? Well, primarily because since it began accepting electronically filed returns in 1990, and set a goal of achieving – “80% of all tax and information returns filed electronically by Filing Season 2007″, and with the advent of personal computers and cheap software, the amount of time spent and cost of preparing income tax forms has declined dramatically. Thus, the idea of one toiling for 17 to 23 hours, or longer, over a 2 to 3 page tax return is passé.

One section of the report states that: “When examined by income level, compliance cost is found to be highly regressive, taking a larger toll on low-income taxpayers as a percentage of income than high-income taxpayers. On the low end, taxpayers with adjusted gross income (AGI) under $20,000 incur a compliance cost equal to 5.9 percent of income while the compliance cost incurred by taxpayers with AGI over $200,000 amounts to just 0.5 percent of income.”

What the Tax Foundation is saying is that a person with $20,000 of adjusted gross income would incur a cost of $1,180, or 5.9% of their income, in preparing their income tax return, and a person making $200,000 would expend $1,000, or 0.5% of their income. Does that match your experience, because it’s complete nonsense from my vantage point? Is this even remotely reasonable? Let’s examine this theory in more detail.

Following the Tax Foundation’s logic, we could assign a cost to virtually everything we do, as a function of our annual income. Never mind the fact that we only get paid for the time we actually work. So in other words, if you make $9.61 per hour on the job, and it takes you 2 hours per week to wash your clothes (on your time off), then according to this theory, the real cost of clothes washing is more than $1,000 per year ($19.22 times 52 weeks; plus washing powder, water, electricity, and depreciation of your washing machine and dryer), or more than 5.0% of your annual income.

Carrying this through to its illogical conclusion, for a person who works 8 hours per day, the cost of sleeping 8 hours per night would be equal to their annual income, right? So one can only ponder the cost of watching television, driving to and from work, mowing the yard, etc… You can see how silly this is. To drive the point home, under this theory, if you work 8 hours per day, and have 16 hours of free-time, then the cost of everything you do outside of work would be twice as much as your annual income. In other words, you’re not actually making $20,000 per year, heck, you’re not even breaking even; you’re going in the hole by $20,000 every year. Well, so much for that theory.

Ask an Accountant

I have had the fortune of preparing income tax returns, both in the early 1980’s, before the advent of personal computers, and in the 21st Century with high speed internet and gigabytes of random-access memory. In the early 1980’s it took literally days to complete a complex income tax return. Information would be gathered and written onto data forms in pencil, then shipped off to a main-frame computer processing center. The printed return would then be mailed back in about 3 business days, although a typographical error would easily double this time-frame. Then the taxpayer(s) had to be summoned to come in and sign the return before it could be postmarked.

The cost of preparing an itemized Form 1040 with Schedule A, plus a state tax return, back then averaged around $150. Most non-itemized returns were completed on the spot, with pen and calculator, for around $85. What some people miss is that since $150 in 1981 had the same buying power as $380 today, annual inflation over this period being 3.16%, and since the average cost is still around $150 today (in the Southeast), the cost of preparing income tax returns has actually declined by around 61%, over the past 30 years. But you won’t hear about this from today’s rubber stamps.

It was in 1990 that IRS e-file became operational nationwide, and that year 4.2 million returns were filed electronically. I was working for the IRS at the time. Later on, when I started my own practice back in the year 2000, after doing other things for a few years, part of my mission statement read, “To assist the Internal Revenue Service in its goal: ‘To have 80% of all tax and information returns filed electronically by Filing Season 2007’”.

By the year 2007, as per the table below, the percentage of electronically filed returns had only reached 57%, however, many practices, such as mine, were already near the 100% mark. As a result, ever since then, that part of my mission statement has read, “To file 99.9% of all income tax and information returns electronically”. Nowadays, a tax preparer, who prepares more than 10 returns per year, is required to file all returns electronically.

From personal experience, these days it takes about an hour to prepare and e-file the same income tax return that used to take 3 days or longer. Like in many other industries, technology has made tax compliance both cheaper and more efficient. While prices have risen dramatically in other sectors, such as Education and Health Care, the cost of professional income tax preparation has plummeted, on an inflation adjusted basis. Most notably, the time it takes to prepare a return has been reduced from days to minutes. Similarly, the time it takes to receive an income tax refund has been reduced from 6 to 8 weeks, down to 7 to 10 days. This is precisely why the IRS no longer publishes obsolete manual computation time-frames.

The 2005 1040 Instruction Book, on page 79, states, for example, that the time and cost of preparing a Form 1040 with Schedule A and other schedules, but no Schedule D, was as follows (see table below, 3rd row from the top):

  • Self prepared without software – 16.7 hours | $18
  • Self prepared with software – 22.7 hours | $51
  • Prepared by Professional – 12.1 hours | $174

In analyzing this, does anyone out there seriously believe that it would take 6 hours longer to self-prepare a tax return with software, than without? Like that makes sense. And what kind of practice would a professional be running, if it took 12.1 hours to complete each itemized 1040 return? At that pace, a professional would only be able to complete around three 1040 returns per week, and since the regular season only lasts about 12 weeks, would only be able to prepare around 40 returns per season, with a seasonal income of around $6,900. If it really took a professional 12.1 hours to prepare each an every itemized Form 1040, we would indeed have a problem. However, since actual facts and figures reveal that tax preparation really takes a fraction of the time it used to, and costs less than half of what it did 30 years ago, perhaps we don’t have a problem after all, at least not a ‘cost of income tax compliance problem’.

According to Nickel, over at the fivecentnickel.com, his research coming from the National Society of Accountants biennial survey, the average tax preparation fee for an itemized Form 1040 with Schedule A, plus a state tax return, was $229 in 2010. And for a Form 1040 and state return without itemized deductions, the average price was $129. But keep in mind that tax preparation fees vary regionally, so the above averages aren’t necessarily applicable depending on where you live. The lowest costs are in the Eastern South Central region (AL, KY, MS, and TN) where a Form 1040 with a Schedule A and state return averages $137. And the most expensive region is the Pacific (AK, CA, HI, OR, and WA) at $292.

He also found that for those with more complex returns, modern day costs average as follows (again, prices will vary by region):

  • $212 for Form 1040 Schedule C (profit or loss from business)
  • $551 for Form 1065 (partnership)
  • $692 for Form 1120 (corporation)
  • $665 for Form 1120S (S corporation)
  • $415 for Form 1041 (fiduciary)
  • $2,044 for Form 706 (estates)
  • $584 for Form 990 (tax exempt)
  • $58 for Form 940 (federal unemployment)

Here in the Southeast, a professionally prepared itemized Form 1040 with Schedule A, plus a state tax return, takes about an hour to prepare, and the fee averages $150. The question of whether a person making over $200,000 will pay more, or less, is actually not based on their income, but rather on how many forms need to be prepared? So if an itemized Form 1040 with Schedule A, plus a state tax return, costs an average of $150 to prepare, that’s generally how much it costs no matter how great one’s income. That’s because the time it takes to prepare such a return would be about the same. If it costs more, it’s most likely due to additional form filing requirements. Thus, the true modern day cost of $150, to prepare such a return, is a far cry from the Tax Foundation’s estimate of $1,000.

At the same time, a basic Form 1040-A, plus a state return, would take around 30 minutes to prepare, with an average fee of $85 ($60 without the state). This is also a major discrepancy from the Tax Foundation’s estimated cost of $1,180, for a person making $20,000 per year. If we were to follow this artificial tack, then we would have to believe that it would take something in the order of 122.7 hours to prepare a basic 2 or 3 page 1040-A return, at a cost of $9.61 per hour (the hourly wage for a person making $20,000 per year). Therefore, the Tax Foundation’s purported $400 billion per year estimate is grossly overstated.

The act of basing an entire tax reform platform on factitious information is called, “fraud”. So who’s been out on the stump quoting these make-believe numbers? Of late, it’s been Mitt Romney, Rick Perry, previously Herman Cain, and a host of others. But it’s time for the public to wake up and realize that the Tax Foundation’s figures are completely bogus.

Sure, some returns take longer than others, some cost more than others, and most businesses require monthly or quarterly accounting and payroll tax services on top of income tax return preparation. But what’s the alternative for a business, to not have any record of whether it is profitable? Can businesses just do away with all record keeping and financial reporting for the sake of skimping on an ordinary and necessary business expense? I don’t think that would be a wise move.

A Gross Overstatement

To conclude, the Tax Foundation’s estimate is a made-up number, based on obsolete data. The true costs of complying with federal income tax laws have declined dramatically over the past 30 years. Thus, anyone floating figures ranging from $400 billion to $500 billion per year must have their head in the sand.

There’s no way you could ever convince me that it takes 122.7 hours, to enter the amounts contained on a W-2 Form into a computer program, or onto a paper form, in order to file a simple 1040-A return. Nor can you persuade me to believe that the cost of preparing such a return could ever reach $1,180. But that’s essentially what the Tax Foundation’s report says.

The correct method of determining any cost is to add up the actual outlay in cash, but since the Tax Foundation has not chosen this method, I must conclude that their estimate is overstated by as much as 88.9%. How did I arrive at this percentage? By sampling.

The 2005 IRS out-of-pocket cost estimates reveal that the most one would pay is charged by tax professionals. Since the fee charged for a simple 1040-A, plus a state tax return, completed by a paid preparer, is actually $85, not $1,180 as they would have us believe, the Tax Foundation’s estimate is off by 92.8% ($85 vs. $1,180). And since the cost of a professionally prepared itemized Form 1040 with Schedule A, plus a state tax return, is actually $150, instead of $1,000, they are off by 85% ($150 vs. $1,000). Averaging these two percentages together results in an overstatement of 88.9%. Thus, I conclude that the Tax Foundation’s estimate, that federal income tax compliance is costing Americans around $400 billion per year, is in reality probably less than $44.4 billion (11.1% of $400 billion).

Frankly, I would be more concerned about real and verifiable IRS statistics, such as the number and amount of refunds being doled out. For example, in 2010, out of the 142,449,000 returns that were filed, 109,376,000 received refunds totaling $328.4 billion, for an average refund of $3,003 per return. Now that’s real money, which, if you think about it, is being summarily piled on to the national debt. So what’s up with that?

Related:

Cross posted at: Free Republic

What Does $40 per Week Mean To You?

– Let’s see, to me one thing it means is that the federal government will be adding another $120 billion to the national debt. For my friend Jeff, at Liberty Works, it means – we’ve been bamboozled again. –

By: BoomerJeff | Liberty Works

“… On Thursday Obama ramped up the theatrics and gave us a preview of his New Year strategy for diverting attention away from his manifest failures. He stepped to the microphones to prove he identifies with the struggles of the helpless against those cruel Republican Scrooges (transcript). His tone dripping with pious solicitude, he began:

We’ve been doing everything we can to make sure that 160 million working Americans aren’t hit with a Holiday tax increase on January First…If you’re a family making about $50,000 a year this is a tax cut that amounts to about a thousand dollars a year. That’s about forty bucks out of every paycheck.

So far the President’s math is correct, since most employees are paid either bi-weekly or semi-monthly.

It may be that there are some folks in the House who refuse to vote for this compromise because they don’t think forty bucks is a lot of money. But anyone who knows what it’s like to stretch a budget knows that at the end of the week or the end of the month forty dollars can make all the difference in the world…

So on Tuesday we asked folks to tell us what it would be like to lose forty bucks every week.

Wait a minute! “Every week?” He just changed it from $40 out of every paycheck to $40 every week! But the temporary tax cut is worth only $19 every week to his hypothetical $50,000 per year family.

You’d have to earn $104,000 a year for Obama’s Social Security tax markdown to be worth $40 every week.

Obama then quoted some of the emails from his “folks” about how they would deal with the loss of $40 per week.

Joseph from New Jersey would have to sacrifice the occasional pizza night with his daughters. My 16 year old twins will be out of the house soon – I’ll miss this.

Richard from Rhode Island wrote to tell us that having an extra $40 in his check buys enough heating oil to keep his family warm for three nights. In his words, and I’m quoting, If someone doesn’t think that 12 gallons of heating oil is important invite them to spend three nights in an unheated home.

Pete from Wisconsin told us about driving more than 200 miles each week to keep his father in law company in a nursing home. $40 out of his paycheck would mean that he could only make three trips instead of four.

Dinner out for child who’s home for Christmas, a pair of shoes – these are the things that are at stake for millions of Americans. They matter a lot.

Obviously these emails are absurd. If you earn $104,000 and have to give up $40 per week, are you really going to have to deny your kids a pizza or a pair of shoes? Will you shiver for three nights without heating oil?

Of course, there are some folks to whom $40 every week would be make a real difference:

  • A hotel maid who works full time for $8.50 per hour

  • A construction worker who has been cut back to half time work at $17 per hour

  • A self employed business owner whose customers were hammered by the recession and now barely survives by depleting his savings. He generated only $17,700 profit this year after paying his employees and the employer’s half of the payroll tax which was not reduced by the Obama payroll tax markdown.

To each of these people Obama’s temporary payroll tax cut is worth not $40 but $6.80 per week.

But much of the media have already begun to help Obama plant a false perception in the minds of uninformed voters that Republicans would deny everyone $40 per week. (For example, see the headline here.)

Obama knows that informed voters will figure out the deception. But he doesn’t care about informed voters. They won’t vote for him anyway.”

Obama’s Last Stand | A Level Playing Field

Unemployment and Educational Attainment

– By: Larry Walker, Jr. –

In a speech given on December 6, 2011, Barack Obama, the Debtor-In-Chief, called for a Level Economic Playing Field. “This isn’t just another political debate. This is the defining issue of our time. This is a make-or-break moment for the middle class, and all of those who are fighting to get into the middle class,” he said. “At stake is whether this will be a country where people can earn enough to raise a family, build a modest savings, own a home and secure their retirement.” Yeah whatever! His populist tone, however, has fallen mostly upon deaf ears, as America has come to realize that the $5 trillion of debt, which he has racked up over the last 3 years, is the real defining issue of our time. And that in spite of all of his irresponsible borrowing and spending, Obama has delivered next to nothing in the way of improved permanent living standards for any American.

Newsflash! The recession ended in June of 2009. The economic crisis is over. What we are witnessing at this point is what an economy looks like, some 29 months after a recession has ended, when an emaciated government Administration has miserably failed its people. No, this isn’t a recession, it’s an Obama recovery. If things aren’t moving fast enough for you, it just may be that the Class-Warfare-Instigator-In-Chief has been focused more on disarming the economy than fortifying it. Those who are content with waiting on Obama to remake America, in his own image and likeness, will find themselves waiting a long time, as it originally took some 244 years to get where we were prior to his anointing.

But as for the rest of us, we don’t have to wait any longer than November of 2012 to bury Obama’s dated ideals of crony capitalism and political pandering back underneath the trash heap from which they emanated. As the self-ascribed millionaire, and so called, spokesman for the poor and downtrodden, engages in an irrational personal conflagration to extend a contrived $8 to $16 per week payroll tax cut for most working Americans, while at the same time bankrupting the nation as a whole, most of us realize that it’s going to take a lot more than a temporary handout to fix what is likely a systemic problem.

Does Obama seriously believe that someone hearing his class-warfare vitriol will suddenly be inspired to run out and enroll in a G.E.D. program, or college; or to start a new enterprise? Because I don’t think his divisive tone cuts the mustard. Will an $8 to $16 per week bounty seriously be enough to usher us into the Promised Land? Yeah, right! So Obama has chosen to make his last stand — the act of doling out a one-year, deficit-financed, premature social security distribution (for the 3rd year in a row), while at the same time handing each American citizen our “fair share” of a national debt, that is now $48,254 for each and every one of us. But it seems to me that he might want to take care of his own issues first, since he (Obama) has already inflated the national debt by 50% of the amount incurred by the first 43 presidents, in just 3 years. The thought of another nickel of reckless spending coming out of this White House makes me want to see him rot in a federal penitentiary, for the rest of his days. After all, has he not essentially stolen the future away from my children and grandchildren?

What is the Playing Field?

So let’s look at the facts surrounding what would be involved in leveling the so called playing field, as Obama so ineptly echoes. According to the Bureau of Labor Statistics (BLS), the unemployment rate among those, 25 years of age and older, who have attained less than a high school diploma is a whopping 13.2%, while it is only 4.4% for those with a Bachelor’s Degree or higher. And according to the U.S. Census Bureau, households with a householder 25 years old and over, with less than a high school diploma have median incomes of $24,787, while those with a Bachelor’s Degree or higher have median incomes of $82,109. So what does that tell you? It tells me that some people achieve more than others, but it doesn’t tell me that the playing field is not level.

The following table, courtesy of the BLS, was split up into four parts, mainly due to the overall size, but also to focus on the characteristics of each category. First, as of November of 2011, the unemployment rate among those age 25 and over who have attained less than a high school diploma was a colossal 13.2%, while the labor force participation rate was a mere 47.0%. That means that while some 10.2 million in this category were employed, another 1.5 million were unemployed, and that there were another 13.2 million people somewhere out there who never made it through high school. Although this is the smallest of the four categories, one’s chances of employment are greatly diminished by not finishing high school.

Next, according to the BLS, the unemployment rate among those 25 years of age and over who are high school graduates was 8.8%, which is still rather high, while the labor force participation rate was 60.3%. That means that while some 33.8 million in this category were employed, another 3.3 million were considered unemployed. Note: It’s curious that the overall unemployment rate dropped from 9.0% in October 2011 to 8.6% in November of 2011, primarily due to the fact that 315,000 workers dropped out of the labor force, and that the civilian labor force among high school graduates — with no college, fell by 302,000. Is this just a coincidence?

In comparison, for those equipped with a high school diploma, along with some college or an Associate’s Degree, the unemployment rate was 7.6%, which isn’t all that great, but better than the former categories, and the labor force participation rate was also an improvement at 68.4%. This means that while some 33.9 million in this category were employed, another 2.8 million remained unemployed.

Finally, among those with a Bachelor’s Degree or higher, the unemployment rate was a mere 4.4%, while the labor force participation rate was a tolerable 76.0%. What a dramatic improvement. This means that some 45.0 million college graduates were employed, while just 2.1 million were considered unemployed. Thus, one’s chances of employment are immensely greater after attaining a college degree.

So from the above, we can state that we have a civilian labor force of 132.7 million people, 25 years of age or older, and that among these, as of last month, 123.0 million were employed, and 9.7 million were unemployed. And as far as the unemployed, 2.1 million have a Bachelor’s Degree or higher, 2.8 million attended some college, 3.3 million stopped after high school, and another 1.5 million never graduated from high school. Among those who are employed, 45.0 million are college graduates, 33.9 million attended some college, 33.8 million stopped after high school, and 10.2 million dropped out of high school.

What should be rather obvious from the preceding tables is that the higher one’s level of education, the greater one’s chances of employment, especially in a tough economy. So how does Obama propose to level this playing field? Will he give non high school graduates honorary diplomas? Or will he take money and opportunities away from achievers and hand it over to non-achievers? For the most part, all I ever hear from Obama is nonsense such as, ‘tax high achievers and give a portion of their earnings over to non-achievers’, or ‘tax the rich, and give $8 to $16 per week tax cuts to those who already have jobs’. But how would either method fix the achievement inequality gap which is evident in the preceding tables? They won’t.

You see, there is no way to make this playing field any more level than it already is. I mean it is what it is. If you want a good life, the first step is to finish high school, and if you don’t, it’s not the responsibility of those who did to take care of you. If you want to do a little better, then plan on attending college because, even if you don’t finish, your life will be immensely better. Heck, I’m not ashamed to say that I didn’t finish college until I was 32 years old. And I managed to trudge through it with a full-time job, and a wife and four children at home. Had I not done so, my advancement would have been limited at best. And when I finished, I didn’t have a dime of student loan debt. So it can be done, and it must be done in order to obtain anything in this society. That’s just the way it is.

Digging a little deeper, according to the U.S. Census Bureau’s 3-Year Estimates, among those 25 years of age and over, only 27.8% attained a Bachelor’s Degree or higher, while 15.1% didn’t make it through high school (see table below). According to the data, 29.0% graduated from high school (including equivalency), 20.7% attended some college but did not get a degree, 7.5% attained Associate’s Degrees, 17.6% earned Bachelor’s Degrees, and 10.2% obtained Graduate or Professional Degrees. So although 84.9% of Americans graduated from high school, a much smaller percentage went on to complete college. So that brings us to the big question: Does one’s level of educational attainment make any significant difference in economic standing?

Well, according to the U.S. Census Bureau’s 3-Year Estimates, we can see (in the table below) that the poverty rate among those with less than a high school diploma is 24.5%, while it was 11.8% among high school graduates, 8.2% for those with some college, and only 3.7% for those with a Bachelor’s Degree or higher. So the chances of living a life in poverty are greatly enhanced for those who fail to graduate from high school, while being very slim for those attaining at least a Bachelor’s Degree. So does this mean that the playing field isn’t level? Do high achievers have a responsibility to take care of non-achievers? Did some of us start out on a different playing field, other than kindergarten? And is it possible for Obama’s wealth redistribution vision to turn back the hands of time and place everyone back on Square One? The answers to all of the above — a solid “No”.

As I mentioned in, Obama’s Square Deal and Just Deserts, and according to the U.S. Census Bureau, in 2010, households with a householder 25 years old and over with less than a 9th grade education earned median incomes of $21,254 and mean incomes of $30,232, while those with some college earned median incomes of $48,722 and mean incomes of $61,026, and those with a Bachelor’s Degree or higher earned median incomes of $82,109 and mean incomes of $104,555 (see table below). So anyone who wants to earn their ‘fair share’ should be prepared to plot their ‘own course’, and to complete the necessary steps. How high you reach, and how you get there is simply a matter of free will. So unless Obama is proposing to take away free will, or to somehow make college education mandatory, all of this “level playing field” rhetoric is just smoke.

I will go ahead and submit that America is firmly planted on an even playing field. It begins in kindergarten and ends where it ends, due to personal choices, parental upbringing, and life experiences. I will also state that high achievers do not owe non-achievers a single solitary dime. Nor is it the responsibility of the federal government to improve the lives of those who make bad choices. Sure, government can and should encourage upward mobility, but as the saying goes, “You can lead a horse to water, but you can’t make him drink.” It is not the federal government’s responsibility to knock high achievers back a few steps so that non-achievers can catch up. Sorry, but it doesn’t work like that. Just like God helps those who help themselves, governments should only venture to help those who help themselves.

Now will somebody please explain to me how giving out $8 to $16 per week deficit-financed handouts (i.e. the payroll tax cut), to people who are already working, will manage to level the playing field for the 11.7 million civilian workers who, for one reason or another, didn’t bother to graduate from high school? Or for that matter, for the 37.1 million who chose to climb no higher than high school? My short answer is that it won’t. In fact, nothing that Obama has been spewing will miraculously turn lower levels of educational attainment into higher learning, nor bigger paychecks. For all his rhetoric, Obama hasn’t inspired one American to pick themselves up by the bootstraps and try to make progress.

In truth, all that I’ve heard from Obama are the following misnomers — society isn’t fair, and under-achievers are owed something by those who have been more successful. Yet it turns out that the most successful members of our society are mainly those who finished high school, and went on to graduate from college. Hopefully someone in the ‘class’, that either didn’t finish high school or is thinking about dropping out, will be inspired by what you have just read, to indeed pick “yourself” up and move forward. And I would to God that some Ronald Reagan protégé would take up the mantle, and again speak those words that so inspired me to pick myself up by the bootstraps, return to school, and seek a better life.

We must not look to government to solve our problems. Government is the problem.” ~Ronald W. Reagan

Endless Stimulus | Payroll Tax Cut

Common Sense vs. Nonsense: Bankrupting the Future –

By: Larry Walker, Jr. –

Facts: The 2% payroll tax cut not only boosted workers’ take-home pay by $120 billion in 2011, but it also widened the government’s budget deficit, and left the social security trust fund in the red.

Since Social Security and Medicare taxes are collected in order to realize future benefits, why would the federal government choose to refund a portion of those collections today? Are its entitlement programs in such good shape that the government can afford to distribute benefits prematurely? I don’t think so. For that would infer that future benefit payouts are on the decline. However, to the dismay of many, in fiscal year 2011 the net cost of social security benefits increased by 18.9%, over fiscal year 2008, while tax collections declined by 13.5%, widening the breach by 1,678%.

Since at least 1975, a growing portion of social welfare spending has been introduced by Congressional tax-writing committees and administered by the Internal Revenue Service. As I outlined in Tax Simplification, Part II, the Earned Income Credit, Child Tax Credit, and Making Work Pay Credit were primarily responsible for IRS administered giveaways of $171 billion in fiscal year 2010, or if you prefer $1.7 trillion over 10 years. In fiscal year 2011 the amount was upped to $231 billion per year, due to the payroll tax cut. And today, some members of Congress are urging others to increase these tax giveaways to $351 billion annually, which I think will end up costing closer to $471 billion (as explained below). But in all of this pandering, what is even more illogical than charging additional debt to Obama’s unlimited credit line, is the rebating of funds “supposedly” earmarked for future liabilities.

As Sherlock and I proved in Social Security: A Breach of Trust, the federal government has summarily confiscated and spent every dime of the $2.6 trillion surplus, which would have comprised the Social Security Trust Fund, and has replaced it with non-marketable, special-issue, Treasury securities. And since these special-issue securities are an asset to the Trust Fund and a liability to the U.S. Treasury, they therefore cancel each other out. In other words, since there is no surplus, every dime of Social Security and Medicare tax collected today is spent today, therefore any shortfall rests squarely on the shoulders of the general budget. And as you may know, the general budget is currently more than $15 trillion in arrears.

When the Making Work Pay Credit expired at the end of 2010, it was replaced with the 2% Payroll Tax Cut, as part of the Tax Relief, Unemployment Insurance Reauthorization and Job Creation Act of 2010. The newest tax gimmick allowed a 2% cut in payroll taxes for employees, which reduced the Social Security Tax from 6.2% to 4.2%, without affecting Social Security benefits. But in the big picture, all it really accomplished was to elevate the amount of social welfare tax expenditures already in the tax code, from $171 billion in 2010, to $231 billion in 2011, or by another $60 billion (see table below).

According to an editorial in Bloomberg-Businessweek, the 2% payroll tax cut boosted workers’ take-home pay by $120 billion in 2011. The editors contend that, “… this should stay in force for another year, be extended to the employer portion of payroll taxes, and increased for both employers and employees to a 3% cut.” And further that, “… the payroll tax cut should be widened to temporarily relieve employers of the entire 6.2% levy for new hires and pay raises.” They conclude their unbalanced argument by stating that, “Republicans should be willing to go along. We are talking about tax cuts, after all, that would pump some $240 billion into a struggling economy.”

So in other words, Bloomberg-Businessweek thinks that annual social welfare tax expenditures of $171 billion in 2010, and $231.3 billion in 2011 were not enough. According to the editor’s, social welfare tax expenditures should be increased to $351.3 billion, and conservatives should be willing to go along, to get along. But stepping back from the easel, to gain some aesthetic distance, the inference appears to be that a 10-year tax expenditure of $1,710 billion wasn’t enough, that $2,313 billion is insufficient, and that $3,513 billion is somehow the magic number (assuming that expenditures for the child tax credit and earned income credit remain fixed). I don’t know any true Conservative, in my neck of the woods, which would go along with blowing a bigger hole in the federal budget than already exists, for any reason; especially not to extend another temporary economic stimulus, some 29 months after the recession officially ended.

Endless Stimulus

These days, it’s as if every time a temporary measure expires, its reversal is deemed to be a tax hike. But the expiration of this one-year, one-time, re-election ploy isn’t a tax hike at all; it’s merely the death of what was probably a bad idea in the first place. If we follow the logic that every temporary measure is permanent, then Obama’s entire 2009 stimulus spending binge must represent the new normal, and any reduction in government spending must be deemed a deviation from the norm, and thus a bad thing. But if not a descent towards Greece, where will this road end? Italy? France? Sheol?

I am not sure how the editor’s of Bloomberg-Businessweek arrived at their $120 billion and $240 billion figures, but let’s assume the former is correct. If so, then it would seem to me that since the cost of the 2% tax cut was estimated to have been $120 billion, that upping the employee payroll tax cut from 2% to 3%, and adding an employer tax cut of 3%, would come to more than double the current giveaway. Simple math leads me to a price tag closer to $360 billion [(120 / .02) * .06], than $240 billion. And that doesn’t include adding the 6.2% tax cut on new hires and pay raises, which would up the ante even more. Other than that little boo-boo, the major omission from Bloomberg-Businessweek’s one-sided endorsement of Barack Obama, because that’s what it is, is that any cut in the Social Security payroll tax translates directly into an increase in the budget deficit, and by extension, the national debt.

The following table was extracted from the Social Security Administration’s Consolidated Statements of Changes in Net Position for the Years Ended September 30, 2008 through 2011. If you wish, you may view the actual financial statements by following the links provided at the end of this post. After navigating this rather murky tome, the bottom line, exclusive of appropriations and interest payments derived from the general fund, may be summarized as follows:

The total amount of tax revenues collected dropped from $671.2 billion in fiscal year 2008, to $580.9 billion in fiscal year 2011, or by $90.3 billion. And the total cost of operations jumped to $782.7 billion in fiscal year 2011, from $658.4 billion in fiscal year 2008, or by $124.3 billion. In a nutshell, the fiscal year 2008 annual surplus of $12.8 billion has been transformed into a $201.8 billion annual deficit in just three fiscal years. In fact, expenditures have exceeded revenues by $370.9 billion over the past three fiscal years.

In other words, social security tax revenues have fallen by 13.5%, since 2008, while operating costs have risen by 18.9%. Another way of stating this is that the shortfall in Social Security tax collections, versus expenditures, has widened by 1,678%. This is significant because any shortfall, whether covered by interest on the debt or appropriations, must be siphoned directly from the general budget. In effect, these annual deficits have increased the national debt, while simultaneously compromising the future of our troubled entitlement programs.

Following the wisdom of Bloomberg-Businessweek, and implementing this fraction of Obama’s misnamed American Jobs Act, would add another $120 to $240 billion to what is already a $201.8 billion deficit on the Social Security Administration’s account. The idea of a payroll tax cut is not a bad one in and of itself, for a nation where the net cost of social benefits is on the decline, however under the circumstances, which some of us refer to as reality, it is probably the dumbest idea proffered by the Obama Administration to-date (although that’s pretty much a tossup).

Personally, I can do without the 2% payroll tax cut, since it has done nothing to increase my personal consumption, has accelerated the national debt, and has compromised the future of Social Security. No. I’m not on the band wagon with those harping for more social insurance rebates. Nor am I opposed to a surtax on those making more than $1 million per year, as long as it’s accompanied by a greater amount in spending cuts. What good is an equal increase in both spending and taxes? And what government-manufactured problem would a tax cut for some, and a tax hike on others solve? I say, ‘no good’, and ‘none’. As far as I’m concerned, anyone who votes for either keeping or increasing the payroll tax cut, under any circumstance, short of a 10-fold cut in spending, is an idiot. And anyone against raising taxes on taxable incomes greater than $1 million per year, in exchange for a 10-fold reduction in spending, is devoid of common sense.

References:

Social Security Administration 2011 Financial Statements – http://ssa.gov/finance/2011/Financial%20Statements.pdf

Social Security Administration 2010 Financial Statements – http://ssa.gov/finance/2010/Financial%20Statements.pdf

Social Security Administration 2009 Financial Statements – http://ssa.gov/finance/2009/Financial%20Statements.pdf

Tax Simplification, Part II


Saving $1,756 Billion, Overnight

By: Larry Walker, Jr. –

“There is no doubt that many provisions in the Tax Code benefit narrow groups of taxpayers, but the dirty little secret is that the largest special interests are us – the vast majority of U.S. taxpayers. Virtually all of us benefit from certain exclusions from income, deductions from income, or tax credits.” ~National Taxpayer Advocate

According to Article I, Section 7 of the United States Constitution, “All Bills for raising Revenue shall originate in the House of Representatives; but the Senate may propose or concur with Amendments as on other Bills.” And, according to the 16th Amendment to the Constitution, “The Congress shall have power to lay and collect taxes on incomes, from whatever source derived, without apportionment among the several States, and without regard to any census or enumeration.”

Thus Congress has the power to pass spending bills, and a responsibility to collect taxes on incomes; however the pair should be administered by separate agencies. Anyone with a background in accounting or auditing knows that an adequate internal control system should include proper authorization and segregation of duties. By granting the IRS the dual responsibilities of administering social welfare payments and collecting taxes, Congress has left the door wide open for ineffable fraud.

Since at least 1975, a growing portion of social welfare spending, now to the tune of $1.7 trillion over a 10 year period, is introduced by congressional tax-writing committees and administered by the Internal Revenue Service. Such manipulation has introduced government spending policy into what otherwise would be an exercise in economic measurement. Tax expenditures, by way of refundable credits, represent a deviation from the “tax base”, introduce complexity into the tax law, and impose a spending function on an agency best suited to revenue collection.

Delivering Social Benefits through the Tax System

In the 2010 Annual Report to Congress, National Taxpayer Advocate Nina E. Olson focused on the need for tax reform as the No. 1 priority in tax administration. In particular, she has focused on the problem of delivering social benefits through the tax system, which complicates the mission of the IRS, resulting in a dual mission of welfare administration as well as revenue collection. Elsewhere in the report, the National Taxpayer Advocate recommends that the IRS adopt a dual mission statement and hire personnel appropriate to the delivery of social benefits that already have been codified.

Okay, so let’s stop playing games. Nobody wants to get rid of deductions for mortgage interest, state income taxes, medical expenses, charitable contributions, employee business expenses, or ordinary and necessary business expenses. And as far as officially expanding the mission of the IRS, to social welfare appropriator, on top of being the tax collection arm of the government, we don’t even need to go there. So let’s just cut to the chase. The main problem with the income tax code, today, can be found among three refundable tax credits, at the individual level.

It is important to note that neither of the following are what their names imply: The Earned Income Credit, Child Tax Credit, and Making Work Pay Credit (now known as the 2% Payroll Tax Cut) are not tax credits at all; they are merely social welfare giveaways, administered by the IRS. For the most part, neither represents a refund of income taxes actually paid, as such refunds, when combined, are well in excess of the total amount of taxes paid, including in many cases Social Security and Medicare withholding. Common sense dictates that one cannot refund something which has never been received.

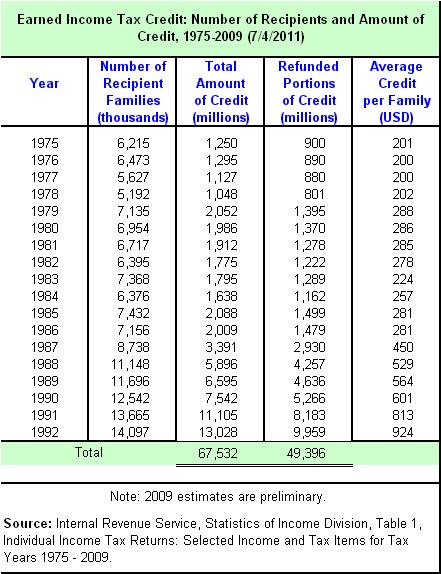
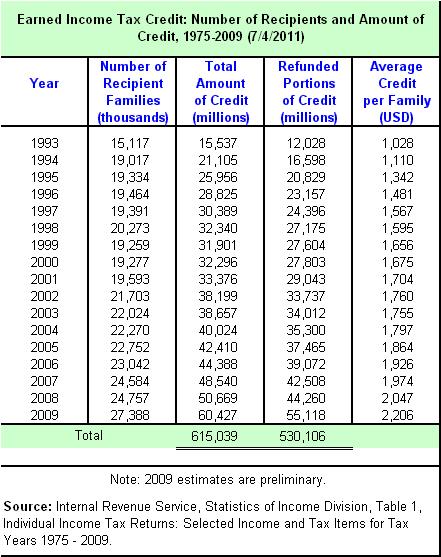
  1. The Earned Income Credit (EIC) was signed into law by President Gerald Ford in 1975. The function of the EIC was to offset the burden Social Security taxes placed on low-income filers with children, and to motivate them to work. The earned income credit has grown to be one of the principal antipoverty programs in the federal budget. The only problem is that it is not a part of the federal budget. In 1975, 6.2 million families received an average credit of $201. In 2009, 27.3 million families received an average credit of $2,206.

  2. The Child Tax Credit (CTC) was enacted as part of the Taxpayer Relief Act of 1997. Congress established the child tax credit to address concerns that the tax structure did not adequately reflect a family’s reduced ability to pay taxes as family size increased. Initially, for tax year 1998, families with qualifying children were allowed a credit against their federal income tax of $400 for each qualifying child. For tax years after 1998, the credit increased to $500 per qualifying child, and was refundable for families with three or more children. The Economic Growth and Tax Relief Reconciliation Act of 2001 (EGTRRA) increased the credit to $1,000 per child beginning in 2003, and extended refundability to families with fewer than three children. It is one thing to want to help lower the income tax burden of families, but entirely another when the burden is reduced below zero.

  3. The Making Work Pay Credit (MWP) was enacted as part of the economic stimulus act (“American Recovery and Reinvestment Act of 2009,” or ARRA). The purpose of the credit is to offset part of the Social Security taxes paid by low- and middle-income workers. MWP provided a refundable tax credit equal to 6.2 percent of earnings (the employee share of the Social Security payroll tax), up to a maximum credit of $400 for individuals ($800 for couples). Couples could claim the full $800 credit, even if only one spouse worked.

Can you say redundant? So let me get this straight – The EIC was implemented to offset the burden Social Security taxes placed on low-income filers with children, and to motivate them to work. The CTC was established to address concerns that the tax structure did not adequately reflect a family’s reduced ability to pay taxes as family size increased. And the MWP was enacted to offset part of the Social Security taxes paid by low- and middle-income workers.

If Social Security and Medicare taxes are collected from all workers, on an equal basis, in order to pay for future benefits, then shouldn’t the act of granting some citizens a premature distribution, of the same, result in a reduction of future benefits? Common sense says it should, but that’s not how this works. Under each of the above tax credits, some citizens are given back all of their Social Security and Medicare payroll contributions, and a portion of their employer’s contributions, and yet they are eligible to reap the full amount of future benefits based on the amount of their rebated contributions.

What’s wrong with this picture? Again, common sense would dictate that, if you don’t put anything into the pot, then you don’t get anything out. And if you put something into the pot, then you should have to wait until age 62, 65, or 67 to obtain a benefit, just like everyone else.

“Don’t be misled–you cannot mock the justice of God. You will always harvest what you plant.” ~Galatians 6:7

Today, the United States is reaping exactly what it has sown. We have a $15 trillion national debt, a $1.5 trillion annual budget shortfall, and social entitlement programs on the verge of bankruptcy. But instead of balancing the budget, reducing the debt, and placing money into trust funds to cover future liabilities, we are giving millions of low-income families a double benefit. First, they are given refundable credits, absolving them from any stake in the future of this nation, and then they are promised benefits in the future, benefits which will be paid for entirely at the expense of others.

If the government wants to provide public assistance benefits for low-income filers with children, and motivate them to work, it should accomplish this through one of its other redundant agencies, it doesn’t need to use the tax code. The refundable tax credits, listed above, are precisely the kind of social welfare expenditures that have no place in tax administration.

According to the Law of Nature, “You will always harvest what you plant.” But as far as the federal government’s logic goes, justice would seem to dictate that either someone else will harvest what you plant, or you will harvest what someone else plants. It’s not even clear, to most American’s, how much is actually being squandered in this seemingly everlasting war on common sense.

Free Money

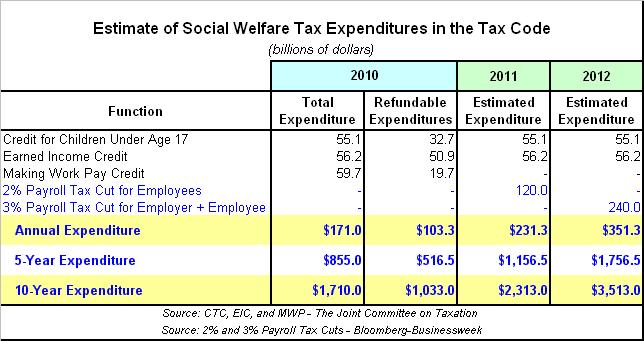
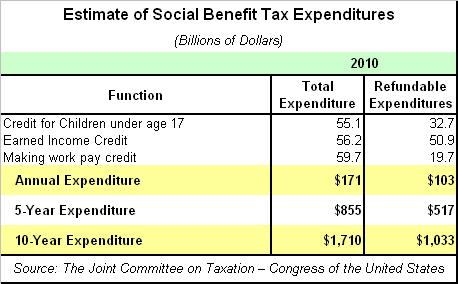
According to the Joint Committee on Taxation, in 2010, the IRS gave away $55.1 billion by way of the Child Tax Credit, $56.2 billion via the Earned Income Credit, and $59.7 billion through the Making Work Pay Credit. That’s a total of $170.9 billion in a single year, $103 billion of which was refundable. Over a 10-year period, we’re talking about $1.7 trillion in tax credits, just over $1 trillion of which is refundable.

Note: Although the MWP expired at the end of 2010, it was replaced with the 2% Payroll Tax Cut beginning in 2011, as part of the Tax Relief, Unemployment Insurance Reauthorization and Job Creation Act of 2010. The new credit allows for a 2% cut in payroll taxes for employees, which reduces the Social Security Tax from 6.2% to 4.2%, without affecting Social Security benefits. When combined with the EIC and CTC, millions of citizens will receive future benefits without having made adequate contributions. No wonder Social Security is on the verge of bankruptcy.

The federal government has thus, not only come up with a way of returning to millions of Americans the full amount of their social security contributions, but an amount well in excess, since millions of households are eligible to receive all three tax credits. Another major flaw, in all of this activity, is that eligibility for the premature distribution of Social Security benefits doesn’t disqualify or limit any of these tax filers ability to receive other Federal and State social benefits (i.e. Public Housing, Medicaid, Food Stamps, and Temporary Assistance for Needy Families).

If the federal government insists on granting relief to “qualifying” citizens through the tax code, then under no circumstances should such tax credits be refundable. As I stated in Part I, “I think it’s enough to not owe any federal income taxes at all. The concept of transferring one man’s tax payment directly to another taxpayer is most detestable, and unnecessary.”

Keep in mind that the refundable tax expenditures above represent amounts over and above the amount of tax initially collected from the affected taxpayers. Thus, these are not income tax refunds at all, they are social welfare payments, confiscated from taxpayers, and handed over to non-taxpayers through the tax code.

Does the act of filing a tax return make one a taxpayer?

The reality is that a great number of tax returns are filed simply to receive refundable tax credits. If there were no refundable tax credits, then it is conceivable that several million tax returns would not need to be filed. And, if millions of citizens were excluded from filing income tax returns, then that would aid in reducing the size of the IRS, and thus the size of government. Isn’t this what most conservatives want?

That brings us to the following questions: How many tax returns are filed each year simply to obtain refunds in excess of taxes actually paid? And, how much money is being squandered in floating social welfare programs through the tax code?

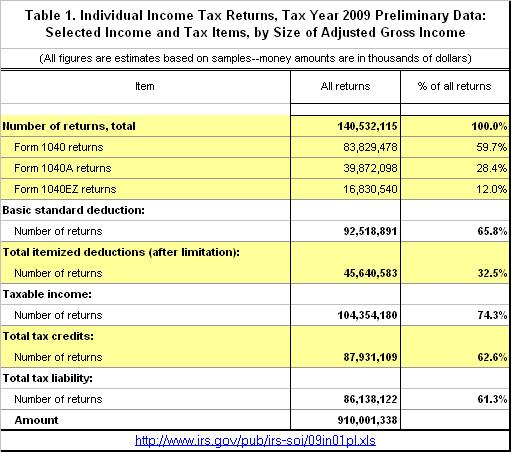
First of all, these days we hear a lot of people whining about the tax code being too complex, so in Part I, we asked the question: How complicated is your tax return? To bring the numbers up to date, we checked the IRS 2009 Data Book (preliminary). We found that for tax year 2009, out of the 140,532,115 individual tax returns filed, only 59.7% filed the more challenging long-form 1040, while 28.4% filed the short-form 1040-A, and 12% filed a simplified form 1040-EZ (see table below). So from this we can see that 40.4% of Americans, who filed 2009 tax returns, filed fairly simple forms.

The data also shows that 65.8% of filers, 92,518,891 out of 140,532,115, utilized the basic standard deduction, while only 32.5%, or 45,640,583, itemized their deductions. It is a fact that only 74.3% of the returns filed contained taxable income, and just 61.3% resulted in an income tax liability. Meanwhile, the majority, 62.6% of filers, claimed tax credits.

With 65.8% of taxpayers claiming the standard deduction, 62.6% claiming tax credits and 40.4% filing simple tax forms, there is potential to eliminate the filing requirements for perhaps as many as 56,702,628 households (the lowest common denominator).

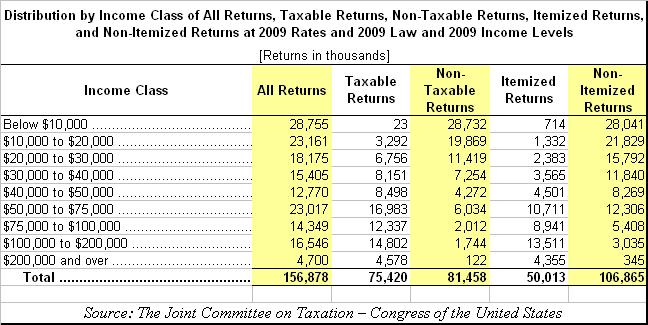
The following table was derived from estimates published by the Joint Committee on Taxation (JCT). You will note that the JCT data reflects the total number of returns as 156.8 million, versus the IRS report of 140.5 million. The reason for the difference is that the JCT estimate includes both filing and non-filing tax units. Non-filing tax units include individuals with income that is exempt from Federal income taxation (i.e. transfer payments, interest from tax-exempt bonds, etc…). Note: The JCT data also excludes individuals who are dependents of other taxpayers and those with negative income.

From this, we can conclude that at least 16 million persons, with positive income, are not required to file income tax returns. This is not complicated to follow. Generally speaking, if a taxpayer’s income is less than the applicable standard deduction, and personal and dependency exemptions, then they are generally not required to file a return. The only reason that a return would be filed, when one is not required, would be to obtain a refund of an overpayment of tax withheld, or to receive a refundable tax credit.

From this data we also learn that 81,458,000 out of the 156,878,000 returns, or 51.9%, were considered to be non-taxable. We can also see that 106,865,000 returns out of the total of 156,878,000, or 68.1%, did not itemize deductions.

Thus, from the perspective of the US Congress, there should be room for the elimination of additional pointless compliance. Since 16 million Americans were already eliminated from annual filing rites, what would be wrong with exempting several more million, especially those who take out of the tax system more than they put in?

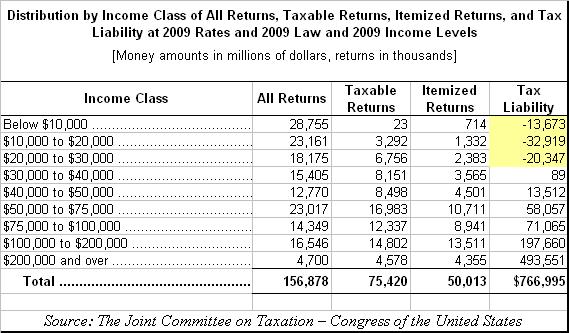
The next chart (above), also from JCT data, shows the distribution of income tax liability by income class. From this, we can see that most of the returns filed, with less than $30,000 in annual income, had negative tax liabilities. In fact, only 10,071,000 returns out of 70,091,000, or 14.4% of those with income under $30,000, were taxable, while 85.6% were non-taxable.

Even more striking is that the returns in this income category had a cumulative negative tax liability of $66.9 billion. We may further infer that almost all of the $71.5 billion in taxes, paid by those who made between $40,000 and $75,000 per year was collected for the sole purpose of being redistributed to those who made less than $30,000.

I submit that the mission of the Internal Revenue Service ought to be to collect what is required to fund the federal government, not to redistribute funds received from some taxpayers directly to others. The fact that federal revenue is being spent before the funds ever hit the US Treasury’s coffers should be alarming.

What should be clear is that removing the filing requirement for approximately 60,020,000 (70,091,000 – 10,071,000) taxpayers would result in federal savings of at least $66.9 billion per year ($669 billion over 10 years). Since the tax code already eliminates the filing requirement for 16,000,000 persons, the potential exists to exclude an additional 44,000,000 (60,020,000 – 16,000,000). But that’s not the end of the story.

Exponential Growth of the EIC

The following table, derived from the IRS 2010 Data Book, shows that in the first 18 years after implementation of the Earned Income Credit, from 1975 to 1992, the IRS expended a total of $67.5 billion, $49.4 billion of which was refundable.

The next table, derived from the same data book, shows that in the subsequent 17 years, from 1993 to 2009, the IRS gave away a total of $615 billion through the EIC, $530 billion of which was refundable. So the amount of EIC spending grew nearly 10-fold in the second period.

The Earned Income Credit has thus grown from initially giving 6.2 million families an average tax credit of $201, in 1975, to granting an average credit of $2,206 to some 27.3 million families, in 2009. With the current level of spending in excess of $60 billion per year, the IRS will give away more, on the EIC, in the next 10 years, than was spent in the first 35 years of the program. Will the spending ever end?

Waste, Fraud, and Abuse

Social benefit programs add complexity to the tax code and represent a large part of tax expenditures, or government spending structured through the revenue system. To address the complexity and other implications of tax expenditures, the National Taxpayer Advocate has recommended, “adoption of a process to evaluate whether a tax expenditure presents an administrative challenge, and if so, the extent to which it achieves its intended purpose”.

I would contend that the answers to her questions are self-evident, and further evaluation is unnecessary. For had the Earned Income Credit been sufficient, then there would have been no need for the Child Tax Credit, the Making Work Pay Credit, or the 2% Payroll Tax Cut. Thus neither program has been effective. Their only accomplishment, thus far, has been to aid in the accumulation of $15 trillion in government debt, a $1.5 trillion budget deficit, and a downgrade to our national credit rating.

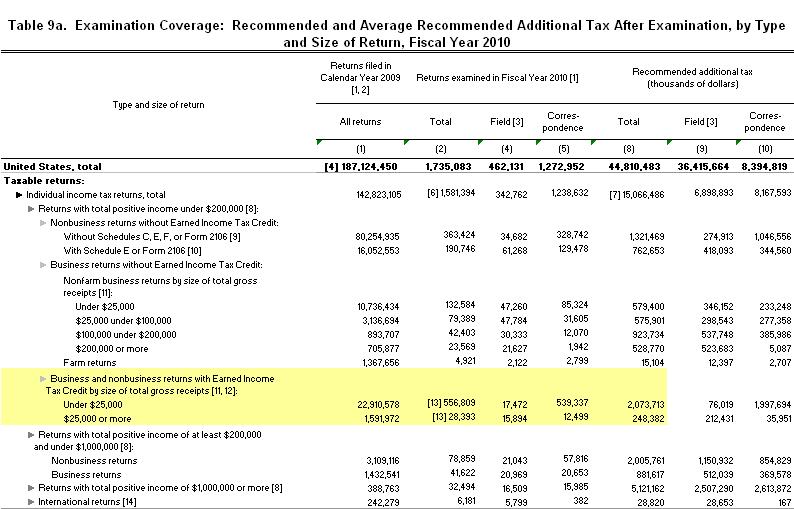
The IRS 2010 Data Book reveals that, in fiscal year 2010, 37% of the 1,581,394 individual returns audited by the IRS, involved the Earned Income Credit (above – click to enlarge). Among these, 556,809 returns had adjusted gross income below $25,000, and 28,393 reported adjusted gross income greater than $25,000. These EIC audits resulted in the recommendation of $2.3 billion in additional taxes.

Thus, eliminating the Earned Income Credit will not only save the federal government $60 billion per year (or $600 billion over 10 years) in tax expenditures, but it will eliminate the needless filing and processing of millions of returns, and reduce the number of audits by 37%. That’s significant in and of itself, but when we tack on elimination of the Child Tax Credit and Making Work Pay Credit (2% Payroll Tax Cut), we are talking about total savings of $855 billion over 5 years, or $1,710 billion over 10 years.

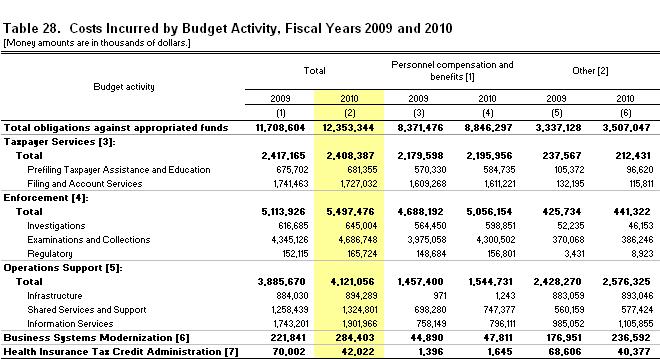
In addition, Table 28, of the 2010 Data Book (above – click to enlarge), shows that the IRS expended a total of $12.4 billion in its fiscal year 2010 operations. Thus elimination of the EIC, on its own, would allow the IRS to reduce its size by 37%, saving taxpayers an additional $4.6 billion per year ($46 billion over 10 years). Add that to the savings realized through elimination of the social welfare benefits associated with the EIC, CTC and MWP and this proposal will save the federal government $1,756 billion over the next 10 years. That’s more than three times my original goal. Problem No. 1 solved.

So what’s the bottom line? The administration of social welfare benefits through the tax code should be suspended immediately. By so doing, Congress will eliminate the unnecessary annual filing of more than 40 million tax returns, save the federal government $1,710 billion in tax expenditures, reduce the budget of the IRS by $46 billion, and will accomplish all of this without raising taxes, or eliminating critical spending programs.

References:

The Joint Committee on Taxation – Congress of the United States

IRS 2010 Data Book

National Taxpayer Advocate – 2010 Annual Report to Congress: Volume 2

Related:

Study: Michigan among states scaling back low-income tax credits

Tax Simplification, Part I

9-9-9 Plan | Prejudiced and Convoluted?

– By: Larry Walker, Jr. –

“A tax loophole is something that benefits the other guy. If it benefits you, it is tax reform.” ~Russell B. Long –

Herman Cain’s 9-9-9 Plan, which involves eliminating the 15.3% payroll tax, of which every dime is presently committed to current Social Security and Medicare payments (and then some), fails to address the main problem with modern day governing – the budget. Since it was just barely 3 months ago when our nation faced its first ever credit downgrade, any tax reform proposal which doesn’t lead to a balanced budget should be pronounced dead on the campaign trail. Replacing a 35% corporate income tax, a 35% personal income tax, and a 15.3% payroll tax, with 9-9-9, not only doesn’t balance the federal budget, but it shifts the burden of federal revenues to those who can least afford it. All that the 9-9-9 Plan really accomplishes is to disproportionately favor the well-off, while punishing the middle class, the working poor, children and the elderly.

I am well aware that some conservatives believe Herman Cain is a gifted mathematical genius, who has it all figured out. And I know that many have bought into his 9-9-9 proposal, without hardly any scrutiny. “Anything is better than what we have now”, some say. Even if it doesn’t make any sense to them, and even though many experts have disputed its claims, an element of conservatives have bought it, lock, stock, and barrel. But I’m not buying it. Herman Cain is human, and no human being is perfect. And to the chagrin of many, there isn’t any such thing as a perfect tax system. For whether a tax is progressive, flat, or regressive, each method involves tradeoffs. There are winners and losers under any policy. And besides, the concept of a flat tax turns out to be nothing more than a myth; there is simply no such thing, as we shall see.

I have never been one to settle for second best. I believe that there is an easier way to achieve the kind of tax simplification that most conservatives really want, a way which is in line with fiscally conservative objectives. And it’s something that could be achieved right now, today. I was never a proponent of taxing those who can’t afford it. The argument that 40% of taxpayers don’t pay any income tax was proffered to counter Barack Obama’s contention that he was going to give 90% of Americans a tax cut. The statistic was used in support of the common sense principle that, you can’t cut income taxes for someone who doesn’t pay income taxes. That was it, and I stand on that to this day. The 40% figure was never intended as a justification for forcing blood from turnips.

But ever since Herman Cain introduced his 9-9-9 Plan, I have heard a few conservatives argue that the poor need to pay their “fair share”. However, my only contention has been that the poor should not be receiving refunds of taxes they never paid. I think it’s enough to not owe any federal income taxes at all. The concept of transferring one man’s tax payment directly to another taxpayer is most detestable, and unnecessary. I have heard a few other conservatives’ state that they don’t care whether or not the federal government can pay its bills. They contend that if the government takes in less money under the 9-9-9 Plan, that Washington DC will be forced to spend less. But that’s not where I stand.

The federal government is already taking in $1.5 trillion less than it spends, so how would Herman Cain’s revenue reduction strategy fix this? It won’t. So the first step (Part I) towards tax simplification is to expose the shortcomings of the 9-9-9 Plan and other flat tax schemes. The second step (Part II) is to outline a plan for tax simplification which will not only eliminate unnecessary compliance, but will in the process, save the federal government $500 billion over 10 years.

Testing Cain’s 9-9-9 Plan

Cain’s main assumption is that the U.S. Tax Code is too complex and should therefore be thrown out and replaced, baby and bathwater. So in other words, he has given up on all other options of reforming the current tax code, and is advocating a radical transformation. I don’t know about you, but I’ve had about enough of fundamental transformations by radicals, on either end of the compass. We all know how Obama’s dream has worked out, but now, instead of simply taking our country back; some conservatives are exhibiting a rather disturbing desire for even more extraneous change.

Whenever a superfluous change is proffered, the first question among conservatives ought to be, “Has it ever been tried before?” And if it has been tried, then this should be followed up with, “How well or how poorly did it work?” But if said change has never been tried, then how would a conservative determine whether or not it would succeed? Well, if a proposed policy has been attempted we just need to analyze the data, and if it has not been tried, then we would simply need to locate and analyze the most similar comparables.

For example, we know that Communism has been tried before, and we know how that worked out. And we know that Universal Health Care plans have been implemented, and we know how they worked out. Real conservatives generally rely on facts and evidence rather than rhetoric. But so far, all we have heard from Herman Cain, and proponents of his 9-9-9 Plan is assertion and rhetoric, rather than analysis and evidence. When challenged, most of them simply resort to name calling and innuendo. But why is no one talking about how combination “flat / consumption tax” plans have fared elsewhere in the world? Well, lucky for us such plans have already been implemented, so there is already evidence available attesting to how well, or in this case, how poorly they have performed.

Flat Tax: Fact or Fallacy?

Most of the EU member states have “progressive” systems under which earners pay higher income tax rates on increasing levels of income. However, seven EU countries – Bulgaria, Czech Republic, Estonia, Latvia, Lithuania, Romania and Slovakia – have had “flat tax” systems in place, some for more than a decade. According to a recent study, ‘Workers’ salaries are taxed at higher rates in “Flat Tax” countries than in “progressive” systems’. This is simply a fact, based on analyzing the evidence, not mere rhetoric.

When it comes to Herman Cain’s Plan, as we have repeated three times previously, according to a study on the 9-9-9 Plan conducted by the non-partisan Tax Policy Center:

  1. “The 9-9-9 Plan would cause 95 percent of people making $1 million or more to receive tax cuts averaging $487,300,” and
  2. “Only 16 percent of people making between $50,000 and $75,000 a year would get a tax cut, averaging $1,959, and at least 70 percent of people in this middle-income category would see their average federal taxes rise by $4,326.”

Conservatives who dispute this claim have, thus far, failed to provide any evidence to the contrary.

It should be noted that flat taxes in the seven EU countries generally apply only to the income tax, as none of the seven have eliminated social security taxes. For example, Slovakia has an individual and corporate “flat tax” rate of 19%, but its employers pay a 35.2% contribution to social security, and in addition to the flat income tax its employees have 13.4% of their pay deducted for social security. Add to that Slovakia’s 19% Value Added Tax (VAT) and you have the full package. When you total it all up, the average worker in Slovakia pays total taxes, as a percentage of real gross income, of around 45.5%. So if tax rates are so high in Slovakia that its plan equates to a 19-35.2-19-13.4-19 Plan, then what makes proponents of the 9-9-9 Plan think that it can cover all of the obligations of the United States with such dramatically lower rates? Do they have any evidence, or just words?

In 2006, the International Monetary Fund (IMF) published a working paper by Michael Keen, Yitae Kim, and Ricardo Varsano entitled, The “Flat Tax(es)”: Principles and Evidence. The study describes the world’s most recent flat tax adoptions as, “quite radical reforms, marked more by assertion and rhetoric than by analysis and evidence.” In other words, public opinion has been swayed, more by confabulation than by a careful assessment of facts. Two of the conclusions of the study were as follows:

  1. “In no case does there appear to have been a Laffer effect: these reforms have not set off effects strong enough for them to pay for themselves.”
  2. And, “looking forward, the question is not so much whether more countries will adopt a flat tax, as whether those that have will move away from it.”

So the dynamic implications associated with Cain’s 9-9-9 Plan probably won’t materialize, based on available evidence. And today’s proponents of the flat tax have conveniently chosen to ignore the experiences of other countries. If countries who adopted flat tax policies in the 1990’s are on the verge of returning to “progressive” systems, then isn’t it entirely possible that our current tax framework is already the best in the world? And why wouldn’t it be? Are we not, after all, exceptional?

Tax Simplification

In terms of tax simplification, the authors of the IMF working paper concluded that, “the rate structure itself is commonly not the primary source of complexity in taxation. This comes more from exemptions and special treatment of various kinds. For example, the (limited) survey evidence for Russia does not suggest that the system was widely seen as significantly less complex after adoption of the flat tax.” Herman Cain has already modified his plan to provide exemptions for individuals and businesses associated with “empowerment zones”. He has also included a deduction of dividends for businesses, an exception for capital gains, an exclusion of charitable contributions for individuals, and others, but these are most likely just the tip of the iceberg.

How will the government determine which areas qualify as empowerment zones? Will there eventually be a push for additional exemptions for poor people who reside outside of empowerment zones? What about allowing a deduction for charitable contributions at the corporate level? Then there will likely be an outcry for exemptions for college students, widows, widowers, the elderly, active military, and on and on. Overtime, the overly simplistic 9-9-9 Plan may become more complicated than our present system. One need only examine the Russian experiment to see how convoluted a “simple” flat / consumption tax system may become. What other exemptions will be granted, and how will those be calculated?

As pointed out in the IMF working paper, the presence of a tax-free threshold means that there are really two marginal tax rates (one of them being zero), so that problems of tax arbitrage, withholding and averaging do not disappear under flat tax regimes. There will still be complications, such as in arranging proper withholding from those with multiple jobs (to ensure that they receive the tax-free amount only once). In Cain’s 9-9-9 outline, he states that there will be exemptions for people who either live within, or work within empowerment zones. So where an individual lives outside of an empowerment zone, but works at one job within a zone, and a second job outside of the zone; or where a business owner lives outside of an empowerment zone, but owns multiple businesses located within and outside of such zones, it is possible that the 9-9-9 Plan will create more complexities, not fewer.

Public Servants and Ministers: 0-18-9

Back in the 1990’s when the United States Congress last considered the flat tax, a paper was written entitled, Flat Tax: An Overview of the Hall-Rabushka Proposal. It was written by Mr. James M. Bickley, for Members and Committees of Congress. In the paper, Mr. Bickley affirmed that, “in some instances, a flat tax can be more complicated (rather than simpler) than the tax it replaces”. For example, he points out, that employees of federal, state and local governments, and non-profits would have to add to their wage base the imputed value of their fringe benefits. “Hence, a separate individual wage tax form would be necessary for these employees.” He adds that, “The actual calculation of the imputed value of fringe benefits would be complicated.”

As I mentioned previously, since businesses are not allowed to deduct wages for tax purposes under the 9-9-9 Plan, and since government entities, and non-profits don’t pay income taxes, the simple rule of not allowing a deduction for wages would have no effect upon them. However, under our present tax system, because employers pay a matching portion of Social Security and Medicare payroll taxes, all employers are on equal ground, where they would not be under the 9-9-9 Plan. So how will this be resolved? Will government employees, ministers, and other non-profit employees be taxed at higher rates in order to make up the shortfall? Or will those who actually pay taxes under Cain’s plan unknowingly subsidize such entities? In this matter, Cain’s proposal becomes more complicated, not simpler.

To give us a better idea of the complexity surrounding non-taxable entities, as of the 3rd quarter of 2011, per Table 2.2B – Wage and Salary Disbursements by Industry, the U.S. Bureau of Economic Analysis estimated that the annualized amount of wages and salaries paid in the U.S. was $6.7 trillion. However, out of this amount, $1.2 trillion (or 18 percent) was paid by federal, state and local governments. And according to the National Center for Charitable Statistics, employees of nonprofit organizations would account for 9 percent, or roughly $670 billion of the wages paid in the U.S (2009 data). So overall, without additional rules and regulations, roughly $1.8 trillion of wages paid by governments and non-profits would escape Cain’s 9% business flat tax. Since tax exempt entities don’t pay income taxes, government workers may have to pay additional taxes on their benefits in order to be on a level playing field with private sector employees. Thus, describing the 9-9-9 Plan as “simple and fair” may be a gross overstatement.

How complicated is your tax return?

In his flat tax analysis prepared for Members and Committees of Congress, Mr. Bickley admits that the current income tax system is complex. He is sympathetic to the fact that the federal tax code and regulations are lengthy and continue to expand. He agrees that many taxpayers spend much time, money, and effort complying with the current income tax system. And that the complexity of the tax code and the fear of the Internal Revenue Service (IRS) have caused many taxpayers to pay for professional assistance. I generally concur, but let’s review the facts.

For tax year 2000, a micro-simulation model developed jointly by IBM and the IRS estimated the amount of time and money that individuals spend on federal tax compliance. The authors found that “in tax year 2000, 125.9 million individual taxpayers experienced a total compliance burden of 3.21 billion hours and $18.8 billion.” This translates into an average burden of 25.5 hours and $149 per taxpayer. These are just averages, but it doesn’t sound like that much when broken down to the individual level. For example, when compared to the 9-9-9 Plan, which would raise taxes by an average $4,326 on 70% of people making between $50,000 and $75,000, I would hardly call spending 25.5 hours or paying $149 for assistance a huge burden. The big question is – How many Americans would rather pay $4,326 more in taxes, than spend a couple of weekends preparing their own tax return, or pay less than 4% of that amount for assistance?

Furthermore, I agree with Mr. Bickley that, “the complexity of the income tax should not be overstated.” For example, in tax year 2003, only 59.4% of taxpayers (78.75 million out of 132.38) paid for the preparation of their returns. Yet for tax year 2004, the Internal Revenue Service reported that only 34.8% of tax returns (46.19 million out of 132.38 million) were filed by individuals who itemized their deductions. That means roughly 32 million, or 24% of taxpayers paid for tax preparation when they could have simply filed their own 1040-EZ, or short-form 1040-A, which are far from complex.

Are IRS Forms 1040-EZ and 1040-A so complex that 32 million Americans have to pay to have them prepared? I think not. These are after all akin to yesterdays versions of Rick Perry’s postcard sized tax return. You know as well as I do that the reason at least 24% of taxpayers pay to have their tax returns filed is not due to complexity, but rather because they want to receive a refund as quickly as possible, and with the least possible effort. In other words, for at least 24%, paying for tax assistance is a matter of convenience, not a burden. I must admit that cleaning my home and mowing my yard are not that burdensome, and I am pretty adept at either, nevertheless, I choose to pay a housekeeper and gardener. There are things I could do for myself that I would rather not. We shall revisit the 24%, and deal with the remaining 76% in Part II.

In conclusion, no matter how simple Herman Cain’s 9% business flat tax, 9% individual flat tax, and 9% national sales tax sounds, under his proposal some citizens would be covered by a pure 9-9-9 tax; while empowerment zone residents, workers, and businesses would be subject to either 9-0-9, 0-9-9, or 0-0-9 plans; and employees of governments and non-profits may be subordinated to something resembling a 0-18-9 plan. The point is that, what portends to be “fair and simple” may turn out to be “prejudiced and convoluted”, or in other words worse than our present system.

To be continued in – Tax Simplification, Part II

References:

http://www.taxpolicycenter.org/taxtopics/upload/412426-Cain-9-9-9.pdf

http://www.langlophone.com/20100526_edition/20100526_EU27_data_table_flipped.pdf

http://congressionalresearch.com/98-529/document.php?study=Flat+Tax+An+Overview+of+the+Hall-Rabushka+Proposal

http://www.imf.org/external/pubs/ft/wp/2006/wp06218.pdf

Obamas 9-9-9 Tax Cut | For the Blind

***2nd Revision***

Even our brightest may be deceived! ~Anonymous Blogger –

By: Larry Walker, Jr. –

Continued from: 3rd Concern with the 9-9-9 Plan

Mr. Cain’s main argument against the fact that his plan redistributes wealth from the poor to the rich is that, “it does no such thing.” But what does that mean? Simply stating “it does no such thing” doesn’t satisfy the anxiety. The real concern is that since the top 1% of income earners pay 38% of all income taxes, and because the 9-9-9 Plan reduces their tax rate by 74%, while at the same time exempting empowerment zone residents, that either a greater burden of taxes will be borne by the middle class and working poor, or the United States will go down in flames in a matter of weeks instead of years.

According to a study on GOP flat tax proposals conducted by the non-partisan Tax Policy Center, the 9-9-9 Plan would cause ’95 percent of people making $1 million or more to receive tax cuts averaging $487,300′. The dilemma is that since Mr. Cain claims his plan to be revenue neutral, that is to say, the amount of total taxes collected today will be the same under his plan, then where will the money come from to make up the shortfall? You guessed it! From the same study conducted by the Tax Policy Center –

“Only 16 percent of people making between $50,000 and $75,000 a year would get a tax cut, averaging $1,959, and at least 70 percent of people in this middle-income category would see their average federal taxes rise by $4,326.”

So I guess Mr. Cain better hope that the middle class, who are busy working everyday and taxed enough already, aren’t paying too much attention to his claims. But I don’t think that’s the case. Perhaps Mr. Cain needs to go back to the drawing board. So here’s what the Obamas actual 2009 tax return would look like against the 9-9-9 Plan.

When you remove a 15.3% payroll tax, a 35% corporate tax, and a 35% individual tax and replace them with 9-9-9, it doesn’t measure up. In order for the Obamas to make up the shortfall they would have to spend $14,755,022 on items subject to the 9% national sales tax (take the tax cut of $1,327,952 and divide it by 9%). That’s almost 3 times their current gross income. So unless the Obamas run out and buy a new house, or otherwise figure out how to spend 3 times more than they make, on items subject to the sales tax, that revenue will never come back from them. The government will either go broke, or the middle class – 70% of those making $50,000 to $75,000 – will really end up paying $4,326 more in taxes, just like the Tax Policy Center said.

As you know (or maybe not), like many others, not all of the Obamas income is from wages paid by an employer. Actually all $374,460 of his wages were paid by US taxpayers. The other 9% tax on his self-employed business income is already included in the table. Obama’s business didn’t really have any expenses, so no sales tax would be collected there. So did taxing the Obamas self-employed business income the other 9% make up the shortfall? No. So will the 9-9-9 Plan tax the federal government for the other 9% on Obama’s wages in addition? No.

Does the federal, or do state and local governments even pay income taxes? No. So under the 9-9-9 Plan, what tax return will government entities not be allowed to deduct wages from? When it comes to government workers, their employers will not be paying the other 9%, because their employers don’t pay income taxes. You can add other tax exempt organizations to that list as well. And when it comes to the self-employed, and small business owners, some will benefit and some won’t. Those who make more than $330K will clearly benefit more under 9-9-9, while most everyone else will pay higher taxes. That’s why this dog won’t hunt.

By proof, policies have consequences – The 999-Plan will create a host of unintended social problems which naturally occur on the other end of Laffer’s curve. Giving average tax cuts of $487,300 to 95% of people making over $1 million per year, and increasing the tax burden on the working poor and middle-class, solves nothing. Yes I am a conservative, and if you don’t believe it then read the rest of my blog. I’m not too sure how to classify Mr. Cain’s 9-9-9 Plan, but from my point of view, 9-9-9 is not a conservative plan, and not something that conservatives should even be considering. Had Mr. Cain not risked his entire campaign upon this flimsy reed; he might have had my support. But if Herman Cain is somehow able to win the Republican Party nomination, I’ll be casting my vote for the first viable 3rd party candidate.

Source:

http://www.whitehouse.gov/sites/default/files/president-obama-2010-complete-return.pdf

3rd Concern with the 9-9-9 Plan

Conservatives vs. 999ers

By: Larry Walker, Jr. –

Under the 9-9-9 Plan, “95 percent of people making $1 million or more would get a tax cut that averaged $487,300.” ~Tax Policy Center

At a Michigan website entitled, North Star Writers Group, Herman Cain attempted to address some of the criticism to his 9-9-9 Plan. The article, dated October 16, 2011, is entitled, “9 responses to 9 false attacks on the 9-9-9 plan”. But somehow Mr. Cain has confused what is merely constructive criticism with “attacks”. I mean it’s as if when one asks Mr. Cain a valid question these days, he either gets it wrong the first time, or he simply pulls the ‘assault card’. Yet, after I criticized Mr. Cain’s plan (not him personally), when I wrote an article entitled, “Herman Cain’s 9-9-9 Sham”, I was personally labeled as a Marxist, Communist, as naïve, an idiot, and a left-wing shill. And all of that came from fellow, so called, conservatives. So has Mr. Cain’s plan really been “attacked”, or are perhaps the 9 concerns, which he deems to be false attacks, simply valid points?

Personally, I think that when conservatives start calling fellow conservative’s naïve, Communist, Marxist, idiots, and left-wing shills somebody’s got a problem. To contrast, the article I wrote immediately prior to my critique of Mr. Cain’s tax plan was entitled, “Obamacare’s Deadweight Loss”, and with that I was practically branded as a conservative champion, by way of private commentary. But apparently, sometime between October 12th and October 23rd, I either lost my mind, or I unwittingly signed on with the Communist Party USA. I’ll let you decide. Okay, so today I’m not going to list all 9 of the concerns that many have with the 9-9-9 Plan, but just the 3rd, and Mr. Cain’s response.

Claim 3: The plan redistributes wealth from the poor to the rich.

Response: “It does no such thing. It is fair and neutral, taxing everything once and nothing twice. What’s more, we are getting ready to propose empowerment zones for economically struggling areas in which the rates will be even lower. That will allow the poor to benefit even more from the plan than they already would.”

Mr. Cain’s main argument against the fact that his plan redistributes wealth from the poor to the rich is that, “it does no such thing.” But what does that mean? Simply stating “it does no such thing” doesn’t satisfy the anxiety. The real concern is that since the top 1% of income earners pay 38% of all income taxes, and because the 9-9-9 Plan reduces their tax rate by 74%, while at the same time exempting empowerment zone residents, that either a greater burden of taxes will be borne by the middle class and working poor, or the United States will go down in flames in a matter of weeks instead of years.

Also, according to Mr. Cain, “it is fair and neutral, taxing everything once and not twice”. But this is simply not true. As proof, since the 9-9-9 Plan doesn’t allow businesses to deduct wages in determining taxable income, it in effect imposes a 9% tax on wages at the corporate level, and then taxes wages again at the individual level. So how is this not taxing something twice? And further, when the same wages are spent into the economy, they are hit again by a 9% national sales tax. So wages are not only taxed once or twice under Mr. Cain’s plan, but at least three times. Following are two hypothetical examples of what the 9-9-9 Plan will accomplish when it moves from Cain’s chalkboard to the real economy.

Example 1

For example, in the table below, a couple has wages of $1,000,000 and only claims the standard deduction and personal exemption(s). Under the current tax code they would pay federal taxes of $334,043, and only $90,000 under the 9-9-9 Plan. Thus, under Mr. Cain’s plan, this couple would receive a tax cut of $244,035. And in order to make up for the shortfall in revenue, by way of his national sales tax, the couple would need to spend $2,711,500 (244,035 / .09) on items subject to the 9% sales tax, or almost three times the amount of their earned income.

Example 2

Since under the current tax code, the taxpayer’s in the first example are already in a 35% marginal tax bracket, if they earned an additional $1,000,000, they would pay federal taxes of $698,543 under the current tax code, versus $180,000 under the 9-9-9 Plan. So under Mr. Cain’s plan, this couple would receive a tax cut of $518,543 (see table below). And in order to make up for the shortfall in revenue, by way of the national sales tax, the couple would need to spend $5,761,588 (518,543 / .09) on items subject to the 9% sales tax, or almost three times the amount of their earned income.

According to a study on GOP flat tax proposals conducted by the Tax Policy Center, the 9-9-9 Plan would cause ’95 percent of people making $1 million or more to receive tax cuts averaging $487,300′. The dilemma is that since Mr. Cain claims his plan to be revenue neutral, that is to say, the amount of total taxes collected today will be the same under his plan, then where will the money come from to make up the shortfall? You guessed it! From the same study conducted by the Tax Policy Center –

“Only 16 percent of people making between $50,000 and $75,000 a year would get a tax cut, averaging $1,959, and at least 70 percent of people in this middle-income category would see their average federal taxes rise by $4,326.”

So I guess Mr. Cain better hope that the middle class, who are busy working everyday and taxed enough already, aren’t paying too much attention to his claims. But I don’t think that’s the case. Perhaps Mr. Cain needs to go back to the drawing board.

Laffer’s Folly

In a second article written in the same venue entitled, “Arthur Laffer brings reality to 9-9-9 discussion”, Mr. Cain states that, “Contrary to some of what you hear in current conversation, the theory of the Laffer Curve was proven correct when Ronald Reagan cut marginal tax rates across the board in 1981, and federal revenues soared. So did deficits, of course, and that’s the part you usually hear about. But that’s because federal spending soared even more. Excessive spending, not insufficiently high tax rates, was the problem then and it’s still the problem today.”

Notice how Mr. Cain implies that it was “not insufficiently high tax rates” that was the problem back then, or today. That’s a double negative, but doesn’t Mr. Cain’s statement refute his own plan? If tax rates are not the problem today, but rather excessive government spending, then why are we even talking about a 9-9-9 Plan? A few month’s ago, conservatives were in unity behind a platform of not raising the Bush tax rates, and reducing government spending. Yesterday it was, “We don’t have a revenue problem; we have a spending problem.” But now, suddenly, it seems that many conservatives believe that all of our problems can be solved through Mr. Cain’s proposed wealth displacement. So does Mr. Cain’s plan balance the federal budget? Will it fix Social Security and Medicare’s solvency issues? If the answer is no, then what is the point?

Laffer’s curve – In the 1981 Act, Reagan cut the top tax rate from 70% to 50%, and closed many loopholes. He didn’t propose cutting the top rate to 9% and adding a 9% national sales tax. Reagan later raised the bottom rate from 0% to 15%, and cut the top rate down to 28%. But his plan was reasonable, while Cain’s proposition is extreme. On its own merits, the 9-9-9 Plan is extreme enough to fall off the other end of Laffer’s curve. Laffer defined a sweet spot somewhere in the middle – as when tax rates are too high, tax revenues decrease, and when tax rates are too low, tax revenues decrease, but when tax rates are just right, revenues will increase. But I believe that Cain’s plan overshoots the sweet spot by a long shot. In other words, if Reagan Era tax rates were the mark, and I believe that they were, then why not just bring them back?

Policies have consequences – The 999-Plan will create a host of unintended social problems which naturally occur on the other end of Laffer’s curve. Giving average tax cuts of $487,300 to 95% of people making over $1 million per year, and increasing the tax burden on the working poor and middle-class, solves nothing. Yes I am a conservative, and if you don’t believe it then read the rest of my blog. I’m not too sure how to classify Mr. Cain’s 9-9-9 Plan, but from my point of view, 9-9-9 is not a conservative plan, and not something that conservatives should even be considering. Had Mr. Cain not risked his entire campaign upon this flimsy reed; he might have had my support. But even if Herman Cain is somehow able to win the Republican Party nomination, I’ll be casting my vote for the first viable 3rd party candidate.

Related:

Herman Cain’s 9-9-9 Sham