Has Obama’s Loot-and-Plunder Theory Worked?

A 50-Year Retrospective

– By: Larry Walker, Jr. –

“Socialism is a philosophy of failure, the creed of ignorance, and the gospel of envy, its inherent virtue is the equal sharing of misery.” ~ Winston Churchill ::

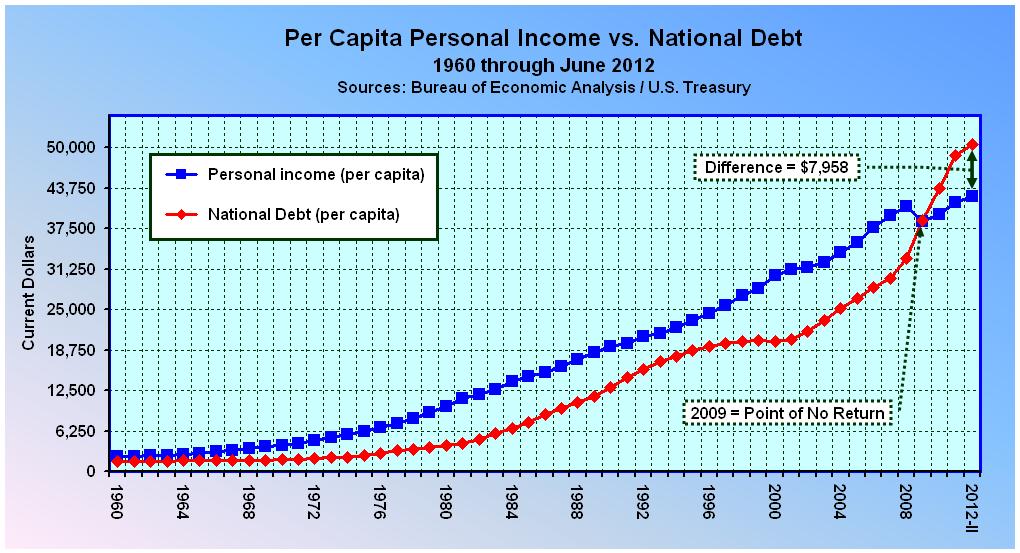
Discussing his economic policies at a fundraiser in Oakland, California on July 23rd, Barack Obama, told supporters that, “We tried our plan, and it worked.” Yet, by the end of his first year in office, he had only managed to drag America, kicking and screaming, beyond the point of no return, as our National Debt, on a per capita (per person) basis, surpassed per capita Personal Income for the first time in more than 50 years (see chart above). As of June 30, 2012, after nearly four years of disservice to the nation, under the leadership of Barack Obama, every American now owes $7,958 more in federal government debt, on a per capita basis, than their personal income.

Per Capita National Debt to GDP

Equally alarming, as of June 30, 2012, the U.S. National Debt per capita reached a stunning 101.7% of Gross Domestic Product, an increase of 45.1% since the end of 2008. Looking back over the last half-century, no other President of the United States has done more to destroy our standard of living than Barack Obama. Now if that was his goal, then yes – it worked like a charm. However, this temporary condition will soon meet its demise.

Gross Domestic Product (GDP) is the market value of all officially recognized final goods and services produced within the United States. GDP per capita is considered an indicator of our nation’s standard of living. As of June 30, 2012, U.S. GDP per capita was equal to $49,672. The National Debt is the sum of all previously incurred annual federal deficits. Since deficits are financed by government borrowing, either from the public or from itself, the national debt is equal to all government debt outstanding. As of June 30, 2012, the U.S. National Debt per capita was equal to $50,502.

Thus, it may be stated that, as of June 30, 2012, the standard of living of the United States is negative. In other words, when taken as a whole, on a per capita basis, for the first time in more than a half-century, Americans now owe more in federal government debt than we produce. In effect, there isn’t anything left to address the growing mountain of state and local government, personal and business arrearages.

Granted that Barack Obama and a tiny remnant of gullible far-left loyalists have devised numerous excuses as justification for this atrocity, one way of accurately measuring the validity of such subterfuge is to simply compare the ratio of per capita National Debt to GDP over the last half-century. After all, it was Barack Obama who said of supply-side economics, a theory which has been deployed during most of the 1960’s through 2007, “We tried this trickle-down fairy dust before, and guess what — it didn’t work then, it won’t work now… It’s not a plan to lower the deficit…” Well, let us test this hypothesis on a relative basis, and see just how well his loot-and-plunder theory stacks up.

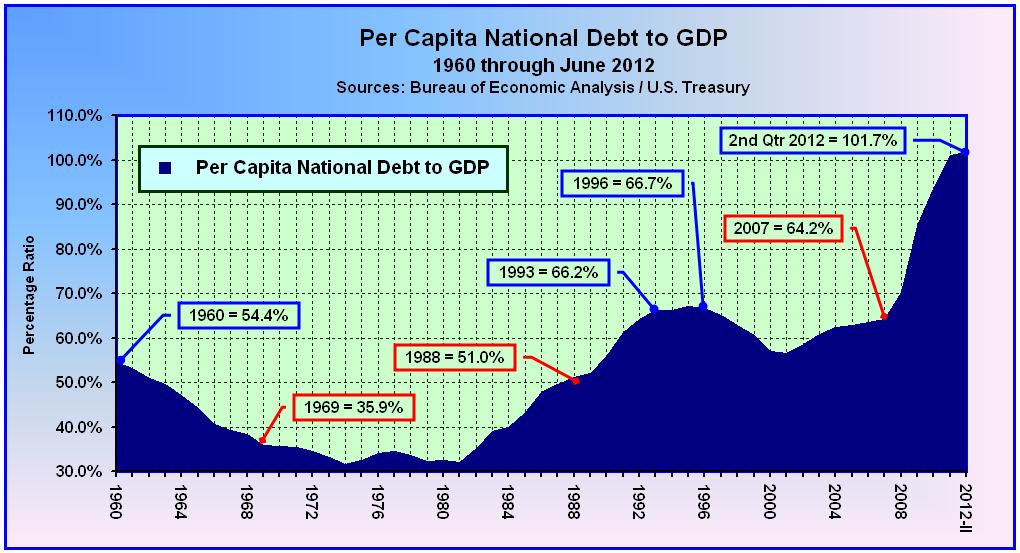
A quick study of the chart above, Per Capita National Debt to GDP: 1960 through June 2012, tells the whole story.

Testing Obama’s Theory

  1. At the end of 1960 per capita National Debt to GDP was equal to 54.4%.

  2. John F. Kennedy’s Tax Reduction Act of 1964 was signed into Law by his successor Lyndon B. Johnson. Under the ensuing era of lower tax rates, by the end of 1981, per capita National Debt to GDP declined all the way to 31.9%.

  3. Ronald W. Reagan’s Economic Recovery Tax Act went into effect in 1982, and even though government spending was higher than he would have liked, by the end of his term in 1988, per capita National Debt to GDP stood at just 51.0%.

  4. In 1993, Bill Clinton signed the Deficit Reduction Act, which turned out to be nothing more than a tax hike. By the end of 1996, per capita National Debt to GDP had increased to 66.7%.

  5. Then in 1997 the Republican-led Congress passed a tax-relief and deficit-reduction bill that was resisted but ultimately signed by President Clinton. One of the things the 1997 bill did was lower the capital gains tax. It was actually the 1997 tax cut, not the 1993 Clinton tax hike, which produced the boom of the 1990’s. By the end of the year 2000, per capita National Debt to GDP declined to 57.0%.

  6. In 2001, George W. Bush signed the Economic Growth and Tax Relief Reconciliation Act. By the end of 2001, per capita National Debt to GDP decreased to 56.5%, and later increased slightly to 58.5% in 2002.

  7. The following year, George W. Bush signed the Jobs and Growth Tax Relief Reconciliation Act of 2003, which provided the tax rates in effect today. By the end of 2007, per capita National Debt to GDP held at just 64.2%.

  8. In 2009, Barack H. Obama signed the American Recovery and Reinvestment Act (ARRA). The primary objective for ARRA was to save and create jobs almost immediately. Secondary objectives were to provide temporary relief programs for those most impacted by the recession and invest in infrastructure, education, health, and ‘green’ energy. The cost of the economic stimulus package was estimated to be $787 billion at the time of passage, but was later revised to $831 billion. By the end of 2009, per capita National Debt to GDP increased to 85.2%.

  9. The following year, Barack H. Obama signed the Tax Relief, Unemployment Insurance Reauthorization, and Job Creation Act of 2010, which extended long-term unemployment benefits and cut the employee’s portion of the Social Security payroll taxes by 2.0%. By the end of 2010, per capita National Debt to GDP increased to 93.5%. By the end of 2011 the ratio had increased to 101.0%, and by June 30, 2012, per capita National Debt to GDP notched up by another seven tenths of a percent to 101.7%.

Ever since Barack Obama implemented his plan, America’s standard of living has gone straight down the tubes. And since he said, “We tried our plan, and it worked…,” we are forced to conclude that his goal was to destroy America’s standard of living. If for some reason this wasn’t his goal, then a more honest assessment would have been, ‘We tried our plan, and it failed.’

When Barack Obama said, “We tried this trickle-down fairy dust before. And guess what — it didn’t work then, it won’t work now… It’s not a plan to lower the deficit..,” whose policies could he possibly have been referring to? A quick study of U.S. per capita National Debt to GDP ratios and per capita Personal Income to National Debt over the last 50 years leads to only one possible conclusion – his own.

Conclusion

Since per capita National Debt to GDP is at the highest ratio since the unsustainable heights attained during the second World War, and higher than at any time in the last half-century, and since Barack Obama has clocked the highest annual budget deficits in American history ($1,412.7 billion in 2009, $1,293.5 billion in 2010, $1,299.6 billion in 2011, and $1,326.9 billion in 2012), we can only conclude that his loot-and-plunder economic theory has achieved the worst results of any set of economic policies deployed by any American president, ever. The facts speak for themselves.

We tried Barack Obama’s loot-and-plunder theory, and it failed. And not only have Obama’s policies failed, but American’s are now worse off than at any time since the 1940’s. No one has managed our economy more recklessly than Barack H. Obama. Are you still a believer? Isn’t it high time we go back to what we know works, make some improvements, and implement some of the reforms proposed over the years, which were errantly pushed aside? Yes it’s time. And since Barack Obama has proved himself unwilling to bend to the will of the American people, it’s time we gave someone else the opportunity. It’s time to switch teams. It’s time to follow real leadership. It’s time to elect a true Conservative.

References:

Table 7.1 Selected Per Capita Product and Income Series in Current and Chained Dollars | Bureau of Economic Analysis

Debt to the Penny | Treasury Direct

Chart Data | Google Drive

Talk about Fairy Dust and Snake Oil!

:: Obama’s Loot-and-Plunder Theory on Social Benefits

– By: Larry Walker, Jr.-

Under Barack Obama’s economic theory, better known as Loot-and-Plunder Economics, income tax rates will necessarily skyrocket, perhaps by as much as 50% across-the-board. If you don’t believe it, just look at the facts and figures. For example, as of FY 2011, annual outlays on Social Security Benefits were 77.7% greater than they were in 2001, while outlays on Medicare were 148.8% greater (shown in current dollars in the chart above). Has Obama solved the problem through entitlement reform? Has he raised Social Security and Medicare taxes by 77.7% and 148.8% respectively? No, so what do you think is coming?

While Obama talks the talk, regarding taxing the rich and fairness, surely even he knows that his plan is not sustainable. It doesn’t balance the budget or grow the economy. The truth is that Obama has no plans for lowering income tax rates on the middle-class, but instead he created Obamacare, which is a nifty way of imposing a whole new set of taxes on those who can least afford health insurance, namely the middle-class. Got it? There will be no middle-class tax relief in a second Obama term, just new health care taxes (i.e. more pain).

So other than leading us all to the edge of a Fiscal Cliff, what else has Obama done for the middle-class? Well, he delivered a two-year Make Work Pay Credit (MWPC), which represented a $400 to $800 reduction in Social Security Taxes in 2009 and 2010, and followed this up with a two-year 2.0% Social Security Tax Cut. In other words, he gave us four years of temporary measures in an effort to stimulate the economy. But what did this really accomplish?

Two Things

#1 – The jobs deficit has grown to 11,760,000 under Obama’s watch, from 5,165,000 when Bush turned over the keys. So we can state without ambiguity that his attempts to stimulate the economy have failed. Sure, things might not be as bad as they could have been, but at the same time, things might not be as good as they could have been either.

The “jobs deficit” increases every month that employers create fewer than 127,000 jobs, the number needed to keep pace with population growth. As you can see in the chart below, the jobs deficit has increased under Obama’s watch, and has remained virtually unchanged since December of 2009. Aside from the jobs deficit, we are still 4,648,000 jobs short of where we were in December of 2007, partially due to the Great Recession, which ended in June of 2009, but namely due to Barack Obama’s loot-and-plunder economic policies, which were designed to prolong the crisis.

#2 – Not only has the unemployment rate remained above 8.0% for his entire term, but Obama’s ingeniously designed Social Security tax cuts have since created a $500 billion per year shortfall in the Social Insurance Fund accounts. Per the chart below, derived from the Bureau of Economic Analysis, Table 3.14 – Government Social Insurance Funds Current Receipts and Expenditures, the gap between Social Insurance receipts and expenditures is now worse than ever, thanks to Obama. I guess we’ll find out whether or not work pays (i.e. the MWPC), a few years from now, when we discover that our Social Security and Medicare guarantees were squandered away during the Obama years. His looting of an additional $716 billion out of Medicare to fund Obamacare should be le coup de grâce (the final blow).

As you can see in the chart above, the point of no return was actually breached in FY 2001, when Outlays for Social Benefits equaled Insurance Contributions. This was primarily due to an escalation in the number of baby-boomers reaching retirement age. But instead of addressing the obvious dilemma, the federal government allowed it to fester into larger and larger annual deficits. Thus, the “Social Benefits Deficit” eventually reached $177 billion by Fiscal Year 2008. Then along came Obama, who instead of addressing the problem has handed out four consecutive years of Social Security Tax cuts (i.e. loot-and-plunder fairy dust).

In just three years Obama turned a $177 billion annual Social Benefits Deficit into a $500 billion per year morass. Free money! Obamabucks! What were the results? As you can see in the chart above, and in the related table, in Fiscal Year 2009 the gap between Government Social Benefit Expenditures and Contributions swelled to $376 billion, from $177 billion in 2008, or by 112.4%. Those were the consequences of giving both taxpayers and non-taxpayers a reduction in their Social Insurance responsibilities via the MWPC. In Fiscal Year 2010, with the extension of MWPC, the Social Benefits Deficit widened to $411 billion, or by another 9.3%.

As if that wasn’t enough, Obama devised an even more cunning way of plundering America’s future retirement security. Replacing MWPC with his 2.0% Payroll Tax Cut, in 2011, caused the Social Benefits Deficit to widen by an additional 21.4%, to $499 billion. That’s a half-a-trillion dollar shortfall. And it’s not over yet. Since the 2.0% Payroll Tax Cut was extended into 2012, we will find out where Social Insurance Benefits stand, at the close of the fiscal year, on September 30th. But so far, when added together, $376 billion in 2009, $411 billion in 2010, and $499 billion in 2011, equals a total Social Benefits Deficit of $1.3 trillion. That’s the amount Obama has added to the national debt by tampering with our future retirement security, and that’s just a fraction of the $5.3 trillion he’s added to the overall debt.

Summary:

Between FY 2001 and 2008, Contributions for Government Social Insurance grew by 39.3%, while Social Benefit Expenditures grew by 73.6%. But instead of raising a red flag and solving the problem, Barack Obama proceeded to loot-and-plunder contributions, at a time when the demand for benefits was soaring. This was an amateurish move. Between FY 2009 and 2011, Contributions for Government Social Insurance actually shrank by -6.9%, while Social Benefit Expenditures rose by 22.1%, creating a $1.3 trillion shortfall.

So while gullible far-left loyalists continue to fall for Obama’s pretense, that the Romney-Ryan Ticket and Supply-Side economics would gut Social Security and Medicare, if they took five minutes to look up the facts, they would discover that Obama, through his own brand of loot-and-plunder fairy dust, has already beat them to it. The snake oil Obama is pushing is the same stuff that prolonged the Great Depression. Everyone knows that the federal government didn’t end the Depression, World War II did. That is everyone except for Obama, the unlearned and a few far-left loons.

What folks should be engaged in is bipartisan criticism of the manner in which Barack Obama is destroying our future economic security. We should at least be able to agree that there has to be a more viable alternative. Supply-side economics worked in the Roaring 20’s under Coolidge, in the 1960’s under JFK, in the 1980’s under Reagan, and in the 1990’s through 2007 under Clinton and Bush. That’s right! But according to Barack Obama, “It never worked.” Don’t believe that lie. A quick glance at the following chart, Net Federal Outlays and Receipts since 1980, says it all. Trillion dollar annual deficits are a phenomenon which began with Obama.

Lest we forget, Bill Clinton’s famed tax plan was a package which included tax rates ranging from 15% to 39.6% (i.e. rates were higher at all levels across-the-board), in addition to the Republican-led Tax-Relief and Deficit-Reduction Bill of 1997 (i.e. what actually created the boom of the 90’s). But if you think Obama can cherry-pick just one smidgen of Clinton’s tax policies, apply it to only a fraction of taxpayers, those making more than $250,000 (the equivalent of $157,197 in 1993), and achieve the same results, then you’re not using your brain.

Loot-and-Plunder economics ends when everyone sees their taxes rise by 50% or more across-the-board. That’s the only way the federal government can continue to spend at current levels, and move even halfway towards balancing its budget. When you see the symptoms of a failed economic policy (above), and your candidate boasts, “My plan worked,” that’s when you run!

—————————–

Notes:

The third chart (above) purposefully excludes interest contributed towards Social Insurance, since such interest is paid from general government funds. The federal government long ago raided the Social Security Trust Fund spending every dime, and now owes the Social Security Trust Fund $2.5 trillion, per Note 24 of the United States Government’s Notes to the Financial Statements, for the year ended September 30, 2011. From time to time, the federal government pays the Trust Fund interest on its debt, but with trillion dollar deficits for the last four years, it is reasonable to conclude that every dime of the interest paid is borrowed, thus it makes no sense to double count. The chart also excludes administrative expenses.

References:

U.S. GAO | Fiscal Year 2011 Financial Report of the United States Government

Bureau of Economic Analysis | Table 3.14 Government Social Insurance Funds Current Receipts and Expenditures

Chart Data | Google Drive

Obama’s Loot-and-Plunder Theory on Steroids

:: Use It or Lose It: We Can’t Wait

– By: Larry Walker, Jr. –

According to unelected hoodlums within the Obama Administration, from 2003 to 2006, Congress set aside $473 million in earmark transportation funds that have never been spent. “These idle earmarks have sat on the shelf as our infrastructure continued to age and construction workers stood on the sideline,” Transportation Secretary Ray LaHood said in a conference call Friday. “I’m taking that unspent money and giving it right back to the states so they can put it to work on the infrastructure projects that they need most — projects that will put people to work.”

So according to Mr. LaHood he’s going to take (i.e. steal) $473 million that was earmarked for infrastructure projects from 2003 through 2006, and send it right back (i.e. 6 to 9 years after the fact) to the states so they can spend it on the infrastructure projects they need the most (i.e. for purposes other than Congress intended). Aside from the fact that this proposal is felonious, the money Mr. LaHood is referring to no longer exists.

The idea of taking funds earmarked towards specific projects, which were deemed unworthy of pursuit during a previous administration, and shifting them towards other purposes today is felonious. What does the term “earmarked funds” mean? It means if Congress passes legislation to repair a certain bridge, the money to repair that bridge is “set aside”. But following Mr. LaHood’s gangster logic, ‘fictitious’ funds earmarked towards certain projects, six to nine years ago, may now be used to fund projects such as California’s Bullet Train to Nowhere. Perhaps a pair of handcuffs is in order.

Common sense dictates that if a bridge still needs fixing, and if the funds still exist and are not barred by the statute of limitations, then it should be fixed. But if the bridge doesn’t need fixing, if it was subsequently replaced by another project, or if the statute of limitations has expired, then the funds, assuming they still exist, should be returned to the Treasury. The notion of “use it or lose it” in this matter is felonious. According to Mr. LaHood, States now have around 45 days, or until October 1st, to identify projects for which they plan to use the money, or else they will lose it. In other words, the funds were not lost after sitting idle for 6, 7, 8 and 9 years, but suddenly there is an arbitrary 45-day deadline. Who passed that law? What is the statute of limitations for spending on earmarked transportation projects – 9, 8, 7, or 6 years? Is there one, or do bureaucrats just get to make up the rules as they go along?

Where’s the Money?

The following analysis from John A. Swinford on his blog, People, Places, News and Other Stuff, answers a key question: Where’s the money?

“Sounds reasonable, right? Hold on to your horses; remember this is a politician speaking. According to Transportation Secretary Ray LaHood, “These idle earmarks have sat on a shelf…” Well, OK, they were authorized but not used. I get that, but what happened to the funding for those earmarks…where is the money…in a lock box or a savings account…or somewhere else? Secretary Hood claims the earmarks were authorized during a period between 2003 and 2006 but not actually spent and therefore, the cash is still available.”

“Before you buy that explanation consider the difference between a budget and cash accounting. If you go to the St. Louis Federal Reserve Bank website you can pull up the actual Federal cash receipts and outlays. In each of the years to which Secretary Hood refers, the cash deficits ran $378 billion, $413 billion, $318 billion and $248 billion respectively (in current dollars). OMG, Washington spent more cash than it took in…What a surprise… But if that is so how could there possibly be some extra loose cash sitting around. Answer… there is none. The only way to fund “Use It or Lose It” is what? You guessed it…more borrowing.”

In fact, according to the Bureau of Economic Analysis, in real terms, the federal government operated at deficits of -1,955.2 billion from 2003 to 2008, and another -4,678.1 billion from 2009 to 2012 (shown in Constant FY 2005 Dollars). So not only was there nothing leftover, the money was never there to begin with.

The annual deficits shown in the chart above and listed below are shown in billions of constant (FY 2005) dollars. Note that the federal budget was nearly balanced in FY 2007.

  • 2003 -402.6
  • 2004 -427.9
  • 2005 -318.3
  • 2006 -239.7
  • 2007 -151.0
  • 2008 -415.7
  • 2009 -1,274.4
  • 2010 -1,153.0
  • 2011 -1,127.6
  • 2012 -1,123.1 (estimate)

The chart below summarizes receipts and outlays as percentages of Gross Domestic Product. Notice how the budget gap has widened dramatically since 2009.

Obama’s ideas on the economy are nothing more than classic Loot-and-Plunder, trickle-up, middle-out snake oil. In other words, borrow now – pay never. It didn’t work during the Great Depression, it hasn’t worked since 2009, it has never worked and it never will. Proposing to implement 1/16th of President Clinton’s 1990’s tax policies, while ignoring the fact that back then, income tax rates were higher on every American across-the-board, isn’t a serious plan for either growing the economy or balancing the budget. It’s a notion that most certainly fails to justify the felonious borrowing conjured up by Transportation Secretary LaHood just yesterday.

It’s time to return to supply-side economics which proved itself during the Roaring 20’s, the 1960’s, the 1980’s, the 1990’s and most of the 2000’s (through 2007). Obama has no plan to pay down the $5.3 trillion (in current dollars) which he’s added to the national debt, let alone the $16 trillion overall balance. Yet he seems to have no problem borrowing another $500 million under the guise that it’s somehow Bush’s fault. That’s right! Expect the extra $500 million in borrowing to magically be credited to George W. Bush, while Obama continues to promote the obvious lie that spending hasn’t increased on his watch.

But as each of the above charts show, whether in terms of current dollars, constant (FY 2005) dollars, or as percentages of GDP, Obama has allowed spending to skyrocket while revenues have continued to suffer due to a weak economy and high unemployment, symptoms of his failed economic policies. It’s time to put an end to this churlish presidency. Borrow It or Save It? We can wait – all the way to November 6th.

“The debt and the deficit is just getting out of control, and the administration is still pumping through billions upon trillions of new spending. That does not grow the economy.” ~ Paul Ryan

Addendum:

During 2008 the Highway Trust Fund required support of $8 billion from general revenue funds to cover a shortage in the fund. This shortage was due to lower gas consumption as a result of the recession and higher gas prices. Further transfers of $7 billion and $19.5 billion were made in 2009 and 2010 respectively.

^ Weiss, Eric M. (September 6, 2008). “Highway Trust Fund Is Nearly Out of Gas“. The Washington Post. Retrieved May 4, 2010.

^ “President Signs Bill Providing 9-Month Extension, $19.5 Billion for Highway Trust Fund“. The Washington Post. March 19, 1010. Retrieved August 15, 2011.

———————————————

References:

THE OLD WASHINGTON SHELL GAME? | John A. Swinford

Trickle Up Economics | Peter Schiff

Chart Data: Spreadsheet | Google Drive

Understanding Obama’s Loot and Plunder Theory

A.K.A. Trickle-up, or Trickle-sideways

– By: Larry Walker, Jr. –

The ignorance of one voter in a democracy impairs the security of all.” ~ John F. Kennedy –

“Trickle-down theory” is a pejorative term in United States politics which refers to the idea that tax breaks or other economic benefits provided by government to businesses and the wealthy will benefit poorer members of society by improving the economy as a whole. In the real world, and called by its proper name, supply-side economics has never failed. In fact, in spite of the ignorance of a few, any improvement in our economy since the end of the Great Recession can be attributed directly to the remaining bands of supply-side tax policies left over from the Bush Tax Cuts, which are scheduled to expire on December 31st.

In the 1980’s what was known as Reaganomics was pejoratively referred to by RINO’s and the far-left as “trickle-down” or “voodoo” economics. But they were wrong. Supply-side economics worked then and it will work now. Yet according to our clueless president, Barack Obama, it’s just “fairy dust”. We have to remind the far-left, including our clownish president (act like a clown and you get called one), that the four pillars of Reagan’s economic policy were to reduce growth of government spending, reduce income taxes and capital gains taxes, reduce government regulation of the economy, and control the money supply to reduce inflation. Now if that’s just “fairy dust” to you, then perhaps like Mr. Obama, back in your college days, you took one drag too many off a marijuana cigarette.

Mitt Romney’s five-point plan is the closest platform on the ballot to Reagan’s four pillars. Romney’s policies would also cut the deficit, reduce income taxes and capital gains taxes, reduce the number of government regulations, and would create a Reagan Economic Zone to strengthen free-enterprise and the U.S. Dollar world-wide. We call this supply-side economics. What’s the alternative? Does Obama have a better plan? Economist George Reisman, a proponent of tax cuts, said the following:

“Of course, many people will characterize the line of argument I have just given as the ‘trickle-down’ theory. There is nothing trickle-down about it. There is only the fact that capital accumulation and economic progress depend on saving and innovation and that these in turn depend on the freedom to make high profits and accumulate great wealth. The only alternative to improvement for all, through economic progress, achieved in this way, is the futile attempt of some men to gain at the expense of others by means of looting and plundering. This, the loot-and-plunder theory, is the alternative advocated by the critics of the misnamed trickle-down theory.”

On the other side of reality is Barack Obama’s one-point plan, also known as Obamanomics, “trickle-up”, “trickle-sideways” or “loot-and-plunder theory”. Under the Obama hypothesis, the deficit isn’t cut, income and capital gains taxes are hiked on those making over $250,000 while remaining static on those making less, the number of government regulations on the economy continue to expand, and nothing is done to improve the U.S. trade deficit or to strengthen the dollar. In other words, his one-term plan lacks a growth catalyst. Raising taxes on businesses and the wealthy isn’t an economic growth strategy, not even according to its chief proponent, Barack Obama. It’s merely a futile attempt of some men to gain at the expense of others by means of looting and plundering.

The Ends of Obama’s Loot-and-Plunder Theory

There are many countries with top tax rates higher than the 35% paid by the wealthiest Americans. In fact, the U.S. is ranked #23 in terms of top marginal tax rates among the 96 countries surveyed by KPMG in 2011. In the U.S. the top rate kicks in at around $388,350 of taxable income in 2012. Workers are also mandated to pay social security taxes of 4.2% (10.4% if self-employed) on the first $110,100 in wages, plus another 1.45% (2.9% if self-employed) on an unlimited amount of earned income. The U.S. tax on capital gains is currently 15%. The top U.S. corporate tax rate also clocks in at a healthy 35%, in addition to a matching portion of social security and Medicare taxes (6.2% of the first $110,100 and an unlimited 1.45%) on wages paid.

Among nations with the highest tax rates in the world, Ireland ranks #10. Its top tax rate of 48% kicks in at about $43,900 USD of taxable income (including a Universal Social Tax of 7.0%). Other notable taxes include a capital gains rate of 30%, and a pay related social insurance tax of 4% (also 4% if self-employed, with a 10.75% employer match). But while its personal tax rates are high, it has among the lowest corporate tax rates in Europe at just 12.5%.

The country with the #1 tax rate in the world is the Dutch territory of Aruba. Its top marginal rate of 58.95% kicks in at around $165,000 USD of taxable income, but the 35% rate kicks it at around $38,500 USD. Other notable taxes include a capital gains tax of 25%, a 1.6% (9.5% if self-employed) health insurance tax, a 4.0% (13.5% if self-employed) pension and accident insurance tax, and a 3% national sales tax. While its individual tax rates are the highest in the world, Aruba levies a flat corporate tax rate of just 28%, which is better than in the U.S.

A quick analysis of nations with the highest tax rates in the world reveals one common thread. Once a populace is conned into loot-and-plunder theory and tax rates begin to rise, it’s not long before tax brackets fall to a level where top tax rates affect almost everyone except for those below the poverty line. The top tax rate of 48% in Ireland kicks in at around $43,900 USD of taxable income and a tax rate of 35% kicks in at around $38,500 USD in Aruba. And that’s not including social insurance, health care, and VAT or national sales taxes which always follow. Where loot-and-plunder theory ends is when every middle-class worker is forking over 40% or more of their income to the government.

Live by the sword, die by the sword. If you’re in favor of hiking taxes on businesses and the wealthy, then you’re in favor of having your own and everyone else’s taxes hiked as well. That’s the deal. That’s the choice. The only one on the ballot offering a 20% across-the-board tax rate cut on every American is Mitt Romney. The only one offering not to tax interest, dividends or capital gains for those making less than $200,000 is Mitt Romney. The only one offering to eliminate the Alternative Minimum Tax and the Death Tax is Mitt Romney. The only one offering to cut the top corporate tax rate to 25% is Mitt Romney. The only pro-growth, deficit reduction plan on the ballot is Mitt Romney’s. The only things standing in the way are the clueless clown and part-time president Barack Obama (no I’m not laughing), and the ignorance of a few.

“Our tax system still siphons out of the private economy too large a share of personal and business purchasing power and reduces the incentive for risk, investment and effort – thereby aborting our recoveries and stifling our national growth rate.” ~ John F. Kennedy, Jan. 24, 1963, message to Congress on tax reduction and reform, House Doc. 43, 88th Congress, 1st Session

References:

Oxford English Dictionary

“The General Benefit from Reducing Taxes on the ‘Rich'”.Capitalism: A Treatise on Economics. p. 308. ISBN 978-0915463732

Countries With the Highest Income Tax Rates | CNBC

Aruba Tax Rates

Ireland Income Taxes and Tax Laws 2012