Obama’s Inverted Wealth Curve

Stuck on … 1993

By: Larry Walker, Jr.

We have taken time out of our busy lives this month to focus on the income tax debate. We have touched upon static versus dynamic revenue analysis, the present value of money, and the history of income taxes. Today, I will address something that’s been on my mind since the summer of 2008. The question of the day: How did Obama arrive at the idea that an income of $250,000 per year is rich?

Here’s the famous video clip:

But where did the amount come from? Either he pulled it out of thin air, or he lifted it from someone else.

I think I found the answer. And not only that, I think Obama is completely off-base, and in fact stuck on the idea of ‘wealth redistribution’ by any means, even if by deception.

A quick examination of the 1993 tax rate schedules will reveal that the top tax bracket of that year was $250,000, under Bill Clinton’s Omnibus Budget Reconciliation Act. I’m sure that Bill Clinton is flattered that Obama thinks so highly of his budget balancing ability, although it was actually implemented by a Republican Congress, that he would latch on to the top tax bracket of the era. However, the major flaw in Obama’s appraisal is that he has failed to adjust for inflation.

In fact, $250,000 of income today was equal to $164,275 in 1993 (calculate it here). And, $250,000 earned in 1993 is the equivalent of $380,460 today. You see, annual inflation over the 17 year span was 2.5%. In fact, the top tax bracket today will be $380,460 when adjusted for inflation. Taxable incomes have been adjusted for inflation every year since 1986. So does Obama have a problem with adjusting for inflation?

What Obama has been proposing boils down to this: Instead of allowing people who make over $250,000 per year in 2011 the benefit of an inflation adjustment, he wants to tax them in 1993 dollars, while taxing everyone else in current dollars. The effect is to redistribute wealth through a ‘big government’ sham. In effect, taxpayers who made between $164,275 to $250,000 in 1993 will be pushed into the top tax bracket by 2011.

If Obama was playing it straight, he would simply propose to increase the top tax rate to 39.6% on people making more than $380,460, which is exactly what would happen if the Bush tax cuts were to expire without action. But instead, we are being asked to tolerate, as intellectually reasonable, the idea that some taxpayers deserve the benefit of an inflation adjustment, while others do not. We are being asked to lower the bar of the top tax bracket to $164,275 in 1993 dollars.

If we are dumb enough to accept Obama’s proposal, in time we will achieve our longed for flat rate tax, but unfortunately the rate will end up being 39.6% for everyone.

So it is in the land of n’importe quoi. A land where quarter-millionaires and millionaires are one in the same, and where yesterday’s ‘One Hundred and Sixty Four Thousandaire’ gets to join them.

Where is the party of know?

References:

http://www.dollartimes.com/calculators/inflation.htm

U.S. Federal Individual Income Tax Rates History, 1913-2010

Related:

Tax Revolt of 2010 Authentic

Obama’s Ersatz Rich The Top 400

Keeping It Real: Obama’s $250,000 Fallacy

Obama’s Static Tax Blunder

Tax Revolt of 2010 | Authentic

Budget Cuts

From Servitude to Bondage

By: Larry Walker, Jr.

War has oft been used as an excuse to raise taxes; and tax hikes have sometimes led to war. Prior to the imposition of the income tax, the federal government’s primary source of revenue was through tariff duties. Tariffs were taxes imposed on certain imported goods which were produced by cheap foreign labor. Protectionists demanded higher tariffs to protect Northern industries from cheaper imports. Southerners favored lower tariffs as a means of encouraging foreigners to import their cotton and other agricultural exports. Some historians say that it was the bad blood over tariffs, between the years of 1828 and 1861, which actually lead to the Civil War.

The first income tax was levied in 1861 at a flat rate of 3%, but was quickly replaced with a progressive structure. The income tax was intended to be a temporary measure to help pay for the Civil War, but eventually became the primary source of federal funding. When the first full fledged progressive tax was imposed in 1913, it only applied to about 1% of the population. Today, roughly 60% of Americans are affected by income taxes, and every working person is subject to a Social Security tax of 6.2% levied on the first $106,800 of wages, and a Medicare tax of 1.45% on all wages. It’s interesting to note that the top tax rate of 7% imposed in 1913 was less than the minimum rate of 7.65% imposed on most workers today (and let’s not forget that employers get soaked with a matching amount).

The Revenue Act of 1861

The Revenue Act of 1861 included the first U.S. Federal income tax statute. The Act had been motivated by the need to fund the Civil War. It introduced the federal income tax as a flat rate tax. The income tax was to be “levied, collected, and paid, upon the annual income of every person residing in the United States, whether such income is derived from any kind of property, or from any profession, trade, employment, or vocation carried on in the United States or elsewhere, or from any other source whatever”.

Rates under the Act were 3% on income above $800 ($19,389 in 2010 inflation adjusted dollars) and 5% on income of individuals living outside the country. It was signed into law by Abraham Lincoln, the first Republican President.

The Revenue Act of 1862

The Revenue Act of 1862, also imposed to help fund the Civil War, and also signed into law by Abraham Lincoln, imposed the first progressive rate tax in U.S. history. The office of the Commissioner of Internal Revenue was established, with the Act specifying that Federal income tax was a temporary measure that would terminate in the year 1866.

Annual income of U.S. residents, to the extent it exceeded $600 ($13,632 in 2010 dollars), was taxed at a rate of 3%; those earning over $10,000 per year ($227,214 in 2010 dollars) were taxed at a 5% rate. With respect to the income tax liability generated by the salaries of “officers, or payments to persons in the civil, military, naval, or other employment or service of the United States, including senators and representatives and delegates in Congress”, the law also imposed a duty on paymasters to deduct and withhold the income tax, and to send the withheld tax to the Commissioner of Internal Revenue.

The Revenue Act of 1913

The Revenue Act of 1913, signed into law by Woodrow Wilson, re-instituted the federal income tax as the primary source of revenue for the federal government. It would require only a few years for the federal income tax to become the chief source of income for the government, far outdistancing tariff revenues.

The previous effort to tax incomes (Wilson-Gorman Tariff of 1894) had been declared unconstitutional by the Supreme Court because the tax on dividends, interest, and rents had been deemed to be a direct tax not apportioned by population. That obstacle, however, was removed by ratification of the Sixteenth Amendment on February 3, 1913.

The 1913 Act provided in part that:

“ . . . subject only to such exemptions and deductions as are hereinafter allowed, the net income of a taxable person shall include gains, profits, and income derived from salaries, wages, or compensation for personal service of whatever kind and in whatever form paid, or from professions, vocations, businesses, trade, commerce, or sales, or dealings in property, whether real or personal, growing out of the ownership or use of or interest in real or personal property, also from interest, rent, dividends, securities, or the transaction of any lawful business carried on for gain or profit, or gains or profits and income derived from any source whatever . . . “

The incomes of couples exceeding $4,000 ($88,100 in 2010 dollars), as well as those of single persons earning $3,000 or more ($66,100 in 2010 dollars), were subject to a one percent (1.0%) federal tax. Further, the measure provided a progressive tax structure (shown below), meaning that high income earners were required to pay at higher rates.

It has been said that less than 1% of the population paid federal income tax at the time.

Tax Rates: 1913 vs. 2010

The following table shows what the 1913 tax rates would look like in current dollars:

Amazing! That’s what our tax rates would look like today, if we had a fiscally responsible and efficient government. Under the first Revenue Act imposed after ratification of the 16th Amendment, most Americans would be exempt from taxes today.

Exemptions

In 1913, a single taxpayer was allowed an exemption of $3,000 ($66,100 in 2010 dollars), while a married couple was allowed $4,000 ($88,100 today). The following table compares the standard deduction and personal exemption(s) provided today versus what was allowed in 1913.

National Debt: 1913 vs. 2010

Nowadays, the excuse for raising taxes isn’t related to war, it’s related to a drive to help irresponsible politicians pay for their devil-may-care spending sprees. The national debt in 1913 was about $64 billion, in 2010 dollars, which is 211 times less than today’s appalling $13.5 trillion. Even with the lowest tax rate today being greater than the top tax rate in 1913, politicians have managed to ‘muck things up’.

So how high need our tax rates grow in order to keep pace with the national debt? If we were to presume that tax rates are a function of the amount of revenue needed by the federal government, then tax rates should either shrink or grow in line with the need. The answer (shown below) would require a bottom rate of 211% and a top rate of 1,477%, or 211 times the rates of 1913.

Meanwhile, Washington continues to borrow at a rate of $100,000,000,000 per month. The first priority of the Congress should have been tax and spending reform, yet we find ourselves in a bigger mess than the one they promised to clean up. To raise taxes on producers would only bring economic disaster. To cut taxes would mean a much smaller federal government, fewer entitlements, and a surge in economic activity. It’s time.

References:

http://en.wikipedia.org/wiki/Revenue_Act_of_1913

http://en.wikipedia.org/wiki/Revenue_Act_of_1861

http://en.wikipedia.org/wiki/Revenue_Act_of_1862

Obama’s Ersatz Rich | The Top 400

Benjamins

Tax Statistics of the Truly Wealthy

By: Larry Walker, Jr.

“Freedom is not an empty sound; it is not an abstract idea; it is not a thing that nobody can feel. It means, — and it means nothing else, — the full and quiet enjoyment of your own property. If you have not this, if this be not well secured to you, you may call yourself what you will, but you are a slave.” ~ William Cobbett, English political commentator, 1827.

Barack Obama (II) talks a good game, but his reasoning doesn’t mesh up with reality. He rants about the rich getting $100,000 tax cuts while he seeks to jack tax rates on those who can hardly be considered rich. It’s not the family who earns $250,000 who received a $100,000 tax cut, it’s the über-rich.

It’s also likely that the people making $200,000 to $250,000 today were not making it during the 1990s, and have never known a tax cut. These folks were not subject to the 39.6% rates imposed under Bill Clinton. For them, the Obama tax increase of 2011 will be a first. These folks didn’t get a tax cut during the last eight years, they earned their way to this level during the Bush years. After all, incomes are not static. You don’t come out of college and make $250,000 per year on day one, it comes with time. Make no mistake about it — what Obama is proposing is a tax increase.

Instead of manning up and imposing a scaled surtax on people making, let’s say, over $1,000,000, $2,000,000, $5,000,000, $10,000,000 and $100,000,000, Obama has chosen to draw the line at a paltry $250,000. Could this have something to do with the fact that the Obamas personal income was $5.5 million last year? Is this a strategy to keep himself and his buddies on the top while holding the rest of us down? After all, making $5.5 million per year is like making $250,000, 22 times; which is the same as the difference between making $50,000 and $1,100,000. So based on the same theory, should we start taxing people making $50,000 at top marginal rates as well?

If the goal is to tax the “rich”, it would be very easy for Obama to raise taxes on them. All he has to do is add some new upper level tax brackets such as I mentioned above. In fact, such a tiered system existed back in 1921. As outlined in my last post, “Keeping It Real: Obama’s $250,000 Fallacy”:

The Revenue Act of 1921 contained additional tax brackets above the $100,000 level to tax the super rich. They were as follows (in 1921 dollars) : $100,000 @ 56%, $150,000 @ 57%, $200,000 @ 58%, $300,000 @ 71%, $500,000 @ 72%, $1,000,000 @ 73%. Translating this into 2010 (inflation adjusted) dollars would yield the following, respectively: $1,113,139 @ 56%, $1,669,709 @ 57%, $2,226,278 @ 58%, $3,339,418 @ 71%, $5,565,696 @ 72%, and $11,131,392 @ 73%.

Why don’t we do that? Let’s tax Obama and the truly wealthy at 56% to 73%. And let’s go back to the 1926 tax tables and tax people making less than $48,000 per year at 1.4%, and those making $48,000 to $96,000 at 3.0%. Surely, Obama shouldn’t have a problem with this. Democrats either need to put up or shut up. Personally I prefer capping top tax rates at 25% as first implemented under Calvin Coolidge in 1926, but I’m just entertaining Obama’s ersatz logic.

But don’t worry, if you’re currently making $200,000 to $250,000, or aspiring to get there one day, our present progressive federal government will make sure that you never earn your way into the upper-crust. It’s hard enough already, but nearly impossible with the federal government standing by, eager to confiscate 36% to 40% in income taxes, plus another 7.65% to 15.3% in Social Security and Medicare taxes, every year. And soon there will be health care, and possibly energy taxes to boot. Meanwhile, the truly wealthy laugh at the idea of making a petty $250,000. While averaging a cool $1,325,996 per day, and being taxed at essentially the same rate, the über-rich have it pretty good, comparatively speaking.

If progressives want to talk stuff, maybe it would be wise to check the facts first. Do you think that an income of $250,000 is wealthy? Check out the following:

The Top 400: IRS Statistics of Income, Tax Year 2007

The following averages are taken from the IRS report entitled, “The 400 Individual Income Tax Returns Reporting the Highest Amount of Adjusted Gross Incomes in [2007]”. The incomes of the top 400 represented the top 1.59% of all adjusted gross income reported on 2007 income tax returns (the latest available).

  1. The average adjusted gross income reported was $344,759,000.
  2. The average amount of salaries and wages reported was $29,413,000, on 306 returns.
  3. The average amount of taxable interest per return was $27,074,000.
  4. The average amount of dividend income reported was $24,506,000.
  5. The average amount of net capital gains reported was $228,551,000.
  6. The average amount of net business income reported was $3,182,000, on 49 returns.
  7. The average amount of net business loss was $2,590,000, on 84 returns.
  8. The average amount of Partnership and S-Corp income claimed on 202 returns was $83,025,000.
  9. The average amount of Partnership and S-Corp net loss claimed on 185 returns was $25,245,000.
  10. The average amount of charitable contributions deducted on 389 returns was $28,512,000.
  11. The average amount of taxable income per return was $296,241,000.
  12. The average amount of income tax paid was $57,311,000 per return.

Should we really be talking about capping incomes at $250,000 while there are people making an average of $344,759,000 and sitting around collecting $27,074,000 per year in interest? These are not so much the small business job creators, but rather people like the Obamas, those who already have it made and are mucking things up for the rest of us. Oh, and by the way, if you divide the average amount of income tax paid by the truly wealthy, by the average amount of taxable income, it only comes up to 19.3%, nowhere close to the top marginal rate of 35.0%.

How would you define rich?

How does $250,000 per year stack up against $344,759,000?

Important question: Can the Obama policy of keeping current tax rates in place for everyone making less than $250,000 be considered the same thing as a tax cut? I didn’t think so. Will this be enough to spark the kind of economic growth and job creation that our economy so desperately needs? Only if nothing equals something.

What we need is less government and more freedom. We need a tax overhaul. We need a tax system that is equitable, one that does not take advantage of a crisis by destroying the hopes and dreams of the people, and one that will spark the kind of economic recovery that we so desire. Yes, we need additional tax cuts, not a tax increase. And no, $250,000 isn’t rich. If you want to tax the rich, then create some upper level tax brackets and do it, otherwise enough of this nonsense.

I agree with the American Independent Party’s (AIP) platform position on the federal income tax:

“We consider the federal income tax to be destructive of our liberty, privacy, and prosperity. Therefore, we are working to bring about its complete elimination and the repeal of the Sixteenth Amendment to the U.S. Constitution. We recommend that the current system be replaced by an equitable, simple, noninvasive, visible, efficient tax, one that does not destroy or even infringe upon our economic privacy and liberty.”

For more on the AIP Platform click here.

References:

http://www.irs.gov/pub/irs-soi/07intop400.pdf

http://www.helium.com/items/879023-slavery-past-and-present

http://www.cesj.org/homestead/reforms/tax/taxjustice.html

http://aipnews.com/talk/forums/thread-view.asp?tid=16673&posts=5#M43279

Keeping It Real: Obama’s $250,000 Fallacy

You've Been Robbed

Legalized Robbery

Collecting more taxes than is absolutely necessary is legalized robbery. ~ Calvin Coolidge

– By: Larry Walker –

The question of the day: Why is making $250,000 a year suddenly considered wealthy? The Obamas made $5.5 million last year. Is that wealthy?

Contrary to popular belief, $250,000 in 2010 had the same buying power as $20,722 in 1926. Annual inflation over this period was 3.01%. An income of $250,000, adjusted for inflation, would have placed a taxpayer in an 11% tax bracket in 1926. In order to have been considered in the top tax bracket back then, in today’s dollars, would have required taxable income in excess of $1,206,419. The 1926 tax tables are shown below along with equivalent 2010 dollar amounts:

Click to Enlarge

So in inflation adjusted dollars, people like the Obamas would have been considered wealthy in the 1920’s and should rightfully be in the top tax bracket today. On the other hand, folks making $50,000 to $250,000 today, would have been barely considered middle class back in 1926.

The Revenue Act of 1921 contained additional tax brackets above the $100,000 level to tax the super rich. They were as follows: $100,000 @ 56%, $150,000 @ 57%, $200,000 @ 58%, $300,000 @ 71%, $500,000 @ 72%, $1,000,000 @ 73%. Translating this into 2010 dollars would yield the following amounts, respectively: $1,113,139 @ 56%, $1,669,709 @ 57%, $2,226,278 @ 58%, $3,339,418 @ 71%, $5,565,696 @ 72%, and $11,131,392 @ 73%.

President Calvin Coolidge, under the Mellon Tax Bill, slashed top rates from 73% in 1921, down to 25% in 1926. The new top bracket was 25% for anyone making over $100,000 ($1,206,419 in 2010 dollars). So under the Revenue Act of 1921, the Obamas would have been forking over 72% of their income to Uncle Sam, but only 25% under Coolidge. What a relief that would have been. The “Roaring Twenties” had arrived, catapulting multitudes into the middle class.

Now let’s bring it up to today. How did the lower tax brackets of 1926 grow from being between 1.4% and 14%, all the way to today’s level of 10% to 33%? And let’s not forget about the 7.65% (15.3% for the self-employed) that we all get soaked for in Social Security and Medicare taxes. Under the Social Security Act of 1935, the FICA tax was set at 1% of the first $1,400 in wages. It’s interesting to note that $1,400 in 1935 is the equivalent of $22,562 today, and yet the rate today (exclusive of Medicare tax) is 6.2% (12.4% for the self-employed) of the first $106,800 in wages. It’s called legalized robbery.

When voters finally drop this left, right bickering and start looking at the facts they are going to wake up one day and realize that we’ve all been bamboozled. We’ve been getting robbed for so long that we don’t even know the difference. The following table compares today’s tax rates with 1926 rates for comparable incomes.

Click to Enlarge

In reviewing our current tax tables, it is apparent that a couple making $250,000 in 2010 would have been taxed at a rate of 11% in 1926, and yet the rate is now 33%. Also, those in the top tax bracket, those making over $373,650, would have had tax rates between 14% (at the low end), and 25% for the super rich, and yet the rate is now 35%. Then along comes Obama proffering to raise the top rate up to 39.6%. The problem is that the whole tax system is out of whack.

Under Obama’s ‘made up’ theory, a couple making $250,000 should be taxed at the same rate as a couple making $5.5 million or more. Is that fair? Should a couple who makes $250,000 be taxed at the same rate as a couple making $11 million or more? Who’s kidding who?

Annual income, as defined in current tax tables, needs to be appropriately adjusted for inflation. Tax rates, on the other hand, should be adjusted back towards the historical lows, not adjusted for inflation (as eventually they would exceed 100%). There is not one section of the Internal Revenue Code that has been consistently adjusted for inflation, neither the standard deduction, nor personal exemptions have kept pace. Tax brackets have been lowered and raised seemingly based on the whims of politicians, and not based on historical inflation adjusted incomes, and that’s wrong. It’s just plain wrong.

It’s time to stop playing games with the American people, and time to start governing honestly. I’m sick and tired of rich Washington politicians, like the Obamas, trying to pretend that they’re on the same level as everyone else. The Obamas are millionaires and should pay accordingly. But let’s be fair about it, making $250,000 a year in 2010 is not rich, it wasn’t considered rich in 1926, and it’s not rich today.

What we need is real tax reform, not more of the same. If you’re not part of the solution, you’re part of the problem, and unfortunately, Obama is part of the problem.

Sources:

http://www.dollartimes.com/calculators/inflation.htm

http://en.wikipedia.org/wiki/Revenue_Act_of_1926

http://en.wikipedia.org/wiki/Revenue_Act_of_1921

Obama’s Static Tax Blunder

Make Believe

Revisiting Static vs. Dynamic Tax Revenue

Comments by: Larry Walker

The Obama Administration’s static view on tax policy can never succeed. We all know that Obama is an ideologue who thinks that people who make more money should pay a higher share of taxes, and yet we already have a progressive tax system. But apparently that’s not good enough for Obama. Under our present system, roughly 40% of those fortunate enough to be employed don’t pay any income taxes at all, while the top 5% of income earners pay 60% of income taxes, and those considered in the top 50% pay 97% of the tax burden. There are some on the other side of the ideological playing field who think this to be unfair, and are promoting a flat tax. But there’s more to the story.

The reasoning behind Obama’s economic team, or what’s left of it anyway, would go something along these lines:

“If we cut taxes, our revenue will decrease, and if we raise taxes, our revenue will increase.” “So let’s compromise. Let’s keep taxes the same on the many, and raise them on the few, that way we’ll increase our revenue, and we’ll get re-elected too.”

Sounds smart, but does it work in real life? True, under a static view of revenue, if taxes are cut, revenue will decrease, and if taxes increase so will revenue, but is government revenue the only concern? What about economic growth? What about restoring confidence in a broken system? What about growth of the job market? Will raising taxes on everyone making over $250,000 per year, and keeping taxes the same for everyone else bring about a robust economic recovery? I think we’ve been down this road before. The following report, written in 1996, by the Congressional – Joint Economic Committee, already provides the answer.

Source: http://www.jec.senate.gov/republicans/public/?a=Files.Serve&File_id=9576a929-37b4-497c-9b06-4bf3481f9f0a

————————————————————

April 1996

The Reagan Tax Cuts: Lessons for Tax Reform


During the summer of 1981 the central focus of policy debate was on the Economic Recovery Tax Act (ERTA) of 1981, the Reagan tax cuts. The core of this proposal was a version of the Kemp-Roth bill providing a 25 percent across-the-board cut in personal marginal tax rates. By reducing marginal tax rates and improving economic incentives, ERTA would increase the flow of resources into production, boosting economic growth. Opponents used static revenue projections to argue that ERTA would be a giveaway to the rich because their tax payments would fall.

The criticism that the tax payments of the rich would fall under ERTA was based on a static conception of human behavior. As a 1982 JEC study pointed out,[1] similar across-the-board tax cuts had been implemented in the 1920s as the Mellon tax cuts, and in the 1960s as the Kennedy tax cuts. In both cases the reduction of high marginal tax rates actually increased tax payments by “the rich,” also increasing their share of total individual income taxes paid. Unfortunately, estimates of ERTA by the Democrat-controlled CBO continued to show falling tax payment by upper income taxpayers, even after actual IRS data had become available showing a surge of income tax payments by affluent taxpayers.

Given the current interest in tax reform and tax relief, a review of the effects of the Reagan tax cuts on taxpayer behavior and tax burden provides useful information. During the 1980s ERTA had reduced personal tax rates by about 25 percent, while the Tax Reform Act of 1986 chopped them yet again.

Tax Rates and Tax Revenues

High marginal tax rates discourage work effort, saving, and investment, and promote tax avoidance and tax evasion. A reduction in high marginal tax rates would boost long term economic growth, and reduce the attractiveness of tax shelters and other forms of tax avoidance. The economic benefits of ERTA were summarized by President Clinton’s Council of Economic Advisers in 1994: “It is undeniable that the sharp reduction in taxes in the early 1980s was a strong impetus to economic growth.” Unfortunately, the Council could not bring itself to acknowledge the counterproductive effects high marginal tax rates can have upon taxpayer behavior and tax avoidance activities.

Since 1984 the JEC has provided factual information about the impact of the tax cuts of the 1980s. For example, for many years the JEC has published IRS data on federal tax payments of the top 1 percent, top 5 percent, top 10 percent, and other taxpayers. These data show that after the high marginal tax rates of 1981 were cut, tax payments and the share of the tax burden borne by the top 1 percent climbed sharply. For example, in 1981 the top 1 percent paid 17.6 percent of all personal income taxes, but by 1988 their share had jumped to 27.5 percent, a 10 percentage point increase. The graph below illustrates changes in the tax burden during this period.

The share of the income tax burden borne by the top 10 percent of taxpayers increased from 48.0 percent in 1981 to 57.2 percent in 1988. Meanwhile, the share of income taxes paid by the bottom 50 percent of taxpayers dropped from 7.5 percent in 1981 to 5.7 percent in 1988.

A middle class of taxpayers can be defined as those between the 50th percentile and the 95th percentile (those earning between $18,367 and $72,735 in 1988). Between 1981 and 1988, the income tax burden of the middle class declined from 57.5 percent in 1981 to 48.7 percent in 1988. This 8.8 percentage point decline in middle class tax burden is entirely accounted for by the increase borne by the top one percent.

Several conclusions follow from these data. First of all, reduction in high marginal tax rates can induce taxpayers to lessen their reliance on tax shelters and tax avoidance, and expose more of their income to taxation. The result in this case was a 51 percent increase in real tax payments by the top one percent. Meanwhile, the tax rate reduction reduced the tax payments of middle class and poor taxpayers. The net effect was a marked shift in the tax burden toward the top 1 percent amounting to about 10 percentage points. Lower top marginal tax rates had encouraged these taxpayers to generate more taxable income.

The 1993 Clinton tax increase appears to having the opposite effect on the willingness of wealthy taxpayers to expose income to taxation. According to IRS data, the income generated by the top one percent of income earners actually declined in 1993. This decline is especially significant since the retroactivity of the Clinton tax increase in that year limited the ability of taxpayers to deploy tax avoidance strategies, temporarily resulting in an increase in their tax burden. Moreover, according to the FY 1997 Clinton budget submission, individual income tax revenues as a share of GDP will be lower during the first four years of the Clinton tax increase, which include the effects of the 1990 tax increase, than under the last four years of the Reagan tax changes (FY 1986-89). Furthermore, according to a study published by the National Bureau for Economic Research,[2] the Clinton tax hike is failing to collect over 40 percent of the projected revenue increases.

Incidentally, the claim that unrealistic supply side Reagan Administration revenue projections caused large budget deficits during the 1980s is false. Nonetheless, this false allegation is often used against current tax reform proposals. The official Reagan revenue projections immediately following enactment of ERTA did not assume huge revenue increases, and were actually quite close to the CBO revenue projections. Even the Democrat-controlled CBO projected that deficits would fall after the enactment of the Reagan tax cuts. The real problem was a recession that neither CBO nor OMB could foresee. Even so, individual income tax revenues rose from $244 billion in 1980 to $446 billion in 1989.

Conclusion

The Reagan tax cuts, like similar measures enacted in the 1920s and 1960s, showed that reducing excessive tax rates stimulates growth, reduces tax avoidance, and can increase the amount and share of tax payments generated by the rich. High top tax rates can induce counterproductive behavior and suppress revenues, factors that are usually missed or understated in government static revenue analysis. Furthermore, the key assumption of static revenue analysis that economic growth is not affected by tax changes is disproved by the experience of previous tax reduction programs. There is little reason to expect static revenue analysis to evaluate the economic or distributional effects of current tax reform proposals much better than it evaluated the Reagan tax program 15 years ago.

Christopher Frenze
Chief Economist to the Vice-Chairman

————————————————————

Endnotes:

1. Joint Economic Committee, The Mellon and Kennedy Tax Cuts: A Review and Analysis, 1982.

2. Feldstein, Martin and Daniel Feenberg, The Effect of Increased Tax Rates on Taxable Income and Economic Efficiency: A Preliminary Analysis of the 1993 Tax Rate Increases, NBER, 1995.

Obama’s Right Direction Exposed

Ouch

If this is the right direction — I would rather be wrong than right.

Compiled by: Larry Walker, Jr.

I was looking over the Consumer Metrics Institute’s New Growth Index and some of their other charts (here) and almost fell out of my chair. While every left-wing pundit, Obama, and his inept administration are boldly declaring that we are headed in the right direction, the facts beg to differ.

Who should I believe, the facts or the White House?

Their Conclusion: “As such, the prospect of a double-dip recession, something that’s happened only once since the Great Depression, remains a distinct possibility. That earlier double dip was a 6-month recession from January 1980 to July 1980, a 12-month recovery, and a 16-month of recession from July 1981 to November 1982. The one bit of good news for that earlier period is that the second dip coincided with the end of a secular bear market and the beginning of an 18-year cycle of accelerating growth.”

“The charts below focus on the ‘Trailing Quarter’ Growth Index, which is computed as a 91-day moving average for the year-over-year growth/contraction of the Weighted Composite Index, an index that tracks near real-time consumer behavior in a wide range of consumption categories. The Growth Index is a calculated metric that smooths the volatility and gives a better sense of expansions and contractions in consumption.”

“The 91-day period is useful for comparison with key quarterly metrics such as GDP. Since the consumer accounts for over two-thirds of the US economy, one would expect that a well-crafted index of consumer behavior would serve as a leading indicator. As the chart suggests, during the five-year history of the index, it has generally lived up to that expectation. Actually, the chart understates the degree to which the Growth Index leads GDP. Why? Because the advance estimates for GDP are released a month after the end of the quarter in question, so the Growth Index lead time has been substantial.”

View source, updates and more information here, or go directly to:

http://www.consumerindexes.com/

Congress needs to quit spending, and cut taxes – now. If you’re not part of the solution, you’re part of the problem.

Related posts:

Obama: The Era of Flimflam Economics, Part II ; Are We Heading In The ‘Right’ Direction?

Are We Heading In The ‘Right’ Direction?

Crossroads

That depends on the meaning of the word right. Right?

By: Larry Walker, Jr.

If growing the national debt faster than gross domestic product is the right direction, then the Obama Administration is correct. If the goal is to reach a 100% debt to GDP ratio, as quickly as possible, then the Democrats are correct. If doubling-down on the failed part of Bush policies (i.e. deficit spending) is the right direction, then Democrats are up to par.

However, if the term ‘right direction’ means that we are heading towards a Conservative resurgence in November, then that would be an honest assessment. Every time I hear Democrats make this declaration in the coming weeks, I’ll be thinking about the Conservative resurgence. The chart below shows the direction we are heading.

Tax Cuts: The Right Direction

In May of 2003, tax cuts were enacted. The tax cuts were responsible for the creation of 7.3 million new jobs beginning in August of 2003 and lasting through the end of 2007 (source: http://libertyworks.com/bush-tax-cut-myths-and-fallacies-1/). Tax cuts are the only proven method for bringing an economy out of recession. The deeper the tax cut, the greater the expansion.

As Liberty Works so aptly reminds us, “President Obama and the Democrat Congress have implemented a series of measures that defy the lessons of past recessions”, especially that of 1981, which was by some measures worse than this one. The chart below shows, “the job market recovery is faltering at best, after 31 months of Bush/Obama policies. There are 8 million fewer Americans now employed than in December, 2007.”

The results in the next chart, speak for themselves. “Reagan’s policies turned the job market around after 16 months of losses. The Reagan economy grew continuously for 90 months, creating a total of 21 million new jobs, or a 24% increase in the number of Americans who were employed.”

Right Means Right

If the goal is to grow the economy, create jobs, and increase tax revenues, then tax cuts are the right direction. However, if the goal is something more sinister, then one must brainwash their constituents into believing that ‘tax cuts cause recessions’; that we are somehow heading in the right direction, and that a tax hike will further this trend.

The facts show that the 1983 and 2003 tax cuts brought us through successful business cycles. In 2008, the housing bubble burst, credit markets froze, and we fell into a deep recession, but tax cuts didn’t cause the recession. If you listen closely, a year ago, Obama was saying the recession was caused by the ‘lack of affordable health insurance’, and today he’s saying that it was caused by ‘tax cuts’. I suppose next he’ll be saying the recession was caused by climate change.

It’s sinister enough to take advantage of a (manufactured) crisis in order to pass unwanted legislation. It’s entirely another matter to purposefully prolong a (manufactured) crisis, to the detriment of every American: black, white, red, yellow, and brown; Democrat, Republican, and Independent. Obama’s play book is little more than the old tried and failed policies of FDR. In an article entitled, “FDR’s policies prolonged Depression by 7 years, UCLA economists calculate“, you will find the following conclusion:

“We found that a relapse isn’t likely unless lawmakers gum up a recovery with ill-conceived stimulus policies.”

Are Democrats doing anything other than gumming up this recovery with ill-conceived stimulus policies? Are we really heading in the right direction?

Congress needs to quit spending, and cut taxes – now. If you’re not part of the solution, you’re part of the problem.

Credits: Photo via sapientsparrow.wordpress.com charts via USGovernmentSpending.com and LibertyWorks.com.

[D]issing America: The Looming [R]esurgence

D is for Dissing America

The Case for Further Tax Cuts

Ranted By: Larry Walker, Jr.

Obama’s progressive form of economic change is destroying America. Not only does he threaten to hoard the keys, but to thrust the car over a cliff. Specifically, the effect of his policies on productivity, government subsidies, tax credits, class warfare, income taxes, and government spending is doing more harm to America than the Great Recession ever could.

Taking Away the Incentive

In the private sector, when you want to motivate a workforce you offer them things like more time off, bonuses, or stock ownership. In other words you offer them something in exchange for something. The Obama administration offers nothing for those who work hard. With Obama, if you work hard, you receive the reward of paying higher taxes, fees and fines to support those who don’t work as hard, or at all. If I told my employees that next year, the lowest paid would be getting a 50% decrease in pay, and the more highly paid would receive a 10% pay cut, would they work harder? No. In the real world they would quit immediately, hang around while looking for another job, or simply decrease their performance in line with the coming downgrade. Isn’t this what Obama is doing by proffering a tax hike for those who are working hard, paying their bills on time, and in essence supporting everyone else?

The Failure Subsidy

Now let’s take a person who has been unemployed for a year and is about to lose their home. They haven’t really looked for work because they’re on 99 weeks of unemployment, courtesy of Obama, and they expect the government to step in and make up the back payments on their home. Why should this person work when they can live off of less and still get by? Their plan is to start looking for work again when all the free government benefits run out. This person has in effect been given a government subsidy not to work, at the expense of those who are working. When my teenagers can go out and find jobs in this economy, I find it hard to believe that there are no jobs. One of them gets up at 5:00 AM and goes off to bake bread, while moochers stay home to collect free checks. Why do my kids work? Because their mother told them they must either work, or get out of the house. That’s the kind of incentive that will either make you or break you. Implying that we somehow need illegal immigrants to perform undesirable work, because Americans won’t is a sad, sad excuse.

Breaking the Free-Market

At a time when home prices had fallen between 30 to 50% in some Georgia communities, in stepped the federal government with an $8,000 refundable tax credit for first time homebuyers. Initially the credit was only $7,500 and had to be repaid over a 15 year period. People were already buying houses at the time, and were turning down the initial credit because it had to be repaid, so the government, in its wisdom, made it a giveaway. Did potential buyers really need an additional incentive beyond the existing 30-50% discount? What about the hardworking folks down the street who were left paying for their largest, and now most devalued, asset? Prices may have eventually recovered on their own had fewer houses been sold in the trough, but through government intervention, now all of our houses have been hopelessly devalued. Those who received the tax credit also received the bonus of equity in their homes, while those who hung on through tough times got screwed.

The Victims

The Obama administration talks a lot about the “haves” and “have-nots”. It seems there are a lot more have-nots today, than there were in January of 2009 (roughly 6.4 million more). Those who still have a job, a business, or some savings (things that they worked hard to achieve) are the new haves. The have-nots are those who are victims of an economy, hindered by the federal government. In many cases, the have-nots are the direct victims of the federal government. Instead of motivating people to get off of unemployment, welfare, subsidized housing and food stamps, the government is increasing these programs and fostering the entitlement mentality. What incentive is there for one of these, government-made, have-nots to ever claw their way out? If working means giving half of ones labor to the government, then why even try?

Legalized Robbery

I was looking over a client’s job situation recently. The conclusion was that if she accepts the proposed contract, she and her husband will be in a position where every additional dollar she earns, for the rest of the year, will be subject to 50% in federal, self-employment, and State taxes. Is it even worth the effort? If you were offered a contract that would pay you $68,000 in five months, but you had to pay $20,000 in travel expenses to earn it, and then another $24,000 in taxes, leaving you with just $24,000 would you do it? It might be better to just stick closer to home and find a W-2 job paying $30,000. Where is the incentive when the government stands to gain 50% of ones labor? Yet the Obama administration wants to raise taxes. Hell, taxes are already too high. We need additional tax cuts, not an increase. Top tax rates should be cut back down to 28% like they were under Reagan (and even that’s too high). No one in their right mind is going to put forth maximum effort for half. It’s just not going to happen. Many have-nots ponder this same dilemma everyday.

The Spending Bonanza

If the Bush tax cuts caused such huge deficits, then how did Obama’s July 2010 budget deficit end up exceeding Bush’s 2007 annual budget deficit, by $5.0 Billion?

Per the website, Liberty Works, “the one-month deficit for July was $165,043,000,000 or $5 Billion more than the “irresponsible Bush deficit” for the entire year of 2007.”

Graph via: http://blog.heritage.org/2010/02/05/past-deficits-vs-obamas-deficits-in-pictures/

Will the government ever be able to raise enough tax revenue to cover Obama’s massive spending gap? Let me answer that for you. No. Never in a 1,000 years. The only thing certain about our exploding national debt is that more revenue will eventually be required to cover it. The question is how to increase revenue without further damaging the economy.

A Conservative [R]esurgence

What’s the solution? We need a conservative resurgence in America. Give us the incentive to produce, take away the subsidy for failure, stop tampering with the free market, and free us that we may lift the have-nots. Reduce income tax rates, and stop spending more than we have. Our present course is destined for failure.

The bottom line: Drastically cut the size of government, and don’t just freeze tax rates, cut them. You can’t just cut taxes without a corresponding reduction in spending. It doesn’t work like that. Yet, until taxes are cut, the government will be trapped in providing greater failure subsidies (bailouts), and further destructive interference with the free market. That’s how it works.

If you’re not part of the solution, you’re part of the problem.

Bail and Fail | Obama’s Bank Rescue Sham

On Friday, April 30th, the FDIC reported 7 additional bank closings including three banks in Puerto Rico. It’s ironic that Congress passed a bill asking Puerto Rico if it wants statehood on the same day.

This brings the total number of bank failures under Obama to 204. The total number of bank failures in April was 23, and the year-to-date figure is 64. You can thank left-wing Progressives like Obama, Pelosi, Reid, and some on the right for the continued destruction and consolidation which is happening in the banking sector. I am now projecting that 195 banks will fail this year.

Meanwhile, approximately $370 billion of the $700 billion TARP fund sits on the sidelines, while troubled assets remain on many bank’s balance sheets dragging them under. Wasn’t that money supposed to be used to get rid of toxic assets? Well, if Progressives are going to sit idly by and watch banks fail, then they need to give us back our $370 billion. The other $330 billion appears to be a total loss. Obama and his Progressive entourage should claim it, cut their (our) losses, and prepare for defeat at the polls.

Remember that these are the same Progressives who hate banks and corporations and who will stop at nothing in their efforts to destroy our free enterprise system and turn America into a state run socialist utopia. They must be defeated.

click to enlarge

Below is a list of the 23 banks that failed in April of 2010.

click to enlarge

Below is a comprehensive listing of the 204 banks that have failed since Obama took the reigns. There were 25 bank failures in 2008, and 3 in 2007 making the total for the present crisis 232. In contrast, during the S&L Crisis of the 1980’s and 1990’s there were 747 S&L failures at a total cost of $160.1 billion.

click to enlarge

Source: http://www.fdic.gov/bank/individual/failed/banklist.html

Real Financial Reform, Part II | The Shawmut Redemption

The Shawmut Redemption…

Reforms that need reform…

Compiled by: Larry Walker, Jr. –

On November 16, 1993, the New York Times reported the following:

In a move showing banking regulators’ increased emphasis on ending loan discrimination, the Federal Reserve Board has, for the first time, blocked a large bank merger because of concern over possible bias against minority groups in mortgage lending.

By a 3-to-3 vote, with one abstention, the Fed declined to approve the Shawmut National Corporation’s acquisition of the New Dartmouth Bank of Manchester, N.H., because of concern that Shawmut, based in Hartford, may not have complied with fair-lending laws.

The Justice Department is investigating a Shawmut subsidiary, the Shawmut Mortgage Company, for possible lending bias…

“Obviously we’re disappointed with the decision,” said Brent Di Giorgio, a spokesman for Shawmut, which has $27 billion in assets. “Notwithstanding the decision, Shawmut is proud of its lending record to minorities.”

Over the last year Shawmut has begun several programs to increase lending to low-income Americans and minority groups that some community activists say have made Shawmut a leader in the industry.

These programs include establishing mortgages with down payments of as little as 2.5 percent that use more flexible income criteria, hiring more minority mortgage staff workers and sending around home buyers from minority groups to check that Shawmut employees are not discriminating.

“The Fed is sending a strong signal to the banking industry that they’re going to be looking at banks’ lending practices,” said Joseph Duwan, a banking analyst with Keefe, Bruyette & Woods. “Clearly Shawmut is being made a little bit of scapegoat.”

http://www.nytimes.com/1993/11/17/business/fed-stops-bank-merger-cites-lending-concerns.html

The End of Shawmut National

So what happened to Shawmut National Corporation? Two years after being extorted by the Federal government, in conjunction with various social justice organizations, the bank ceased to exist. Let’s follow the trail from the end of Shawmut, to the $700 billion dollar Federal Bank Bailout:

1995 – Fleet Financial Group, Inc. acquires Shawmut National Corp.

1996 – Fleet Financial Group Inc. acquires Westminster Bancorp

1999 – Fleet Financial Corp. acquires BostonBank Corp. and becomes FleetBoston Financial Corp.

2001 – FleetBoston Financial Corp. acquires Summit Bancorp.

2004 – Bank of America Corp. acquires FleetBoston Financial Corp. for $47 billion.

2005 – Bank of America acquires MBNA Corporation and becomes Bank of America Card Services for $35 billion.

2007 – Bank of America acquires LaSalle Bank for $21 billion.

2007 – Bank of America acquires US Trust and becomes Bank of America Private Wealth Management

2008 – Bank of America acquires Countrywide Financial for $4.1 billion and Merrill Lynch for $50 billion as part of the Bailout deal.

2009 – The Federal Government invests $45 billion of taxpayer’s money in Bank of America through the Troubled Asset Relief Program (TARP). Bank of America’s pays back the $45 billion along with $4.5 billion in dividends and fees.

http://en.wikipedia.org/wiki/List_of_bank_mergers_in_the_United_States

http://seekingalpha.com/article/60966-bofa-s-countrywide-acquisition-dumb-and-dumber

The Bailout

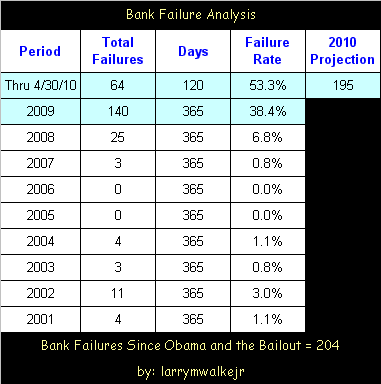
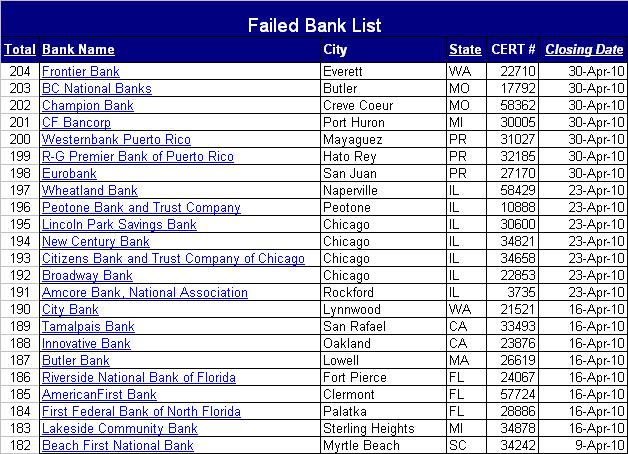
The Federal government’s solution was of course to create new agencies, more regulations, and to spend more borrowed money with the excuse that this time it will be different. Although it claims that it could make money as did off of Bank of America, so far, the US Treasury, Office of Financial Stability’s $700 billion bailout has, through 4/30/10, disbursed $517.1 billion, been repaid $186.9 billion, and is owed a balance of $330.2 billion.

http://bailout.propublica.org/main/list/index

1993 to 1995

So what happened in-between Shawmut National’s reprimand, the denial by the Fed to acquire other banks, and it’s ultimate demise?

William A. Niskanen, in his May/June 1995 Cato Policy Report, got it right when he stated that, “Redistributive rules among or between buyers and sellers, however, usually lead one or more parties to leave the market.” His reasoning was correct. His prediction was dead on. The arguments he posed way back then are worthy of repeating.

He said, “A market is where people come to make exchanges. Every market has its own rules, and markets thrive or wither, in part, depending on the choice of those rules. Clear rules for payment; the penalties for nonpayment, fraud, and nonperformance; and the rules for resolving disputes, for example, usually induce growth of the market, increasing the expected net benefit to each party. Redistributive rules among or between buyers and sellers, however, usually lead one or more parties to leave the market. U.S. financial markets today face several major new policy threats. Most of the new threats have a common pattern: the government is using existing regulatory authority or proposing new authority to aid some parties in the market at the expense of others.”

Mr. Niskanen continued, “Federal bank regulators and the Department of Justice have increasingly reinterpreted their authority under existing law to develop an extensive system of credit allocation. The four statutes under which bank regulations are issued are the Fair Housing Act of 1968, the Equal Credit Opportunity Act of 1974, the Home Mortgage Disclosure Act of 1975, and, most important, the Community Reinvestment Act of 1977. The common objective of those four laws was to reduce the alleged discrimination in bank lending to minorities. I say “alleged” because the premise that banks discriminate is both implausible and unsupported.”

With regard to Shawmut National Corporation, he continued, “In summary, there is no consistent evidence that banks discriminate among loan applicants by race, either consciously or inadvertently. In Washington, however, no good deed goes unpunished. Two major banks with records of outreach to minority borrowers have been subjected by the Department of Justice to what is best described as extortion. In a major 1993 case, following actions against three small banks, the Federal Reserve held up approval of several proposed acquisitions by Shawmut National Corporation pending resolution of a discrimination suit brought by Justice against Shawmut’s mortgage company subsidiary. The facts of the case are clear. During the period when the alleged discrimination occurred, Shawmut had an aggressive program to increase mortgage lending to minority applicants. Shawmut relaxed its normal lending criteria, substantially reduced the rejection rate on loan applications by minorities, and doubled the amount of new mortgage lending to minorities. Although no private person filed a discrimination complaint, the Department of Justice charged Shawmut with discrimination, based on findings that some of the loan officers had not been as aggressive as others in approving loans to minority applicants and that Shawmut had no internal review procedure to ensure that all the loan officers used the same lending criteria. In order to remove the barrier to approval of its proposed acquisitions, Shawmut agreed to settle that absurd case, set aside $1 million as a settlement fee, and worked with Justice to find some “victims” of the alleged discrimination to share the fee.”

http://www.cato.org/pubs/policy_report/pr-mj-ni.html

My Conclusion:

The chickens have come home to roost. The Progressives got what they wanted. Loans were made to people who should not have gotten them, who could not afford them, and who were bad credit risks in order to satisfy unreasonable government policies. In other words, the banks came up with whatever programs were necessary to ensure that anyone who applied for a loan got one. That took care of there ever being any question that a loan was denied based on racial discrimination. The banks used Option ARMs, no-doc, stated income or whatever it took to comply with the extortion. And what happened? The buck got passed. Banks were sold and acquired. Loans were packaged, sold and re-sold until they finally came back to their source, right smack in the government’s lap. The entire banking system nearly collapsed, and the Federal government came close to taking out the entire global economy. And it’s not over yet.

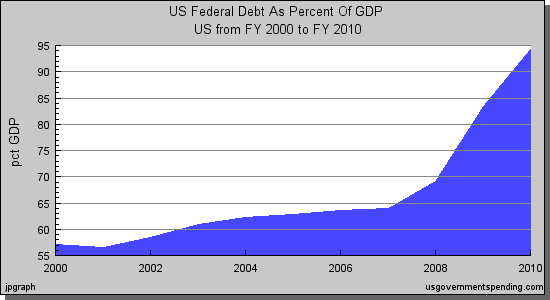
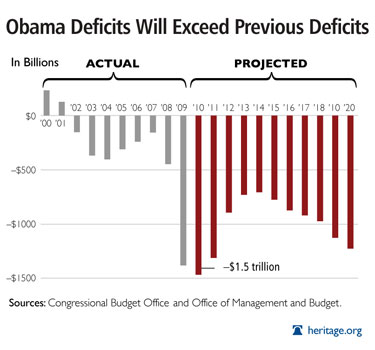
Have progressive politicians learned their lesson? Apparently not, as we see today, the progressives are trying to blame the crisis on those who simply carried out their warped policies. They are demonizing bank executives, Wall Street, Corporations, stock traders, and any and everyone who carried out their wishes. But it doesn’t take a degree from Harvard to figure out who’s really to blame. All one needs to do is look at how a progressive government manages itself. It is $13 trillion dollars in debt. Its trusted reserves of Social Security and Medicare have been emptied and left with IOU’s. And now it is heading towards $22 trillion of debt by the year 2020.

Obama had one thing right though, we do need to fundamentally transform the USA. However, that’s the only thing he got right. Policy-wise, he’s on the wrong track. He only offers to make a bad situation worse. Community organizers like Obama are part of the problem, not the solution. You cannot fix a problem when you are the problem. What America needs is a radical return to its founding principles of limited government, and free enterprise. We’ll know that we’re on the right track when every culpable progressive dimwit has been placed behind bars.