Obama’s Loot-and-Plunder Theory on Steroids

:: Use It or Lose It: We Can’t Wait

– By: Larry Walker, Jr. –

According to unelected hoodlums within the Obama Administration, from 2003 to 2006, Congress set aside $473 million in earmark transportation funds that have never been spent. “These idle earmarks have sat on the shelf as our infrastructure continued to age and construction workers stood on the sideline,” Transportation Secretary Ray LaHood said in a conference call Friday. “I’m taking that unspent money and giving it right back to the states so they can put it to work on the infrastructure projects that they need most — projects that will put people to work.”

So according to Mr. LaHood he’s going to take (i.e. steal) $473 million that was earmarked for infrastructure projects from 2003 through 2006, and send it right back (i.e. 6 to 9 years after the fact) to the states so they can spend it on the infrastructure projects they need the most (i.e. for purposes other than Congress intended). Aside from the fact that this proposal is felonious, the money Mr. LaHood is referring to no longer exists.

The idea of taking funds earmarked towards specific projects, which were deemed unworthy of pursuit during a previous administration, and shifting them towards other purposes today is felonious. What does the term “earmarked funds” mean? It means if Congress passes legislation to repair a certain bridge, the money to repair that bridge is “set aside”. But following Mr. LaHood’s gangster logic, ‘fictitious’ funds earmarked towards certain projects, six to nine years ago, may now be used to fund projects such as California’s Bullet Train to Nowhere. Perhaps a pair of handcuffs is in order.

Common sense dictates that if a bridge still needs fixing, and if the funds still exist and are not barred by the statute of limitations, then it should be fixed. But if the bridge doesn’t need fixing, if it was subsequently replaced by another project, or if the statute of limitations has expired, then the funds, assuming they still exist, should be returned to the Treasury. The notion of “use it or lose it” in this matter is felonious. According to Mr. LaHood, States now have around 45 days, or until October 1st, to identify projects for which they plan to use the money, or else they will lose it. In other words, the funds were not lost after sitting idle for 6, 7, 8 and 9 years, but suddenly there is an arbitrary 45-day deadline. Who passed that law? What is the statute of limitations for spending on earmarked transportation projects – 9, 8, 7, or 6 years? Is there one, or do bureaucrats just get to make up the rules as they go along?

Where’s the Money?

The following analysis from John A. Swinford on his blog, People, Places, News and Other Stuff, answers a key question: Where’s the money?

“Sounds reasonable, right? Hold on to your horses; remember this is a politician speaking. According to Transportation Secretary Ray LaHood, “These idle earmarks have sat on a shelf…” Well, OK, they were authorized but not used. I get that, but what happened to the funding for those earmarks…where is the money…in a lock box or a savings account…or somewhere else? Secretary Hood claims the earmarks were authorized during a period between 2003 and 2006 but not actually spent and therefore, the cash is still available.”

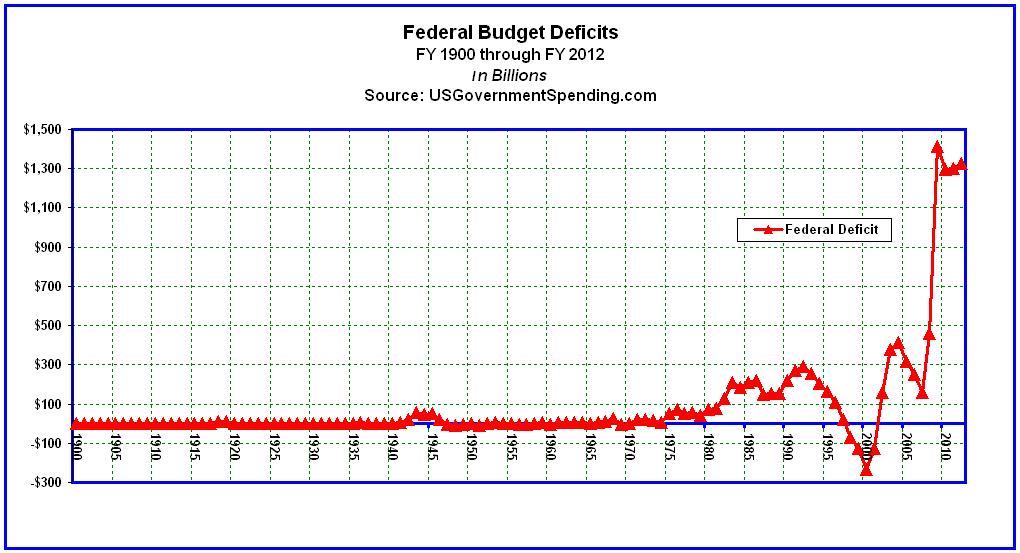
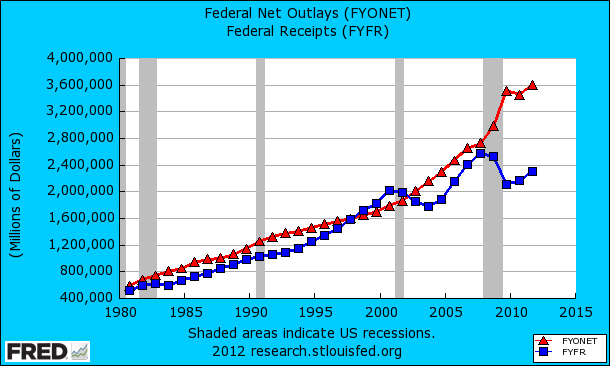
“Before you buy that explanation consider the difference between a budget and cash accounting. If you go to the St. Louis Federal Reserve Bank website you can pull up the actual Federal cash receipts and outlays. In each of the years to which Secretary Hood refers, the cash deficits ran $378 billion, $413 billion, $318 billion and $248 billion respectively (in current dollars). OMG, Washington spent more cash than it took in…What a surprise… But if that is so how could there possibly be some extra loose cash sitting around. Answer… there is none. The only way to fund “Use It or Lose It” is what? You guessed it…more borrowing.”

In fact, according to the Bureau of Economic Analysis, in real terms, the federal government operated at deficits of -1,955.2 billion from 2003 to 2008, and another -4,678.1 billion from 2009 to 2012 (shown in Constant FY 2005 Dollars). So not only was there nothing leftover, the money was never there to begin with.

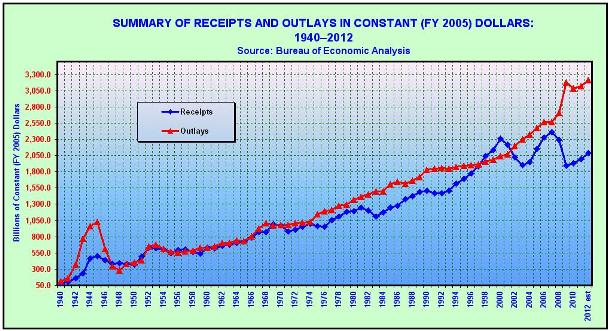
The annual deficits shown in the chart above and listed below are shown in billions of constant (FY 2005) dollars. Note that the federal budget was nearly balanced in FY 2007.

  • 2003 -402.6
  • 2004 -427.9
  • 2005 -318.3
  • 2006 -239.7
  • 2007 -151.0
  • 2008 -415.7
  • 2009 -1,274.4
  • 2010 -1,153.0
  • 2011 -1,127.6
  • 2012 -1,123.1 (estimate)

The chart below summarizes receipts and outlays as percentages of Gross Domestic Product. Notice how the budget gap has widened dramatically since 2009.

Obama’s ideas on the economy are nothing more than classic Loot-and-Plunder, trickle-up, middle-out snake oil. In other words, borrow now – pay never. It didn’t work during the Great Depression, it hasn’t worked since 2009, it has never worked and it never will. Proposing to implement 1/16th of President Clinton’s 1990’s tax policies, while ignoring the fact that back then, income tax rates were higher on every American across-the-board, isn’t a serious plan for either growing the economy or balancing the budget. It’s a notion that most certainly fails to justify the felonious borrowing conjured up by Transportation Secretary LaHood just yesterday.

It’s time to return to supply-side economics which proved itself during the Roaring 20’s, the 1960’s, the 1980’s, the 1990’s and most of the 2000’s (through 2007). Obama has no plan to pay down the $5.3 trillion (in current dollars) which he’s added to the national debt, let alone the $16 trillion overall balance. Yet he seems to have no problem borrowing another $500 million under the guise that it’s somehow Bush’s fault. That’s right! Expect the extra $500 million in borrowing to magically be credited to George W. Bush, while Obama continues to promote the obvious lie that spending hasn’t increased on his watch.

But as each of the above charts show, whether in terms of current dollars, constant (FY 2005) dollars, or as percentages of GDP, Obama has allowed spending to skyrocket while revenues have continued to suffer due to a weak economy and high unemployment, symptoms of his failed economic policies. It’s time to put an end to this churlish presidency. Borrow It or Save It? We can wait – all the way to November 6th.

“The debt and the deficit is just getting out of control, and the administration is still pumping through billions upon trillions of new spending. That does not grow the economy.” ~ Paul Ryan

Addendum:

During 2008 the Highway Trust Fund required support of $8 billion from general revenue funds to cover a shortage in the fund. This shortage was due to lower gas consumption as a result of the recession and higher gas prices. Further transfers of $7 billion and $19.5 billion were made in 2009 and 2010 respectively.

^ Weiss, Eric M. (September 6, 2008). “Highway Trust Fund Is Nearly Out of Gas“. The Washington Post. Retrieved May 4, 2010.

^ “President Signs Bill Providing 9-Month Extension, $19.5 Billion for Highway Trust Fund“. The Washington Post. March 19, 1010. Retrieved August 15, 2011.

———————————————

References:

THE OLD WASHINGTON SHELL GAME? | John A. Swinford

Trickle Up Economics | Peter Schiff

Chart Data: Spreadsheet | Google Drive

Understanding Obama’s Loot and Plunder Theory

A.K.A. Trickle-up, or Trickle-sideways

– By: Larry Walker, Jr. –

The ignorance of one voter in a democracy impairs the security of all.” ~ John F. Kennedy –

“Trickle-down theory” is a pejorative term in United States politics which refers to the idea that tax breaks or other economic benefits provided by government to businesses and the wealthy will benefit poorer members of society by improving the economy as a whole. In the real world, and called by its proper name, supply-side economics has never failed. In fact, in spite of the ignorance of a few, any improvement in our economy since the end of the Great Recession can be attributed directly to the remaining bands of supply-side tax policies left over from the Bush Tax Cuts, which are scheduled to expire on December 31st.

In the 1980’s what was known as Reaganomics was pejoratively referred to by RINO’s and the far-left as “trickle-down” or “voodoo” economics. But they were wrong. Supply-side economics worked then and it will work now. Yet according to our clueless president, Barack Obama, it’s just “fairy dust”. We have to remind the far-left, including our clownish president (act like a clown and you get called one), that the four pillars of Reagan’s economic policy were to reduce growth of government spending, reduce income taxes and capital gains taxes, reduce government regulation of the economy, and control the money supply to reduce inflation. Now if that’s just “fairy dust” to you, then perhaps like Mr. Obama, back in your college days, you took one drag too many off a marijuana cigarette.

Mitt Romney’s five-point plan is the closest platform on the ballot to Reagan’s four pillars. Romney’s policies would also cut the deficit, reduce income taxes and capital gains taxes, reduce the number of government regulations, and would create a Reagan Economic Zone to strengthen free-enterprise and the U.S. Dollar world-wide. We call this supply-side economics. What’s the alternative? Does Obama have a better plan? Economist George Reisman, a proponent of tax cuts, said the following:

“Of course, many people will characterize the line of argument I have just given as the ‘trickle-down’ theory. There is nothing trickle-down about it. There is only the fact that capital accumulation and economic progress depend on saving and innovation and that these in turn depend on the freedom to make high profits and accumulate great wealth. The only alternative to improvement for all, through economic progress, achieved in this way, is the futile attempt of some men to gain at the expense of others by means of looting and plundering. This, the loot-and-plunder theory, is the alternative advocated by the critics of the misnamed trickle-down theory.”

On the other side of reality is Barack Obama’s one-point plan, also known as Obamanomics, “trickle-up”, “trickle-sideways” or “loot-and-plunder theory”. Under the Obama hypothesis, the deficit isn’t cut, income and capital gains taxes are hiked on those making over $250,000 while remaining static on those making less, the number of government regulations on the economy continue to expand, and nothing is done to improve the U.S. trade deficit or to strengthen the dollar. In other words, his one-term plan lacks a growth catalyst. Raising taxes on businesses and the wealthy isn’t an economic growth strategy, not even according to its chief proponent, Barack Obama. It’s merely a futile attempt of some men to gain at the expense of others by means of looting and plundering.

The Ends of Obama’s Loot-and-Plunder Theory

There are many countries with top tax rates higher than the 35% paid by the wealthiest Americans. In fact, the U.S. is ranked #23 in terms of top marginal tax rates among the 96 countries surveyed by KPMG in 2011. In the U.S. the top rate kicks in at around $388,350 of taxable income in 2012. Workers are also mandated to pay social security taxes of 4.2% (10.4% if self-employed) on the first $110,100 in wages, plus another 1.45% (2.9% if self-employed) on an unlimited amount of earned income. The U.S. tax on capital gains is currently 15%. The top U.S. corporate tax rate also clocks in at a healthy 35%, in addition to a matching portion of social security and Medicare taxes (6.2% of the first $110,100 and an unlimited 1.45%) on wages paid.

Among nations with the highest tax rates in the world, Ireland ranks #10. Its top tax rate of 48% kicks in at about $43,900 USD of taxable income (including a Universal Social Tax of 7.0%). Other notable taxes include a capital gains rate of 30%, and a pay related social insurance tax of 4% (also 4% if self-employed, with a 10.75% employer match). But while its personal tax rates are high, it has among the lowest corporate tax rates in Europe at just 12.5%.

The country with the #1 tax rate in the world is the Dutch territory of Aruba. Its top marginal rate of 58.95% kicks in at around $165,000 USD of taxable income, but the 35% rate kicks it at around $38,500 USD. Other notable taxes include a capital gains tax of 25%, a 1.6% (9.5% if self-employed) health insurance tax, a 4.0% (13.5% if self-employed) pension and accident insurance tax, and a 3% national sales tax. While its individual tax rates are the highest in the world, Aruba levies a flat corporate tax rate of just 28%, which is better than in the U.S.

A quick analysis of nations with the highest tax rates in the world reveals one common thread. Once a populace is conned into loot-and-plunder theory and tax rates begin to rise, it’s not long before tax brackets fall to a level where top tax rates affect almost everyone except for those below the poverty line. The top tax rate of 48% in Ireland kicks in at around $43,900 USD of taxable income and a tax rate of 35% kicks in at around $38,500 USD in Aruba. And that’s not including social insurance, health care, and VAT or national sales taxes which always follow. Where loot-and-plunder theory ends is when every middle-class worker is forking over 40% or more of their income to the government.

Live by the sword, die by the sword. If you’re in favor of hiking taxes on businesses and the wealthy, then you’re in favor of having your own and everyone else’s taxes hiked as well. That’s the deal. That’s the choice. The only one on the ballot offering a 20% across-the-board tax rate cut on every American is Mitt Romney. The only one offering not to tax interest, dividends or capital gains for those making less than $200,000 is Mitt Romney. The only one offering to eliminate the Alternative Minimum Tax and the Death Tax is Mitt Romney. The only one offering to cut the top corporate tax rate to 25% is Mitt Romney. The only pro-growth, deficit reduction plan on the ballot is Mitt Romney’s. The only things standing in the way are the clueless clown and part-time president Barack Obama (no I’m not laughing), and the ignorance of a few.

“Our tax system still siphons out of the private economy too large a share of personal and business purchasing power and reduces the incentive for risk, investment and effort – thereby aborting our recoveries and stifling our national growth rate.” ~ John F. Kennedy, Jan. 24, 1963, message to Congress on tax reduction and reform, House Doc. 43, 88th Congress, 1st Session

References:

Oxford English Dictionary

“The General Benefit from Reducing Taxes on the ‘Rich'”.Capitalism: A Treatise on Economics. p. 308. ISBN 978-0915463732

Countries With the Highest Income Tax Rates | CNBC

Aruba Tax Rates

Ireland Income Taxes and Tax Laws 2012

U.S. Jobs Deficit Holds at 11,760,000 in July

Break Out the Fairy Dust –

“The largest single barrier to full employment of our manpower and resources and to a higher rate of economic growth is the unrealistically heavy drag of federal income taxes on private purchasing power, initiative and incentive.” ~ John F. Kennedy, Jan. 24, 1963, special message to Congress on tax reduction and reform

– By: Larry Walker, Jr. –

The U.S. Jobs Deficit declined by 30,000 in July, falling from 11,790,000 in June, to 11,760,000, based on yesterday’s Employment Situation Report. While May’s number was revised upward by 10,000, and June’s number was revised downward by 16,000, the economy added a mere 163,000 jobs in July. And since we need to create 127,000 jobs a month, just to keep up with population growth, this resulted in an overall decline in the jobs deficit of 30,000 compared to the month prior (see chart below).

Emboldened by the 30,000 net improvement to the jobs deficit, Barack Obama ridiculed Mitt Romney’s economic plan, stating that, ‘the idea that tax cuts would pay for themselves by way of a “massive boom in the economy” is “fairy dust” that the GOP has “tried to sell” in the past and hasn’t worked.’ But what’s ironic is that even July’s tiny increase in jobs can be attributed to nothing more than traces of fairy dust leftover from the Bush Tax Cuts of 2003. To state otherwise, would infer that allowing the Bush Tax Cuts to expire would have yielded a better result, and surely not even Obama believes that one.

According to U.C. Berkley Professor and President Obama’s former Chair of his Council of Economic Advisers (CEA), Christina Romer, in a paper published in 2010, a tax increase of 1.0% of GDP, reduces output over the next three years by nearly 3.0%. I would add that a decline of 3.0% in output equates to a loss of around 12.7 million jobs. So does it take a rocket scientist to understand that a tax cut of 1.0% of GDP would have the opposite effect, increasing output over the next three years by nearly 3.0%, and adding around 12.7 million jobs? Call it voodoo, fairy dust, Reaganomics, supply-side economics or whatever you wish, but it’s really just common sense.

“Tax increases appear to have a very large, sustained and highly significant negative impact on the economy.” ~ Christina Romer (just prior to leaving the Obama Administration)

What’s wrong with a little fairy dust?

Obama’s misconception is steeped in the theory of Static Revenue Analysis, while Mitt Romney’s plan is based on Dynamic Revenue Analysis, or if you prefer “fairy dust”. Obama wants to raise taxes on the top 2% of income earners while doing absolutely, positively, nothing for the other 98% of Americans. Great plan Stan. On the other hand, Romney wants to cut personal income tax rates by 20% across-the-board on all Americans, eliminate taxes on interest, dividends and capital gains on those making less than $200,000, eliminate the death tax, eliminate the alternative minimum tax and lower the top corporate tax rate from 35% to 25%. What’s wrong with that?

Under Obama’s static theory, the size of the economy, the number employed persons, personal incomes, and the amount of income tax collected are all fixed. Following are five common assumptions under his static theory.

  1. If you’re not working today, you will never work again.

  2. If you are working today and making $25,000 a year, you’ll be making $25,000 for the rest of your life.

  3. Since the official U-6 unemployment rate is currently 15.0%, it will remain so indefinitely.

  4. If taxes are cut, the rich will pay less in taxes (unproven).

  5. Because the government collected roughly $2.4 trillion in taxes last year, unless tax rates are hiked, it will collect roughly the same amount every year going forward, from exactly the same taxpayers.

Thus, under static theory, the only way the government can get more money, Obama’s ultimate goal, is by raising taxes, and any reduction in tax rates would result in a permanent reduction in revenue.

Under Romney’s dynamic theory, the belief is that the stimulative effect of allowing citizens to keep and spend more of their own money will result in growth in the size of the economy, the number of working persons, personal incomes and the amount of tax revenue. Following are five common assumptions under dynamic theory.

  1. If you’re not working today, you will eventually find a job and start paying income taxes.

  2. If you are already working and making $25,000, your income will eventually rise and you’ll end up paying more in taxes than you were before, albeit at a lower tax rate.

  3. The economy will reach full-employment.

  4. When taxes are cut, the rich will pay more in taxes (proven), and more people will become rich.

  5. An increase in economic output yields an increase in the number of working persons, which means more taxpayers, and thus greater government revenues.

What we should understand is that supply-side economics has always worked in the past and always will in the future. In the 1980’s it was called Reaganomics, but pejoratively referred to as “trickle-down” or “voodoo” economics. Today, according to Barack Obama it’s just “fairy dust”. How original. Call it what you will, it does work, and that’s more than can be said of Obamanomics.

In the 1980’s, the four pillars (i.e. fairy dust) of Reagan’s economic policy were to reduce the growth of government spending, reduce income tax and capital gains tax, reduce government regulation of economy, and control the money supply to reduce inflation. Mitt Romney’s five point plan builds on Reagan’s four pillars, his policies also cut the deficit, reduce income and capital gains taxes, reduce the number of government regulations and create a Reagan Economic Zone to strengthen free-enterprise and the U.S. Dollar world-wide. What’s wrong with that?

Revised Jobs Benchmark

So where have Barack Obama’s policies gotten us? Well, extending Economist Paul Krugman’s job creation benchmark and updating it with the latest figures, we discover that to be meaningful, the number of jobs needed to return to more or less full employment by December of 2014, or within the next 29 months, is now 532,517 jobs a month, as follows:

In order to keep up with population growth, we would need to create 127,000 jobs times 29 months, or 3,683,000. Add in the need to make up for the jobs deficit and we’re at around 15,443,000 (3,683,000 + 11,760,000) over the next 29 months — or 532,517 jobs a month.

If we extend the target date to 5 years from today, then the number of jobs needed to return to more or less full employment by July of 2017, or within the next 60 months, is now 323,000 jobs a month, as follows:

In order to keep up with population growth, we would need to create 127,000 jobs times 60 months, or 7,620,000. Add in the need to make up for the jobs deficit and we’re at around 19,380,000 (7,620,000 + 11,760,000) over the next 60 months — or 323,000 jobs a month.

The Bottom Line: Since we only created 163,000 jobs in July, and since the jobs deficit declined by a mere 30,000, under the policies of Barack Obama, we are something in the order of 54 years away from full-employment [(323,000 / 30,000 = 10.8) and (10.8 * 5 = 54 years)]. In other words, we are NOT moving in the right direction, we aren’t moving at all. Due to a waste of 43 months under the failed policies of Barack Obama, we must now create 532,000 jobs each and every month to be on a track towards full employment within 29 months, or 323,000 jobs each and every month to be on track towards full employment within 5 years. Thus, since Obamanomics has pushed us so far away from the mark that most of us living today will never see full-employment again within our lifetimes; perhaps a little “fairy dust” is in order.

Photo Credit: Where’s the antimatter then? | Michigan State University

Data: Worksheet on Google Drive

The Real Jobs Deficit | Moving in the wrong direction.

“Every time in this century we’ve lowered the tax rates across the board, on employment, on saving, investment and risk-taking in this economy, revenues went up, not down.” ~ Jack Kemp

* By: Larry Walker, Jr. *

A total of 3,514,000 Nonfarm jobs had already been lost by the time President Bush handed the keys over to Barack Obama, yet even though the Great Recession officially ended in June of 2009, an additional 4,889,000 jobs were lost during Obama’s first 11 months in office (see table). By November of 2009 the recession had eliminated an estimated 8,403,000 jobs. It was at this point that Nobel Prize Winning Economist Paul Krugman set forth a reasonable benchmark for a return to more or less full employment within 5 years.

According to Mr. Krugman’s theory, in order to keep up with population growth and recover the number of jobs lost would have required the creation of 300,000 jobs per month, through December of 2014. But, as I pointed out in Obama Jobs Scorecard – Part 3, today we find ourselves more than 5.4 million jobs short of this mark. However, the real jobs deficit is even more dire.

The Real Jobs Deficit

If we return to December of 2007, the month the recession began, and apply the Economic Policy Institute’s estimate — that we need to create a minimum of 127,000 jobs each and every month to keep up with population growth — we find that the real jobs deficit, since the recession began, is currently 11,742,000 (see table). As you can see graphically in the chart below, the jobs deficit hasn’t changed much since Paul Krugman set the benchmark at 300,000 jobs a month. Since then, as shown in the corresponding table, the jobs deficit hasn’t decreased at all, but has rather increased by 291,000.

Real Jobs Deficit

Last month, according to the Bureau of Labor Statistics, the U.S. economy created a mere 69,000 jobs (only 77,000 in the month prior). Since we need to create 127,000 a month just to keep pace with population growth that means lately we’ve been falling even farther behind. In fact, at last month’s rate, the U.S. will find itself another 3,190,000 jobs in arrears after another 4 ½ years of Obama’s economic policies [(127,000 – 69,000) * 55 months]. So we need to keep a close eye on the next official Employment Situation Report, and each subsequent report through Election Day. Anything short of a 127,000 increase in Nonfarm payroll jobs adds to the current jobs deficit, while a greater result means we’re at least moving in the right direction.

The New Jobs Benchmark

If we tweak Paul Krugman’s original jobs benchmark with the revised figures, we discover that to be meaningful, the number of jobs we need to create to return to more or less full employment by December of 2014 is now as follows:

  • In order to keep up with population growth, we would need to create 127,000 jobs times 31 months, or 3,937,000. Add in the need to make up for lost ground and we’re at around 15,679,000 (3,937,000 + 11,742,000) over the next 31 months — or 505,774 jobs a month.

However, if we just simply write-off Barack Obama’s first 3 ½ years as a foolish, but costly experiment, and extend the target date until May of 2017, then we come up with the following:

  • In order to keep up with population growth, we would need to create 127,000 jobs times 60 months, or 7,620,000. Add in the need to make up for lost ground and we’re at around 19,362,000 (7,620,000 + 11,742,000) over the next 60 months — or 322,700 jobs a month.

In other words, we are worse off today than we were 2 ½ years ago. Every month that we create 506,000 jobs or more puts us on track towards full employment within 2 ½ years. Every month we create 320,000 jobs puts us on track towards full employment within 5 years. But every month we create fewer than 127,000 jobs increases the jobs deficit and pushes the goal of full employment farther away.

The Bottom Line: Due to the Great Recession, we already had a jobs deficit of 5,165,000 when Barack Obama was sworn into office, but since then the deficit has increased by an additional 6,577,000 (see table). In other words, we’re NOT moving in the right direction, no matter what Barack Obama says. So who’s going to get us out of this ditch — the same guy who just dug a hole twice as deep as the one we were already in — or someone else?

Data Table: Real Jobs Deficit Spreadsheet on Google Docs

Obama Jobs Scorecard, Part 3 : The American Dream

“53 Percent of All Young College Graduates in America are either Unemployed or Underemployed” ~ The Economic Collapse

* By: Larry Walker, Jr. *

It is a fact that the U.S. economy has lost a total of 4,884,000 Nonfarm jobs since the beginning of the Great Recession. But according to the National Bureau of Economic Research, the recession officially ended three years ago. We would all like to believe that things aren’t so bad, that the glass is half full, but for many the American Dream appears to be fading away. The question we should be asking ourselves, three years into this economic recovery, is whether we are creating a sufficient number of jobs each and every month: (1) to keep pace with population growth, and (2) to recover the number of jobs already lost? Today, we will provide the answer.

The Working-Age Population

The Civilian Non-institutional Population, or as I prefer to call it, the Working-Age Population, includes persons 16 years of age and older residing in the 50 States and the District of Columbia, who are not inmates of institutions (i.e. penal and mental facilities, or homes for the aged), and who are not on active duty in the Armed Forces. According to the Bureau of Labor Statistics, Table A-1, one month before the recession began, the working-age population totaled 232,939,000, and as of May 31, 2012 it had grown to 242,966,000. Thus, the working-age population has increased by 10,027,000 persons since the start of the recession, and by 7,931,000 since they keys were handed to Barack Obama (see chart below).

Since we know that the economy had already lost a total of 3,514,000 jobs during the last 13 month’s of President Bush’s term, that it has shed another 1,370,000 jobs since Barack Obama’s inauguration, and that the working-age population has grown by 10,027,000 persons over the same period, the question is how many jobs must we create each and every month in order to catch-up? And in light of the answer, how does anyone get away with a statement like the following: We’ve created 4.3 million new jobs over the last 27 months, over 800,000 just this year alone. The private sector is doing fine?

Krugman’s Benchmark

In Paul Krugman’s December 2009 article entitled, The Jobs Deficit, he proposed a rather useful benchmark for the level of jobs the U.S. must create each month to really matter. As of November 2009 we had lost about 8.4 million jobs from the time the recession began. He began with the Economic Policy Institute’s (EPI) estimate that we need to add 127,000 jobs per month just to keep pace with population growth. That very same month, EPI pointed out that when you put together the number of jobs lost since the recession, along with the number required to keep pace with the population, that in order to return to pre-crisis unemployment within two years we needed to add 580,000 jobs a month.

Krugman conceded that there was no way this was going to happen within two years. So he proffered a more modest goal: a return to more or less full employment in 5 years. According to his formula, in order to keep up with population growth over those 7 years (December 2007 to December 2014), “the United States would have had to add 84 times 127,000 or 10.668 million jobs.” Krugman stated, “If that sounds high, bear in mind that we added more than 20 million jobs over the 8 Clinton years.” He continued, “Add in the need to make up lost ground, and we’re at around 18 million jobs over the next five years — or 300,000 a month.”

So using Krugman’s 300,000 jobs per month benchmark beginning in December 2009, I have created the following chart showing where we are today (in red), versus where we would be if we were truly keeping pace with population growth and making up for the jobs lost due to the recession (in blue). As you can see, we are currently more than 5.4 million jobs short of where we need to be.

The Great Recession officially ended in June of 2009 (a fact that many seem to gloss over), and as of November 30, 2009 it had consumed 8,403,000 jobs. A total of 3,514,000 had already been lost when President Bush handed the job off to Barack Obama, but an additional 4,889,000 jobs were lost during Obama’s first 11 months. It was at this point that Paul Krugman set forth this reasonable benchmark. We have needed to create 300,000 jobs per month, since December 2009, to keep up with population growth, and to recover the jobs lost up to that point. However, where we find ourselves today is 5,481,000 jobs short of the mark.

Yet, it was on June 8, 2012 when Barack Obama declared, “We’ve created 4.3 million new jobs over the last 27 months, over 800,000 just this year alone. The private sector is doing fine.” However, what he was talking about was the number private sector jobs recovered since March 2010. What he conveniently forgot to mention is the fact that we also lost 5,135,000 Nonfarm jobs during his first 14 months in office. What about that Mr. President? In fact, had he bothered to include the number of public sector, or government jobs, his statement would have been more accurately stated as follows: ‘We’ve recovered 3,765,000 Nonfarm jobs over the last 27 months, but we lost 5,135,000 during my first 14 months in addition to the 3,514,000 lost under President Bush, so we have a long, long way to go.’

Yes it’s true, we have lost 1,370,000 jobs since Barack Obama was sworn into office, and that’s on top of the 3,514,000 jobs lost from the time the recession began until President Bush handed the keys to Mr. Obama. But the bad news is that not only have we suffered the loss of 4,884,000 Nonfarm jobs since December of 2007, but we must also account for the fact that during the current recovery, we are 5,481,000 jobs short of where we ought to be. At this point we need to not only make up for the 5,481,000 jobs we are short, but we need to do so while creating an additional 300,000 jobs per month by the end of 2014. In other words, if we apply Paul Krugman’s benchmark, we now have 31 months left to create 14,781,000 jobs (9,300,000 + 5,481,000). That means we need to seriously up the pace from last month’s gain of 69,000 jobs to 476,806 jobs per month.

When Barack Obama stood before a teleprompter this month, and gloated about how well his policies have done over the last 27 months of his 41-month term, he wasn’t being honest with the American people. His dishonesty regarding the economy, among other things, is why he deserves to lose this election by a landslide.

Labor Force Participation Ages 16 to 19

Like many Americans my age, I started working at the age of 16. Although my first job was only a part-time summer job, it was my first, and thus the beginning of my personal quest for the American Dream. My dream at the time was to open a savings account, buy a car (or at least pitch in on the gas), buy my own food and clothing, gain a sense of independence, and learn to be personally responsible.

There are kids who were 12 years old when the recession commenced, who are now 16 and looking forward to their first summer job, but if they can’t find work, they will miss out on some valuable lessons in the quest for the American Dream. There are others who are now 20 years of age who couldn’t find work four and a half years ago, and are still looking today. And there are yet others who were just starting college when the recession hit. We learned this month, that among recent college graduates, 53 percent find themselves either unemployed or underemployed. The dream is fading.

The Labor Force Participation Rate measures the Labor Force as a percentage of the Civilian Noninstitutional Population. According to the Bureau of Labor Statistics, Table A-1, the labor force participation rate for 16 to 19 year olds averaged 54.5% in 1976, when I was 16 years old (see chart above). It stood at 41.5% prior to the recession, but had declined to 38.5% by the time Barack Obama was sworn in. It has since continued in decline to an all time low of 34.2% as of May 31, 2012. So when I was 16, a young person had about a 50/50 shot at finding a job, but for today’s youth the chances are more like 30 out of 100.

The American Dream appears to be fading into the sunset, but according to Barack Obama, the private sector is doing fine. Apparently the economy is doing well enough in his eyes that last Friday was a prefect time for him to singlehandedly grant amnesty to the children of those who have crossed our borders illegally. Oh, give me a break! How does Obama get away with it? He gets away with it because Democrats let him. You all better wake up. You’re either part of the solution, or part of the problem. If you’re so stuck on a political ideology or party brand, that you can’t see the light of day, then God help you. God help us all. If you’re still on the fence, then what are you waiting for? It’s time for a plan that works, not four more years of lecturing, finger pointing and Constitutional violations.

The bottom line: After three and a half years of Barack Obama, we find ourselves 5,481,000 jobs in the hole. At this point we must not only make up this shortfall, but must do so while creating an additional 300,000 jobs per month. In other words, if we apply Paul Krugman’s reasonable benchmark, we have 31 months remaining to create 14,781,000 jobs (9,300,000 + 5,481,000). That means we need to seriously up the pace from last month’s anemic 69,000 jobs to 476,806 jobs per month. But that’s not going to happen until Barack Obama is sent back to Chicago.

Continued from…

Obama Jobs Scorecard, Part 2 : Beyond the Private Sector

Obama Jobs Scorecard, Part 1 : The Private Sector

Data:

Spreadsheets

Obama Jobs Scorecard, Part 2 : Beyond the Private Sector

“He might as well have said that his stimulus plan would provide a temporary fix and a temporary economic recovery, which may have to be repeated over and over again to provide the impression that we are getting somewhere, even if we are really just going broke.”

* By: Larry Walker, Jr. *

The Great Recession lasted for a total of 19 months, beginning in December 2007 and ending in June 2009. So the U.S. economy has technically been in a state of recovery for exactly three years. Yet, other than the federal government, which has realized a net gain of 234,300 non-postal employees, since the recession began, the rest of the economy is worse off today than it was on the day Barack Obama was sworn in.

We addressed the Private Sector in Part 1. Today we’ll examine Total Nonfarm Employment, which includes the Private Sector, the Federal government, and State & Local governments, in order to assess our economic progress, since Barack Obama promised to deliver “a new foundation for our lasting economic growth and prosperity”.

Government Sector

The chart below summarizes the Government employment situation since the start of the Great Recession. The figures come from the Bureau of Labor Statistics, Table B-1 – Establishment Data. The main highlights are outlined below the chart.

  1. The number of Federal government employees has increased by +75,000 from December 2007 through May of 2012. The federal government is the only sector of the economy with a net employment gain since the recession began. (Note: The huge spike represents temporary hiring by the U.S. Census Bureau.)

    1. Federal jobs grew by +33,000 during the last 13 months of President Bush’s term.

    1. Federal jobs have grown by an additional +42,000 during Barack Obama’s 41-month term.

    1. Non-postal workers increased by +234,300 [+82,100 during Bush’s last 13 months, and +152,200 during Obama’s 41-month term to-date].

    1. Postal workers decreased by -158,500 [-48,500 during Bush’s last 13 months, and -110,000 during Obama’s first 41 months].

  1. The number of State government employees has declined by -64,000 since December of 2007.

    1. State government jobs actually grew by +52,000 during the last 13 months of President Bush’s term.

    1. State government jobs have declined by -116,000 during Obama’s 41-month term to-date.

  1. The number of Local government employees has declined by -376,000 since the start of the Great Recession.

    1. Local government jobs continued to increase by +136,000 during the last 13 months of President Bush’s term.

    1. Local government jobs have since declined by -512,000 under the policies of Barack Obama.

Overall, the Government Sector has suffered a net loss of 365,000 jobs since the start of the Great Recession. But it’s important to note that 221,000 jobs were gained during President Bush’s final 13 months in office, while 586,000 jobs have been lost during Barack Obama’s 41-month term to-date. Digging a little deeper, we find that, since the baton was passed to Obama, 628,000 State and Local government jobs have been lost, while 42,000 Federal jobs were gained. Since government employment did not decline during the 19 months comprising the Great Recession, nor during President Bush’s term, who’s to blame for the decline?

You would think that a decline in the number of State & Local government workers is a good thing, but Barack Obama doesn’t think so. He has thus proffered more government borrowing and spending to fix the alleged problem. But as I pointed out previously, and it’s only common sense, even if the Federal government handed State and Local governments $1.0 trillion to rehire all 628,000 workers, whom they can obviously no longer afford, they will find themselves dumbfounded when the taxpayer funded handout expires.

Thus far, all of Barack Obama’s economic proposals have been temporary fixes, one after another. But the barrage of temporary measures hardly lines up with his 2009 rhetorical promise, that his stimulus plan would ‘lay a new foundation for our lasting economic growth and prosperity’. It’s been three and a half years, and he still doesn’t seem to understand that government stimulus is by its very definition, temporary. He might as well have said that his stimulus plan would provide a temporary fix and a temporary economic recovery, which may have to be repeated over and over again to provide the impression that we are getting somewhere, even if we are really just going broke.

Total Nonfarm Jobs

In Part 1, we discovered that a total of 3,735,000 Private Sector jobs were lost during the first 13 months of the Great Recession, and that an additional 784,000 have been lost since Barack Obama promised that his stimulus plan would, save or create more than 3.5 million jobs by January of 2011’. But now, as we factor in the number of government sector jobs gained or lost since the recession began, we discover the following facts.

  1. Total Nonfarm jobs declined by 3,514,000 during the last 13 months of President Bush’s term.

  2. Total Nonfarm jobs have declined by an additional 1,370,000 during Barack Obama’s 41-month term to-date.

Overall, the U.S. economy has lost a total of 4,884,000 nonfarm jobs since December of 2007. Among them, 1,370,000 have been lost since Barack Obama was sworn into office. So his claim, that we have created 4.3 million jobs over the last 27 months, is wishful thinking. In reality, we lost 5,135,000 nonfarm jobs during his first 14 months in office. Do the math. The facts speak for themselves. And although the Federal government has gained 234,300 new non-postal workers, 152,200 of which are attributable to Mr. Obama, we haven’t created a single net job in the last 54 months. The chart above summarizes where we are statically, but as we shall see, the real employment situation is far worse.

That’s the end of Part 2, but it’s still not the end of the story. In Part 3 we’ll discuss how the increase in the Working-Age Population, since December 2007, in conjunction with a decline in the Labor Force Participation Rate, has made the real employment situation far worse than it appears, placing the American Dream in jeopardy.

To be continued… Obama Jobs Scorecard, Part 3 : The American Dream

Continued from… Obama Jobs Scorecard, Part 1 : The Private Sector

Obama Jobs Scorecard, Part 1 : The Private Sector

According to Barack Obama, “We’ve created 4.3 million new jobs over the last 27 months, over 800,000 just this year alone. The private sector is doing fine.” But what he failed to mention is what any American paying attention already knows, that we lost 5.0 million jobs during the first 14 months of his 41-month term.

* By: Larry Walker, Jr. *

Using simple math, it doesn’t take much for any American to figure out that Mr. Obama has been in office for a total of 41 months. Curiosity leads us to believe that there must be some reason Mr. Obama isn’t saying anything about his first 14 months in office. So here’s what we found. By the time Mr. Obama reached the White House, the private sector had already lost 3.7 million jobs to the Great Recession. Then between January of 2009 and February of 2010, his first 14 months in office, another 5.0 million jobs were lost. And finally, over the last 27 months, 4.3 million jobs were either created or saved. Once again simple math leads us to the conclusion that the private sector is worse off today than before Mr. Obama was sworn in, by roughly 700,000 jobs.

Over George W. Bush’s eight-year term, the economy went through two recessions. The first was much shorter than the second, lasting only nine months, from March of 2001 to November of 2001. But the Great Recession lasted for a period of 19 months, commencing in December of 2007 and not ending until June of 2009, six months into Mr. Obama’s term. However, in the month after the Great Recession began, the number of private sector jobs reached an all-time record high of 115,647,000. In fact, when we summed together all private sector employment gains and losses during Mr. Bush’s time in office, it resulted in a net gain of 3,970,000 jobs through January of 2008. But once the recession heated up, from its beginning until the baton was passed to Barack Obama in January of 2009, a total of 3,735,000 of this net gain had been wiped out. As a result, the number of net jobs gained during the Bush presidency was a paltry 147,000 (see chart above, and table below).

Obama’s First 14 Months

In January of 2009, Barack Obama stepped in to rescue us from the disaster of 2008. His stimulus plan was passed by both houses of Congress on February 14, 2009. At the time, Mr. Obama delivered the following statement. “Congress has passed my economic recovery plan – an ambitious plan at a time we badly need it. It will save or create more than 3.5 million jobs over the next two years, ignite spending by business and consumers alike, and lay a new foundation for our lasting economic growth and prosperity. But the promises he made on that day would soon come back to bite him.

Obama’s economic team calculated that without the stimulus plan, the economy would lose another 1,613,000 jobs over the ensuing two-year period. But with passage of the stimulus bill, they claimed that not only would those 1,613,000 jobs be saved, but an additional 1,887,000 would be created, all by January of 2011. But as you can see in the table below, Mr. Obama’s economic team was way off the mark. By February of 2010, just one year later, an additional 5,051,000 private sector jobs were lost. This brought the total number of jobs lost from the beginning of the Great Recession to 8,786,000. Fortunately, this turned out to be the end of the decline.

Obama’s Broken Promises

By January of 2011 it was time to tally the results of Mr. Obama’s $831 billion stimulus plan. As the next table reveals, instead of saving 1,613,000 jobs and creating another 1,887,000, from the beginning of his term through January of 2011 the private sector had instead lost a net total of 3,617,000 jobs. This brought the total number of private sector jobs lost since the beginning of the Great Recession to 7,352,000.

Since the recession had already wiped out 3,735,000 private sector jobs before Mr. Obama came along, if his plan had worked as promised, then the number of jobs lost to the recession should have been reduced to 1,848,000 by January of 2011. But instead this number rose to 7,352,000. In other words, if 1,613,000 jobs were expected to be lost and saved over his first 25 months, then there should not have been any losses at all. And since we were already 3,735,000 jobs in the red before Mr. Obama’s time, if the private sector had created 1.887,000 jobs as promised, then by his 25th month we should have only been off target by 1,848,000 jobs (3,735,000 minus 1,887,000). Thus, the stimulus plan failed miserably. When Barack Obama was sworn in, he inherited an economy that was 3,735,000 jobs in the hole, but after two years of his policies, and $831 billion tax dollars squandered on his stimulus plan, the private sector lost an additional 3,617,000 jobs.

Are we there yet?

Skipping ahead to May of 2012, we find that since the time of Mr. Obama’s inauguration, the private sector has lost a total of 784,000 private sector jobs, for an average loss of 19,122 jobs per month. This is in addition to the 3,735,000 lost under Mr. Bush, for a cumulative loss of 4,519,000 jobs since the beginning of the Great Recession (see table below). In other words, the private sector is worse off today than it was on the day Barack Obama was sworn into office. And if you will, not only is the private sector worse off than it was three years and five months ago, the Federal government has taken on an additional $5.3 trillion in debt just to get us where we are – nowhere.

The total number of private sector jobs lost, since the beginning of the Great Recession, is shown graphically in the chart below. In spite of his repetitious rhetoric, and no matter how many times he boasts that his policies have “created 4.3 million private sector jobs over the last 27 months,” the truth is that not one private sector job has been created since the beginning of Barack Obama’s 41-month term.

The Bottom Line: No one likes to discuss Mr. Obama’s initial 14 months in office, but it will nevertheless go down in history as a part of his record. The truth is that over his first 14 months the private sector lost 5,051,000 jobs. Then during his last 27 months it recovered 4,267,000 of the jobs lost during his first 14 months. So it was only after suffering far worse job losses under the influence of Mr. Obama than we started with, that the private sector was able to recover 4,267,000 of the 5,051,000 jobs lost during his 41-month term. So where is the private sector today? We are still down by the same 3,735,000 jobs lost to the Great Recession before Mr. Obama arrived, plus an additional 784,000 lost during his 41-month term to-date. Yet, Mr. Obama seems to think that the private sector is doing fine, and that for some reason he deserves a second shot. Sorry pal, but we don’t have another $5.3 trillion to throw away.

That’s the end of Part 1, but it’s not the end of the story. In Part 2 we’ll tack on the total number of Government sector jobs, Federal, State and Local, lost over Mr. Obama’s 41-month term. Then we’ll discuss how the 8.2 million person increase in the Working-Age Population, during Mr. Obama’s term, has made the real employment situation far worse than it appears to a casual observer.

Note: Some economists and pundits will attribute the 839,000 jobs lost in January of 2009, Mr. Obama’s first month in office, to Mr. Bush. If you insist on doing so, then that would mean that the total number of private sector jobs gained over Mr. Obama’s 40-month term would be 55,000 (i.e. 839,000 minus 784,000). However, the number of jobs lost since the beginning of the Great Recession is unchanged, at 4,519,000. But before you start boasting about how Barack Obama added 55,000 private sector jobs over his 40-month term, you might want to consider whether a job creation record averaging just 1,375 jobs per month is worth the effort.

To be continued… Obama Jobs Scorecard, Part 2 : Beyond the Private Sector

The Private Sector is NOT Doing Fine | How’s the Federal Government Doing?

* By: Larry Walker, Jr. *

“The Private Sector is doing fine.” ~ Barack Obama *

A couple days ago, Joe Weisenthal wrote an article, inappropriately entitled, “Here’s What’s Really Happened to the Private Sector Under Obama”, in which he sought to prove why Mr. Obama will be reelected. His premise, like Obama’s, is that the Private Sector is doing fine, but State and Local governments aren’t. There was no mention at all of how the Federal government, the part of the economy Mr. Obama actually influences, is doing (see the chart above). However, what Mr. Weisenthal actually did was highlight the main reasons why Mr. Obama should not be reelected, and should lose by a landslide in November. I hate to burst Mr. Weisenthal’s bubble, but he’s in La-La Land if he thinks his 24 chart presentation will convince even Mr. Obama to defend his own senseless remark.

First of all, Mr. Weisenthal’s article was inappropriately titled because by definition, the “Private Sector” is not “under Obama”, as he so implies. To the contrary, the only part of the economy Mr. Obama presides over is the Federal government, whose $16 trillion debt, $5.3 trillion of which has been added by Obama himself, actually imposes a drag on the private economy. Yet, Mr. Weisenthal supports Mr. Obama’s plea for more Federal borrowing, to be expended at the State and Local level. Secondly, Mr. Weisenthal doesn’t provide any benchmarks. It’s as if he’s comparing the pre-2010 Obama to the post-2009 Obama. That’s all well and good, but if this were baseball, Mr. Obama would be heading back to the Minor Leagues (and so he is).

Here’s a brief summary of Mr. Weisenthal’s main points (in bold type) and my comments. You may view his 24-chart catastrophe here.

  1. ‘Corporate profits after tax are higher than ever.’ – I concur. But this is primarily due to corporate austerity, which has nothing at all to do with Mr. Obama. Although some corporations have been able to increase sales, most all of them have actually improved profitability through reductions in labor and other operating costs. We call this productivity, which is something Mr. Obama could learn from, but not something he practices within his sphere of influence.

  2. Rental Income is higher than ever. – I agree. But, the fact that more than 3.3 million families lost their homes since September of 2008, and are now forced to rent, is hardly anything to boast about. Could there be any other reason for the 125% increase in rental income since the recession began, such as some program implemented by Mr. Obama? The claim that rental income has reached a new record, under the policies of Barack Obama, is more of an admission of failure than anything else.

  3. ‘Gross private domestic investment is coming back nicely.’ – If you consider a rebound to 1999 levels a nice comeback, that’s all fine and well, but I think it’s rather pathetic. By the way, this particular chart has actually moved sideways and to the right since 1999, not upwards. So far in 2012, it looks like most of what should go towards gross private domestic investment is actually being invested into U.S. Treasury’s. After all, someone has to buy all of the newly created Federal debt, and the Federal Reserve appears to be closed for business, at least for the time being.

  4. ‘The private sector has been adding jobs steadily since the end of Obama’s first year, and today there are more private sector jobs than there were before Obama took office.’ – Did he say, ‘since the end of his first year’? Of course no good Democrat should ever discuss Obama’s first year in office. It’s as if he took over the reigns in January of 2010, instead of 2009. In reality, the Private Sector lost a total of 5,051,000 jobs between January of 2009 and February of 2010, before things started to turn around. Even still, the Private Sector has only gained 55,000 jobs over the last three years and four months (not including the 839,000 jobs lost in January of 2009). This represents an annual growth rate of just 0.015%, and a total growth rate of a mere 0.050%.

    Meanwhile, the Working Age Population increased by more than 8.2 million over the same period. So let’s see, that’s 55,000 private sector jobs created since Obama took office, for 12.2 million unemployed workers (4.0 million who had already lost their jobs before Obama took office, and another 8.2 million who reached working age during his term). That’s gotta be a record alright, but it’s not exactly the kind of record either Mr. Weisenthal, or Mr. Obama should be ginning up.

  5. ‘It would be great if the [Private] Sector were stronger, but things are going up and to the right in these charts.’ – Yes, and things are going up and to the right in some other charts as well. For example, Federal budget deficits (shown below) are far outpacing any of the statistics above. The fact that a chart is moving upwards and to the right doesn’t mean anything on its own merits. The following questions come to mind. Is this good or bad? What’s the trend? What’s the growth rate? Is it keeping pace with population growth? How is its performance against other benchmarks? Comparing the last two years and five months of Obama to his first year in office, and then drawing conclusions, is like saying that a baseball player with a batting average of .000 in his first year and who is now batting .00015 has improved. Yeah, he’s improved alright, but he won’t be playing in the Majors next year.

  6. ‘Total government employment is far below where it was when Obama started office.’ – This is true, and it’s actually a good thing. Who can afford to pay for more public sector workers when more than 23 million Americans are either unemployed or underemployed? Mr. Weisenthal and Mr. Obama seem to think that more State and Local government hiring will solve our unemployment problem. What they really mean is that the Federal government should take more money from a shrunken private sector labor force to pay others. What planet have they been living on? Apparently neither one of them received the memo issued in November of 2010.

  7. ‘Why is employment going down? Because state and local government spending growth has hit its lowest level ever.’ – The first part of this statement is false; the second part is true. To say that the decline in State and Local government spending is causing the decline in employment may fire the emotions of a few State and Local government workers, but it’s simply untrue. State governments employed a record 5,198,000 workers in January of 2009, versus 5,073,000 today. Local governments employed a record 14,588,000 in January of 2009, versus 14,077,000 today. So State and Local government employment is only off the mark by 636,000 from an all time high in January of 2009. If all 636,000 workers were rehired tomorrow, how would that solve the problem for the 23 million Americans who are either unemployed or underemployed?

    Although it’s true that State and Local government spending has declined, the reason is that revenues have plummeted. Unlike the Federal government, State and Local governments can’t spend money they don’t have. Nor should they borrow what they can’t repay. The decline in revenues is due to the downturn in real estate values, high unemployment, and the need to cover unfunded pension liabilities. With legal requirements to balance their budgets and an inability to print their own currencies, State and Local governments are prohibited from implementing the disastrous borrow-and-spend policies of Washington, DC.

  8. During the crisis, the state & local pain was mitigated by aid from the Federal Government, but that has since dropped off dramatically. – He’s referring to the part of Obama’s $831 billion Stimulus Program that went to State and Local governments in 2009/2010. Remember that? The problem is that it didn’t work then, and it won’t work now. The reason it didn’t work the first time is because it’s not the Federal government’s job to tell State and Local governments what to do. The Federal government is not in charge of State and Local budgets and thus cannot mandate more hiring.

    State and Local governments legislate according to the desire of their residents; they don’t take orders from Washington. State and Local government officials actually have to live under the policies they implement. They are in-touch with their constituents, while Mr. Obama seems to be completely out-of-touch with most of America. Even if the Federal government handed State and Local governments another $1.0 trillion to hire more workers, how would they pay those same workers in subsequent years? And if they have to pay the money back as well, how will they be able to pay the additional workers while repaying the loans? Ideas that make sense to a desperate reelection campaign are not always practical in the real world, or in the best interests of anyone other than the candidate. Think about it.

Monetizing the Debt

Mr. Obama presides over the Federal government, whose $16 trillion national debt imposes a drag on the Private Sector. For example, in 2011 the Federal Reserve monetized 77% of the Federal deficit (see chart below). By the way, that’s the opposite of what it said it would do. Eventually the Fed will have to reduce its Treasury holdings, and as you can see, the last time it did so the economy went straight into recession. Maybe the Fed can afford to sit on piles and piles of low interest Federal debt forever, but that doesn’t mean everyone else can, or will. The question Mr. Weisenthal ought to be asking himself is where will the Federal government get the money to repurchase this debt? It will ultimately come out of the Private Sector, through higher taxes, fees, and fines. The prospects for additional Federal borrowing are growing slim.

Private Sector Employment Benchmarks

Mr. Weisenthal’s charts don’t provide any benchmarks, so I will. Assuming that Private Sector Employment should grow at the same rate as the working age population, approximately 1.0% annually, the chart below compares actual Private Sector jobs growth to a 1.0% benchmark, beginning with the terms of the last 5 presidents.

  • By the end of Ronald Reagan’s first term, Private Sector Employment beat the benchmark by 2,088,000 jobs. He was reelected based on his pro-business policies.

  • By the end of Reagan’s second term, Private Sector Employment had topped the benchmark by 8,248,000 jobs.

  • By the end of George H.W. Bush’s only term, Private Sector Employment fell behind the benchmark by 2,466,000 jobs.

  • By the end of Bill Clinton’s first term, Private Sector Employment beat the benchmark by 6,901,000 jobs. He was reelected based on small government, pro-business policies.

  • By the end of Clinton’s second term, Private Sector Employment had topped the benchmark by 13,291,000 jobs.

  • By the end of George W. Bush’s first term, Private Sector Employment had fallen behind the benchmark by 5,562,000 jobs. He was reelected based upon his strong defense and anti-terrorism policies, not for his economic record. Were it not for the War on Terror, Mr. Bush would have lost his reelection bid.

  • By the end of W’s second term, Private Sector Employment had fallen behind the benchmark by 9,100,000 jobs.

  • After three years and five month’s of Barack Obama, Private Sector Employment has fallen behind the benchmark by 3,801,000 jobs. Short of finding another reason, such as convincing Americans that the killing of thousands of innocent civilians in drone attacks is important to their security, Obama’s anti-business policies should make this his final term.

Federal Government Employment Benchmarks

Who wants more Federal workers? Instead of telling State and Local governments what to do, Barack Obama should spend some time figuring out how to shed the 29,000 Federal positions added under his administration. Assuming that Federal Government Employment should grow at 0.0% or less, the chart below compares actual Federal government jobs growth to a 0.0% benchmark, beginning with the terms of the last 5 presidents.

  • By the end of Ronald Reagan’s first term, Federal Employment exceeded the benchmark by 3,000 jobs.

  • By the end of Reagan’s second term, Federal Employment exceeded the benchmark by 195,000 jobs.

  • By the end of George H.W. Bush’s only term, Federal Employment dropped below the benchmark by 57,000 jobs.

  • By the end of Bill Clinton’s first term, Federal Employment dropped below the benchmark by 253,000 jobs.

  • By the end of Clinton’s second term, Federal Employment was below the benchmark by 347,000 jobs.

  • By the end of George W. Bush’s first term, Federal Employment dropped below the benchmark by 25,000 jobs.

  • By the end of W’s second term, Federal Employment exceeded the benchmark by 24,000 jobs.

  • After three years and five month’s of Barack Obama, Federal Employment has exceeded the benchmark by 29,000 jobs.

State Government Employment Benchmarks

Not that the Federal government has any control, but assuming that State Government Employment should grow at the same rate as the working age population, approximately 1.0% annually, the chart below compares actual State government jobs growth to a 1.0% benchmark, beginning with the terms of the last 5 presidents.

  • By the end of Ronald Reagan’s first term, State Government Employment dropped below the benchmark by 5,000 jobs.

  • By the end of Reagan’s second term, State Government Employment exceeded the benchmark by 183,000 jobs.

  • By the end of George H.W. Bush’s only term, State Government Employment exceeded the benchmark by 149,000 jobs.

  • By the end of Bill Clinton’s first term, State Government Employment dropped below the benchmark by 56,000 jobs.

  • By the end of Clinton’s second term, State Government Employment was below the benchmark by 9,000 jobs.

  • By the end of George W. Bush’s first term, State Government Employment dropped below the benchmark by 6,000 jobs.

  • By the end of W’s second term, State Government Employment was below the benchmark by 16,000 jobs.

  • After three years and five month’s of Barack Obama, State Government Employment has fallen behind the benchmark by 306,000 jobs.

Local Government Employment Benchmarks

The Federal government has no jurisdiction over Local governments, but assuming that Local Government Employment should grow at the same rate as the working age population, approximately 1.0% annually, the chart below compares actual Local government jobs growth to a 1.0% benchmark, beginning with the terms of the last 5 presidents.

  • By the end of Ronald Reagan’s first term, Local Government Employment dropped below the benchmark by 622,000 jobs.

  • By the end of Reagan’s second term, Local Government Employment was below the benchmark by 118,000 jobs.

  • By the end of George H.W. Bush’s only term, Local Government Employment exceeded the benchmark by 416,000 jobs.

  • By the end of Bill Clinton’s first term, Local Government Employment exceeded the benchmark by 334,000 jobs

  • By the end of Clinton’s second term, Local Government Employment was above the benchmark by 943,000 jobs.

  • By the end of George W. Bush’s first term, Local Government Employment exceeded the benchmark by 151,000 jobs.

  • By the end of W’s second term, Local Government Employment was above the benchmark by 207,000 jobs.

  • After three years and five month’s of Barack Obama, Local Government Employment has fallen behind the benchmark by 1,018,000 jobs. This is certainly not due to any lack of Federal spending.

The bottom line:

If the creation of 55,000 net Private Sector jobs, over 40 months, for 23 million unemployed or underemployed Americans, is considered “doing fine”, then Mr. Obama’s prospects for a second term, one in which another 8.0 million plus will reach working-age, should be nipped in the bud right now. Mr. Obama had a fair shot and his policies failed. If he is so concerned about State and Local government employment now, then why didn’t he focus his stimulus plan on this sector back in 2009? Instead he placed the emphasis on extending unemployment benefits, which actually exacerbated the problem. And why did he focus so much of his time on passing Obamacare, instead of worrying about how 23 million unemployed and underemployed Americans would be able to afford it? This isn’t Little League. When you’re batting .00015 in the Major’s, the chances of keeping your job are pretty much nonexistent.

If Barack Obama wants to control State and Local government budgets, then perhaps he should be running for Governor, Mayor, State Senator, County Commissioner, or City Councilman. If he wants to take credit for improvements in the Private Sector, then perhaps he should take a shot at running a corporation, in his next career. But if he wanted to continue as President of the United States, he should have paid more attention to the Federal budget while he had the job. There’s an old saying, “If you want a different result, try something different.” So make up your mind today, do you want more insanity, or something different?

References:

Here’s What’s Really Happened To the Private Sector Under Obama

U.S. Government Spending

Data: Spreadsheets

Adventures in Politicking II : No Shot

Repetitious Rhetoric vs. Genuine Policies

* By: Larry Walker, Jr. *

According to Barack Obama, “the President’s job is to make sure everyone has a fair shot.” But as I explained in Part I, the United States Constitution declares that a President’s real job is, “to the best of his/her Ability, to preserve, protect and defend the Constitution of the United States.” Whether or not Mr. Obama has abided by the true standard will soon be revealed, with the Supreme Court’s ruling on Obamacare. However, when judged according to his self-contrived measure, based upon his job performance to-date, Mr. Obama’s policies actually ensure that future generations of Americans will have ‘no shot’.

In my post entitled, “Stimulus: How China Created 22.0 Million Jobs While Obama Squandered 3.3 Million,” I compared the goals of the Chinese government to those of the Obama Administration. The reason Mr. Obama’s stimulus plan fell short wasn’t because the federal government didn’t spend enough; China’s two-year stimulus package cost an estimated $595.4 billion, while the Obama Administration spent more than $830 billion. The main reason the Obama-Plan faltered was because it didn’t raise the bar high enough. You see, the Chinese government set a goal of reaching full employment, while the Obama Administration merely sought to create 3.5 million jobs, by January of 2011. The fact that Mr. Obama set a goal of creating just 3.5 million jobs, at a time when more than 15 million Americans were unemployed, is telling.

Mr. Obama’s employment policies haven’t lived up to his self-contrived ideal of what a President should do. If a President’s job is to “make sure everyone has a fair shot”, then why didn’t Mr. Obama make full employment his objective? Wouldn’t this have been more consistent with a ‘fair shot’, than squandering better than $830 billion to salvage a mere 3.5 million jobs, while leaving 11.5 million people on the sidelines, to make due on unemployment benefits, welfare and food stamps? Although his repeated use of the catchwords “fair shot” may play well in politicking, if he means that everyone should have an opportunity to participate in the economy, then Mr. Obama has failed.

According the U.S. Bureau of Labor Statistics, since December of 2008, a month before his inauguration, the Civilian Labor Force has declined by 261,000 (from 154,626,000 in December of 2008, to 154,365,000 by April of 2012). See chart below.

During the same time-frame, the Working Age Population (Civilian Noninstitutional Population) grew by 7,749,000 (from 235,035,000 in December of 2008, to 242,784,000 by April of 2012). See chart below.

So while the Working Age Population has grown by nearly 8 million, during Mr. Obama’s term, the Labor Force has contracted by 261,000. Is the fact that nearly 8 million newly added Working Age Americans haven’t gotten a shot at participating in the economy, since Mr. Obama took the oath, consistent with his rhetoric? That depends on your definition of the catchphrase, “to make sure everyone has a fair shot”. Is ‘no shot’ synonymous with a ‘fair shot’?

To top it off, the Number of Working Americans (Employment Level) has declined by 1,463,000 during Mr. Obama’s term (from 143,328,000 in December of 2008, to 141,865,000 by April of 2012). See chart below.

Has Mr. Obama learned the lesson and since shifted his policies towards a goal of full employment? Not as far as we know. All we hear from him lately is that everyone should have a fair shot, pay their fair share of taxes, and play by the same rules, as if this hasn’t always been the case.

Aside from repetitious rhetoric, what grand policy is Mr. Obama now promoting to advance his goal of fairness? Will the act of raising taxes on millionaires, and everyone else for that matter, open up new opportunities for the next generation? If so, how does that work? Will offering tax credits to small business owners that hire more workers and pay them higher wages, while simultaneously raising their tax rates, do the trick? Not in my opinion (see Obama’s Economic Fallacy: The Not-To-Do List).

The Bottom Line: Since Mr. Obama believes that his job has been to “make sure everyone has a fair shot”, and since the Labor Force has declined by 261,000, while the Working Age Population has expanded by 7,749,000, and the number of Working Americans has fallen by 1,463,000, all since the beginning of his four-year reign, and since he has taken a pass on making full employment his goal, it may be concluded that what Mr. Obama really means by the expression, a fair shot, is “no shot”. However you slice it, Mr. Obama had his shot, and failed. He has no shot at reelection.

Related:

To Give Americans a “Fair Shot,” Obama Should Stop Violating Our Rights

Adventures in Politicking I : A President’s Job

* By: Larry Walker, Jr. *

“In America the President reigns for four years, and Journalism governs forever and ever.” ~ Oscar Wilde *

According to Barack Obama, the job of the President of the United States is to “make sure everyone has a fair shot.” However, according to Article II (Sections 1 – 3) of the United States Constitution, in which the job of the President is officially and clearly outlined, nowhere do we find such ‘verbage’. Therefore, it is unnecessary to try to figure out who’s included or excluded in ‘everyone’, and how fair a shot must be – before it becomes unfair. What a relief! So what’s the President’s real job?

According to the United States Constitution, a President’s main job is, to the best of his Ability, to preserve, protect and defend the Constitution of the United States. The Executive Power is vested in a President of the United States primarily to act as Commander in Chief of the Military, to Read the opinions of the Principal Officers of each Executive Department, and to Grant Reprieves and Pardons for Offenses against the United States, except in Cases of Impeachment.

The Constitution also grants a President the power, with the Advice and Consent of the Senate, to make Treaties, to appoint Ambassadors, other public Ministers and Consuls, Judges of the Supreme Court, and all Officers of the United States, although the Congress may by law vest the appointment of such inferior Officers in the President alone, or in the Courts, or the Heads of Departments.

The President also has the power to fill up all Vacancies that may happen during the Recess of the Senate, by granting Commissions which shall expire at the End of their next Session.

Thus far, there’s no mention of making sure everyone has a fair shot. Has the current POTUS made enough nominations to to fill the growing number of judicial vacancies? No.

Other than the duties mentioned above, a President is commissioned by the Constitution to, from time to time, give to the Congress information on the State of the Union, and recommend to their Consideration such Measures as he may judge necessary and expedient.

I believe our forefathers meant that a President should give Congress the actual state of the Union, not just the part that improves his chances for reelection. And by making recommendations to Congress, I don’t think they meant publicly browbeating and demonizing those who might disagree.

The President may also, on extraordinary Occasions, convene both or either Houses of Congress, and in Case of Disagreement between them, with Respect to the Time of Adjournment, he may adjourn them to such Time as he shall think proper. The President is further directed to receive Ambassadors and other public Ministers. Finally, a President must take care that the Law is faithfully executed, and to Commission all the Officers of the United States.

Well, that’s it. Nothing here about making sure everyone has a fair shot.

Although Article II (Section 3) states that the President shall from time to time recommend for Congressional consideration, such measures as he shall judge necessary and expedient, that’s not the same thing as roaming around the countryside espousing radical, partisan ideals about what he feels is fair and unfair. In fact, some would call Mr. Obama’s attempts to indoctrinate the most radical elements of the public to his personal philosophy, through making repetitious statements regarding his own notion of fairness, instead of listening to the Principal Officers of each Executive Department, and instead of making his recommendations directly to our elected Representatives, as outlined in the Constitution, many of whom express genuine concern over whether such ideals may lead our Nation to the brink of bankruptcy, akin to Treason.

In other words, instead of egging on the most radical members of the public, inciting many to violence, Mr. Obama should be talking with our Congressional Representatives and Senators. The act of advocating to the general public, a policy of raising taxes in the midst of a weak Global economy, based upon nothing more than his own personal beliefs, after having been warned of, and in spite of, the dire consequences which will surely follow, instead of doing his job as clearly outlined in the Constitution, should be treated as a Crime against the United States. This is precisely why Article II (Section 4) adds that the President, Vice President and all civil Officers of the United States, may be removed from Office upon Impeachment for, and Conviction of, Treason, Bribery, or other high Crimes and Misdemeanors.

Conclusion:

The job of the President of the United States is outlined in Article II of the U.S. Constitution. The President’s job is not to lecture the public as Professor in Chief, nor to make sure everyone has a fair shot, whatever that means. And to take it a step further, it really doesn’t matter whether a presidential candidate used to be a college professor, a community organizer, a State senator or Governor, or the Chief Executive Officer of a Private Equity Firm, what matters is whether he or she is capable of comprehending the duties of the Office, as outlined in the Constitution, and has the willingness and ability to carry them out.

The qualifications for being President of the United States are also found in Article II (Section 1). “No person except a natural born Citizen, or a Citizen of the United States, at the time of the Adoption of this Constitution, shall be eligible to the Office of President; neither shall any Person be eligible to that Office who shall not have attained to the Age of thirty-five Years, and been fourteen Years a Resident within the United States.” That’s it.

Is Obama qualified to be President? Is Mitt Romney qualified? Are Ron Paul, Gary Johnson, and Tom Hoefling qualified? Your guess is as good as mine, however, this Election isn’t about qualifications any more than it’s about some eccentric job description pulled out of thin air. This Election is about whether or not Mr. Obama has fulfilled the official job of President, not his make-believe ideal, to the satisfaction of the majority of the American people. It’s about whether we the people want real change, or perhaps just a freaking break. The fact that Mr. Obama has no idea what his job is, after nearly three-and-a-half years of on-the-job training, says a lot.

Related:

Hope and Change on Ice

Reference:

The United States Constitution