Budgeting 201: An Immediate Debt Crisis

USA vs. Cyprus: Gross Government Debt to GDP

– By: Larry Walker, II –

According to Speaker of the House John Boehner, “We do not have an immediate debt crisis.” No, then what would you call it? Seems to me it was immediate in 1995, and again in 2008, so what is it now? Are we just screwed? And according to Barack Obama, “We don’t have an immediate crisis in terms of debt. In fact, for the next 10 years, it’s gonna be in a sustainable place.” Yeah, what place is that, Wonderland? Have you people lost your minds?

The chart above is from data published by the International Monetary Fund in its World Economic Outlook Database, October 2012. Based on what’s happening in Cyprus, for some reason I don’t believe either of them. We had an immediate debt crisis in 1995 when our debt-to-GDP ratio reached 71%, insomuch that the government was shut down. And another in 2008 when it reached 76%, just before all hell broke loose. And now suddenly, as gross U.S. debt has surged beyond 100% of GDP, the problem is no longer immediate. If the debt isn’t an immediate problem, when will it become one? Let me answer that for you.

The debt will become an immediate crisis when our economy inevitably dips into recession, a phenomenon which has occurred historically about once every 5 years since World War II. In fact, recession is exactly what’s happening in Cyprus right now. But surely recession will never reoccur in the U.S., because government fixed that problem once and for all, right? I mean it cost us around $6.7 trillion over the last four years, but the problem is solved, right? With GDP surging at a robust growth rate of 0.4% (revised) in the 4th Quarter of 2012, how can our government possibly be wrong? Oh give me a break!

I believe part of what exacerbated the crisis of 2008 was an excessive amount of government debt. So what do you think is going to happen with our debt hovering above 100% of GDP, as the next crisis hits? Is the U.S. government prepared for another recession? Is there anything left in the tank? It sure doesn’t look like it. Well, we’re not going to sit around and let the government continue to tax us to death, and we’re definitely not going for the unlawful seizure of our money and property, so I suggest you government guys get your act together and get serious about your spending problem, and that means now.

Instead of loosening standards and letting everyone who wants to – go on disability, welfare and food stamps; granting any illegal alien who desires – a free pass; and subsidizing any and everyone’s health insurance bill, while the other half of us and our grandchildren get stuck with the bill, now is the time to tighten standards and cut the slack. The sequester is right! Reducing the size of government is right!

Government needs to learn how to say, “No”. It should be, ‘Sorry, you’re going to have to go back to work, and you’re going to have to go back to your own country, and you’re going to have to chip in on taxes, because we can’t have 50% of the populace taking care of everyone else.’ If our government doesn’t learn how to say no, it’s going to destroy this nation and along with it our freedom. Yes, the debt is an immediate crisis, and it is an imminent threat to the survival of the Republic.

The chart above is from the Federal Reserve Bank of St. Louis. I’ll ask again. Does this look like it might be an immediate crisis, or just a tiny little problem years and years from now? It sure looks immediate to me, but maybe I’m just a bit more focused on surviving the unknowns, than sitting around fooling myself into thinking everything is going to be rosy ten years from now, if I just fold my hands, play a little more golf, and trust that someone else will handle it for me. Yeah, just like Cyprus, right? It’s time to stop playing politics and face reality.

References:

My Data – USA vs. Cyprus: Debt to GDP

IMF: World Economic Outlook Database, October 2012

Related:

Budgeting 101: A Balanced Approach

What Does Sequestration Mean To You?

From AAA to AA- in Four Years

Uncorrelated: GDP and National Debt

#Debt

Budgeting 101: A Balanced Approach

I do believe that at some point government has borrowed enough. Although tax revenue is directly tied to economic growth, government spending is not.

– By: Larry Walker, II –

How does one balance a budget? Let me count the ways. Spend less than you take in annually, and you’ll live within your means. But how can governments comply? Why that’s easy. Simply calculate the rate of revenue growth in the previous year, then adjust the prior year’s spending level by this multiple for the current year. If a deficit ensues, trim spending back into balance. If a surplus results, pass it back to taxpayers in the form of tax rate reductions. Most of us would call this a balanced approach.

Of course proponents of big-government will retort, “It doesn’t work like that. We must spend around 50% or more than we take in, to stimulate revenue; so that we can spend around 50% more than we take in, to stimulate even more revenue; so that we can spend around 50% more than we take in, stimulating ever more revenue, ad infinitum…” Yet, it’s rather obvious that the modern day extreme left-wing’s touted correlation between government borrowing and economic growth is nonexistent, as we proved in – Uncorrelated: GDP and National Debt.

It might be helpful for far left-wingers to remember the words of the Original Democrat, Andrew Jackson, who once said, “I am one of those who do not believe that a national debt is a national blessing, but rather a curse to a republic; inasmuch as it is calculated to raise around the administration a moneyed aristocracy dangerous to the liberties of the country.” For more, see my post entitled, From AAA to AA- in Four Years.

You see, “For Jackson politics was very personal,” says H.W. Brands, an Andrew Jackson biographer at the University of Texas. “He hated not just the federal debt. He hated debt at all.” Before he was president, Jackson was a land speculator in Tennessee. He learned to hate debt when a land deal went bad and left him with massive debt and some worthless paper notes. Thus, unlike POTUS #44, Jackson brought practical business experience to the White House.

When he ran for president, Jackson knew his enemy: banks and the national debt. He called it “the national curse”. In Jackson’s mind, debt was “a moral failing”, says Brands. “The idea you could somehow acquire stuff through debt almost seemed like black magic.” But now days, if you listen closely to the Democratic Party, its enemy is no longer the national debt, but rather the average, anti-debt, fiscally responsible, Tea Party patriot.

The Balanced Approach

What would the federal government’s surpluses and deficits look like had it followed a balanced approach since 1929? Per the chart below, having begun with a surplus of $1 billion in 1929, the federal government would have realized a surplus of $835 billion in the 3rd quarter of 2012, compared to an actual deficit of around $1.1 trillion. Of course, all surpluses along the way could have been returned to taxpayers through periodic tax rate reductions, making income tax compliance at least somewhat worthy of the effort.

Under the balanced approach, when all spending is totaled from 1929 through 2012, the federal government would have spent a total of $39.4 trillion, versus the $66.9 trillion actually spent, for savings of $27.5 trillion. That means instead of a national debt fast approaching $17 trillion, we could be sitting on a national surplus of around $10.5 trillion.

The Unbalanced Approach

In contrast, what has the federal government’s unbalanced approach yielded? Per the second chart (below), having begun with a surplus of $1 billion in 1929, the federal government wound up running a budget deficit of approximately $1.1 trillion in the 3rd quarter of 2012. As you can see, the main imbalance has occurred since the year 2008, which is when the federal government adopted its current philosophy, where expenditures are completely decoupled from revenue growth – as if spending is suddenly a function of an imaginary 22nd Century economic boom. Meanwhile, approximately $6.7 trillion has been added to the debt since 2008, and the economy grew at a paltry annual rate of 0.4% (revised) in the 4th Quarter of 2012.

Conclusion

Although federal tax revenue is a function of economic growth, government spending is not. In other words, as the economy grows, tax revenue increases; and as it shrinks, tax revenue declines. Anyone who doesn’t understand this should return to the 6th grade for a refresher in basic math. On the other hand, government spending is a function of revenue. That is to say, as tax revenue rises and falls, so follows the amount available for government expenditures. Surpluses and deficits are directly linked to the level of government spending. When government spends less than it takes in, there is a surplus; when it spends more than it takes in, a deficit. It’s really that simple.

If the federal government is to ever regain control over spending, it must start with the rate of revenue increase (or decrease) in the previous year, since this is the only reasonable way of projecting the amount available for the current year, and then adjust its current year spending level accordingly (up or down). As soon as a deficit appears, the role of government is to trim spending back into balance. When a surplus results, government’s role is to pass the savings back to taxpayers, in the form of tax rate reductions. This we call, “the balanced approach” – and there is none other. Don’t patronize me. There is really only one question, Will the Democratic Party ever recover its bygone common sense?

Reference:

My Worksheet on Google Drive

BEA: Table 3.2. Federal Government Current Receipts and Expenditures

Related:

From AAA to AA- in Four Years

Uncorrelated: GDP and National Debt

#Debt

GAO: “No Opinion” on U.S. Financial Audit

Comments on 2012 Financial Statements of the U.S. Government

– By: Larry Walker II –

The Government Accountability Office (GAO) is required to audit financial statements for the U.S. government each year. What the GAO found in its Fiscal Year 2012 Audit published on January 17, 2013 is clearly unacceptable. If you take a few moments to read the report, what you’ll discover is that not only has the U.S. government been operating without a budget for the last three years, but even worse its books and records are so out of order that financial auditors were unable to render an opinion. You can bet that all the major credit rating agencies are paying attention and will render an opinion when judgment day arrives, and that day should be right around the corner. Following are some highlights from the latest report (in italics) along with a brief commentary.

Disclaimer of Opinion

“Because of the federal government’s inability to demonstrate the reliability of significant portions of the U.S. government’s accompanying accrual-based consolidated financial statements for fiscal years 2012 and 2011, principally resulting from limitations related to certain material weaknesses in internal control over financial reporting and other limitations on the scope of our work, we are unable to, and we do not, express an opinion on such accrual-based consolidated financial statements. As a result of these limitations, readers are cautioned that amounts reported in the accrual-based consolidated financial statements and related notes may not be reliable.”

Based on the auditor’s inability to express an opinion on the federal government’s financial statements, it is my opinion that any request to raise the debt ceiling should be summarily denied. Were the federal government a private entity, its creditors would be cashing out now and asking questions later. But since the federal government has a seeming unlimited ability to borrow without ever reducing its debt principal, perhaps my personal perceptions are overly rational. Then again, any decision based upon uncertainty or unreliable information can later come back to bite. If the federal government’s financial statements are so unreliable that auditors are unable to express an opinion, my gut instinct is to limit exposure, cut losses and move on.

“While significant progress has been made in improving federal financial management since the federal government began preparing consolidated financial statements 16 years ago, three major impediments continued to prevent GAO from rendering an opinion on the federal government’s accrual-based consolidated financial statements over this period: (1) serious financial management problems at DOD that have prevented its financial statements from being auditable, (2) the federal government’s inability to adequately account for and reconcile intragovernmental activity and balances between federal agencies, and (3) the federal government’s ineffective process for preparing the consolidated financial statements.”

The Department of Defense (DOD) is no longer the largest drag on the federal budget; the Department of Health and Human Services (HHS) came in at number one last year, while the Social Security Administration (SSA) clocked in at number two, responsible for 23% and 22% of net federal costs, respectively. DOD now represents the 3rd largest item in the federal budget, consuming 21% of the government’s $3.8 trillion in net costs for FY 2012, yet its financial statements are currently not auditable. That means we really have no idea what DOD is buying, what it already owns, or the true nature of its future liabilities.

Further, according to GAO, most of the increase in DOD’s cost during FY 2012 was attributed to its Military Retirement Fund and other benefits programs. Since at the same time, the bulk of HHS and SSA costs come from major social insurance and postemployment benefits programs administered by those agencies (e.g., Medicare for HHS, and Social Security for SSA), that means better than 50% of federal spending (more than $1.9 Trillion) is directed towards retirement security, medical care, and other social welfare programs, which technically account for the entire $1.3 trillion shortfall realized by the federal government in FY 2012, and then some.

Intragovernmental Insanity

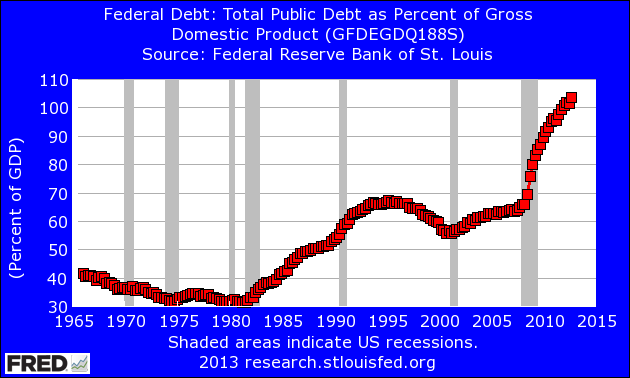
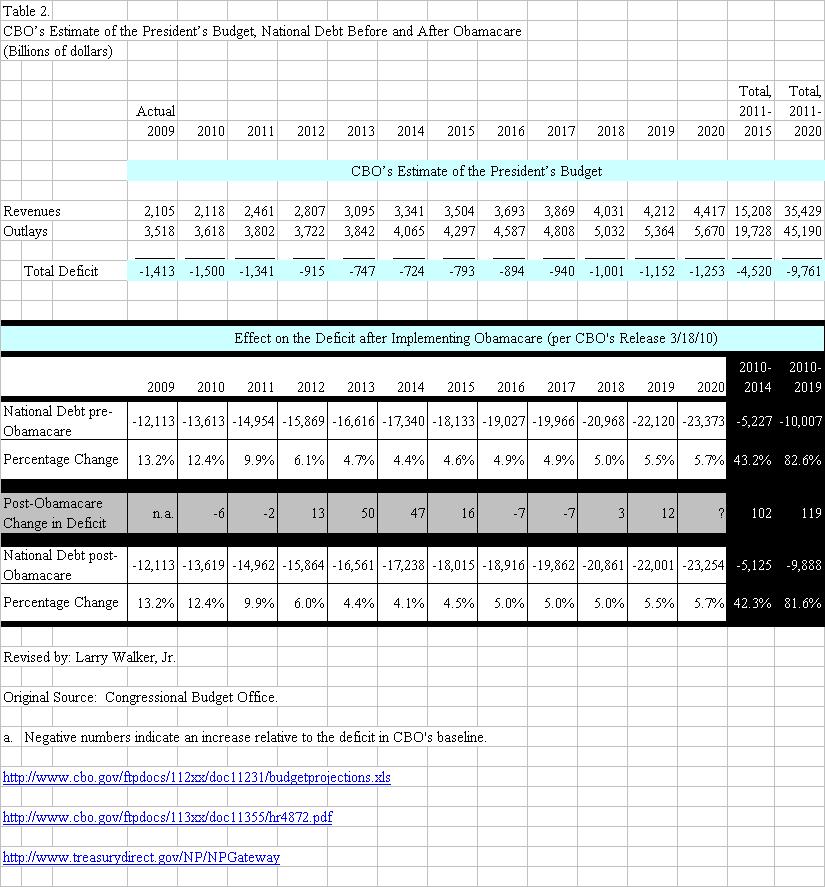
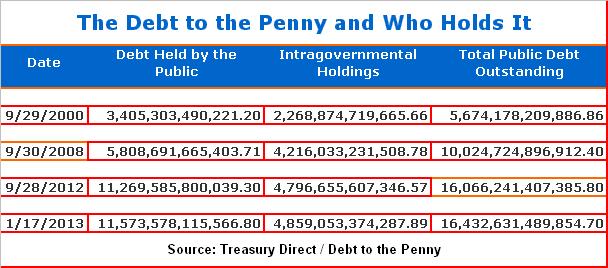
The national debt is comprised of debt held by the public and intragovernmental holdings. Intragovernmental holdings are debts the federal government owes to itself, a phenomenon only possible within the realm of the criminally insane. For example, as of the end of FY 2012, the Treasury has borrowed a total of $2.7 trillion from the Social Security Administration (its entire Trust Fund), and more recently from federal employee pension funds in order to meet its unmanageable over-inflated obligations. The total debt outstanding has grown from $5.7 trillion at the end of fiscal year 2000 to $16.4 trillion as of January 17, 2013. Included within this figure, intragovernmental debt has grown from $2.3 trillion at the end of fiscal year 2000 to $4.9 trillion as of January 17, 2013 (see table below).

As if the sheer weight of its total debt isn’t bad enough, according to GAO, the federal government can no longer adequately account for and reconcile its intragovernmental activity or the balances owed between federal agencies. Here’s an example. Back on June 28, 2010, the United States Postal Service, Office of Inspector General (OIG) discovered that the Postal Service had made a $75 billion overpayment to the Civil Service Retirement System (CSRS). However, since according to Note 24 of the GAO report (page 120), the Civil Service Retirement and Disability, and Civil Service Health Benefits Program Trust Funds are currently $849.1 billion and $240.0 billion in the hole, respectively, why would CSRS care?

USPS to CSRS: “Hey, you guys owe us $75 billion.”

CSRS to USPS: “Hey, give us a break; we’re already over a trillion dollars in the hole.”

USPS to CSRS: “My bad, we keep forgetting.”

World War Infinity

“Prior to 1917, the Congress approved each debt issuance. In 1917, to facilitate planning in World War I, Congress established a dollar ceiling for Federal borrowing. With the Public Debt Act of 1941 (Public Law 77-7), Congress and the President set an overall limit of $65 billion on Treasury debt obligations that could be outstanding at any one time. Since then, Congress and the President have enacted a number of debt limit increases. Most recently, pursuant to the Budget Control Act (BCA) of 2011, the debt limit was raised by $400 billion in August 2011 to $14.694 trillion, by $500 billion in September 2011 to $15.194 trillion, and by $1.2 trillion to $16.394 trillion in January 2012.”

Let’s make this clear. Prior to 1917, Congress approved each and every debt issuance request made by the Treasury Department. It was with the outbreak of the 1st World War that a debt ceiling was first established. This gave the Treasury some latitude in keeping the government afloat without impairing wartime activities. So it would make sense that after the end of World Wars I and II, Congress would resume its role of approving each debt issuance. But instead, the U.S. government has morphed into a permanent war mentality. Now, a small minority of borderline insane pundits are actually advocating for complete removal of any form of debt ceiling. It’s World War Infinity, they surmise. Like spoiled little children, they have conned themselves into believing that the role of government is to borrow and spend our way into a utopian entitlement paradise. Where are the adults?

Material Weaknesses

“In addition to the material weaknesses underlying these major impediments, GAO identified four other material weaknesses. These are the federal government’s inability to (1) determine the full extent to which improper payments occur and reasonably assure that appropriate actions are taken to reduce improper payments, (2) identify and resolve information security control deficiencies and manage information security risks on an ongoing basis, (3) effectively manage its tax collection activities, and (4) effectively monitor and report loans receivable and loan guarantee liabilities.”

While a minority within the realm of the spoiled and irresponsible are vying for total removal of any limits on the national debt, we have just been informed that the federal government has no control over improper payments, no ability to manage information security risks, cannot effectively manage its tax collections, and is unable to effectively monitor and report its loans receivable and its ballooning loan guarantee liabilities. It seems to me that the federal government should get a grip on its internal infrastructure before another dime is borrowed or spent. However, even if the federal government were able to show improvement in these areas, there are other issues on the horizon threatening to derail its entire operation.

Risks and Uncertainty

According to GAO, there are risks that other factors could affect the federal government’s financial condition in the future, including the following:

  • The U.S. Postal Service (USPS) is facing a deteriorating financial situation as it reached its borrowing limit of $15 billion in fiscal year 2012 and finished the year with a reported net loss of almost $16 billion.

  • The Federal Housing Administration (FHA) reported that its liabilities exceeded its assets by about $15 billion as of September 30, 2012, and that the capital ratio for its Mutual Mortgage Insurance Fund fell below zero during the fiscal year. In addition, the ultimate roles of Fannie Mae and Freddie Mac in the mortgage market may further affect FHA’s financial condition.

  • Several initiatives undertaken during the last 4 years by the Board of Governors of the Federal Reserve System to stabilize the financial markets have led to a significant change in the composition and size of reported securities on the Federal Reserve’s balance sheet. The value of these securities, which include mortgage-backed securities guaranteed by Fannie Mae, Freddie Mac, and the Government National Mortgage Association, is subject to interest rate risk and may decline or increase depending on interest rate changes. Therefore, if the Federal Reserve sells these securities at a loss, future payments of Federal Reserve earnings to the federal government may be reduced.

The USPS, FHA, and Federal Reserve are in over their heads, and either technically bankrupt, or soon to be. Yet, the only answer proffered by our so-called leaders in Washington, DC is to keep borrowing. Is this really the only viable solution? The Post Office borrowed $15 billion and then lost almost $16 billion last year. Does that sound like an entity worthy of another loan? Not in my world. It seems to me that instead of continuing to prop it up, it’s time for the USPS to go the way of the dinosaurs. The FHA and Federal Reserve can follow suit.

Also according to GAO, examples of assets and liabilities reported by the federal government that are subject to substantial uncertainty include the following:

  • The federal government’s consolidated financial statements as of September 30, 2012, include approximately $109 billion of investments in two government-sponsored enterprises—the Federal National Mortgage Association (Fannie Mae) and Federal Home Loan Mortgage Corporation (Freddie Mac) (reported net of about $85 billion in valuation losses). In addition, as of September 30, 2012, the financial statements include about $9 billion of liabilities for future payments to Fannie Mae and Freddie Mac and disclose a projected maximum remaining potential commitment to these entities of about $282 billion under agreements between Treasury and the entities. The future structures of these two government-sponsored enterprises and the roles they will serve in the mortgage market must still be determined.

  • The federal government reported Troubled Asset Relief Program (TARP) direct loans and equity investments of approximately $40 billion as of September 30, 2012 (reported net of about $23 billion in valuation losses), of which approximately $20 billion related to loans to and equity investments in certain entities in the automotive industry.

  • The federal government reported that the Pension Benefit Guaranty Corporation’s (PBGC) liabilities exceeded its assets by about $34 billion as of September 30, 2012. PBGC is subject to further losses if plan terminations that are reasonably possible occur.

In other words, the federal government “invested” $109 billion into Fannie Mae and Freddie Mac, which resulted in $85 billion in valuation losses, yet it plans to invest another $291 billion going forward. Another $63 billion was invested in loans made to TARP, which reported $23 billion in valuation losses ($20 billion of which is attributable to loans made to the auto industry). And the PBGC’s liabilities now exceed its assets by around $34 billion and it may be subject to further losses going forward. And what’s the federal government’s solution? Raise the debt ceiling, borrow more, and keep propping up failed entities, otherwise it fears the whole house of cards may come crashing down. Perhaps it’s time to get real and just go ahead and begin dismantling the entire criminal enterprise, one failed agency, entity and fund at a time.

Conclusion

The GAO was not able to express an opinion on the U.S. government’s financial statements, but that doesn’t stop us from reading between the lines. Either we deal with our fiscal problems now, or later. Leaving my granddaughter’s a legacy of failure is not something I’m willing to support. It’s time to grow up, and demonstrate it by cutting the federal government down to its bare bones. Do this today and we might have a chance; wait until tomorrow, and according to GAO, the U.S.A.’s debt-to-GDP ratio will reach 395% by fiscal year 2087 and rise continuously thereafter. If Congress raises the federal government’s debt ceiling without fundamental fiscal reform, then we all deserve everything we’ve got coming to us, nothing. Until such reform takes place, government ilk can count me out. Don’t call me, don’t write me, don’t ask me to invest in federal debt issues, and don’t dare ask me for another dime.

References:

Financial Audit: U.S. Government’s Fiscal Years 2012 and 2011 Consolidated Financial Statements

What GAO Found

Related:

War on Wealth III | National Debt Review

Postal Service OIG Discovers $75 Billion Overpayment, Again

Social Security: A Breach of Trust – Notes on 2010 Financial Statements of the U.S. Government

Recovery (dot) Fail | Not Jobs

Wrong Track

Employment Situation Worse: Year-Over-Year

By: Larry Walker, Jr.

The Bureau of Labor Statistics (BLS) released their employment situation report on Friday July 2, 2010. My analysis is meant to expose facts that most casual observers ignore. Instead of the general month-to-month comparison, I am assessing changes in the employment situation over the last twelve months. This expanded view will tell us whether or not the Recovery Act is working. I will begin with my conclusions, followed by excerpts from the BLS report, and end with my analysis.

Conclusion: The employment situation is worse than it was a year ago. Although the U-6 unemployment rate stood unchanged at 16.5%, the population increased by 2.0 million, while the labor force fell by 1.0 million, making the employment situation unsustainable. The number of marginally attached and discouraged workers rose to 2.6 million, an increase of 415,000 year-over-year. The number of unemployed persons rose by 317,000. There are 919,000 fewer jobs than there were a year ago.

So much for, “the recovery is working.” So much for Progressive-Economics, the main tenets of which appear to be:

  1. Borrow huge sums of money from taxpayers and foreigners.

  2. Spend it in ways that won’t necessarily lead to job creation (i.e. tax cuts for all except for those who would use it to create jobs; more government jobs; mandatory health care; etc…)

  3. Raise taxes on the remaining smaller pool of workers who survive Steps 1 and 2, in order to pay for Step 1.

  4. Repeat Steps 1 through 3 (if you manage to survive after Step 2).

The following excerpts are from the latest BLS report entitled, THE EMPLOYMENT SITUATION — JUNE 2010:

Total nonfarm payroll employment declined by 125,000 in June, and the unemployment rate edged down to 9.5 percent, the U.S. Bureau of Labor Statistics reported today. The decline in payroll employment reflected a decrease (-225,000) in the number of temporary employees working on Census 2010. Private-sector payroll employment edged up by 83,000….

Both the number of unemployed persons, at 14.6 million, and the unemployment rate, at 9.5 percent, edged down in June….

In June, the number of long-term unemployed (those jobless for 27 weeks and over) was unchanged at 6.8 million. These individuals made up 45.5 percent of unemployed persons….

In June, about 2.6 million persons were marginally attached to the labor force, an increase of 415,000 from a year earlier. (The data are not seasonally adjusted.) These individuals were not in the labor force, wanted and were available for work, and had looked for a job sometime in the prior 12 months. They were not counted as unemployed because they had not searched for work in the 4 weeks preceding the survey….

Among the marginally attached, there were 1.2 million discouraged workers in June, up by 414,000 from a year earlier. (The data are not seasonally adjusted.) Discouraged workers are persons not currently looking for work because they believe no jobs are available for them. The remaining 1.4 million persons marginally attached to the labor force had not searched for work in the 4 weeks preceding the survey for reasons such as school attendance or family responsibilities….


Table A (click to enlarge)

A Year-over-year Analysis of the Employment Situation (Table A)

Unemployment Rate – The official unemployment rate has changed by 0.0%, from 9.5% in June of 2009 to 9.5% in June of 2010. This can be attributed to the success of the Economic Recovery Act, if you call ‘no change’ a success. However, according to table A-15, counting all marginally attached and discouraged workers, the U-6 unemployment rate, currently 16.5% was also unchanged year-over-year. (U-6 takes into consideration the total that BLS considers unemployed, plus all persons marginally attached to the labor force, plus total employed part time for economic reasons, as a percent of the civilian labor force plus all persons marginally attached to the labor force.)

The U-6 unemployment rate stood unchanged at 16.5% year-over-year.

Table A-15, click to enlarge

Civilian Labor Force – According to the BLS, the civilian labor force has declined by a little over 1 million workers, from 154.8 million in June of 2009 to 153.8 million in June of 2010. From table A-16 we learn that out of the 1 million who disappeared, 415,000 are no longer being counted because they are considered to be marginally attached (i.e. persons who want a job, have searched for work during the prior 12 months, and were available to take a job during the reference week, but had not looked for work in the past 4 weeks). Once identified, marginally attached workers are no longer counted as part of the labor force. Out of the 415,000, 414,000 are considered to be newly discouraged workers.

The number of persons no longer counted as part of the labor force, because they have stopped looking for work, increased by 415,000 year-over-year.

Civilian non-institutional population – The civilian population increased by slightly more than 2 million, from 235.6 million in June of 2009 to 237.7 million in June of 2010. So while the population increased by a little over 2 million, the labor force shrunk by 1 million, which is clearly unsustainable.

The employment situation is unsustainable.

Persons no longer in the labor force – The number of persons no longer in the labor force increased by 3.0 million, from 80.9 million in June of 2009 to 83.9 million in June of 2010. We learn from Table A-16 (below) that out of this 3.0 million, 415,000 more than a year ago are considered marginally attached (i.e. persons who want a job, have searched for work during the prior 12 months, and were available to take a job during the reference week, but had not looked for work in the past 4 weeks). We also learn from Table A-16 that a total of 6.5 million Americans who want jobs are not counted as part of the labor force, an increase of 7,000 year-over-year.

The number of marginally attached and discouraged workers rose to 2.6 million, an increase of 415,000 year-over-year.

Table A-16, click to enlarge

Number of unemployed – According to the BLS, the number of unemployed persons fell by 98,000 from 14.7 million in June of 2009 to 14.6 million in June of 2010. However, this figure ignores the increase in those considered marginally attached, so in reality the number of unemployed persons increased by 317,000 (415,000 more marginally attached minus 98,000 fewer unemployed persons) year-over-year. See Civilian Labor Force (above).

The number of unemployed persons rose by 317,000 year-over-year.

Number of employed – The number of persons employed fell by 919,000, from 140.0 million in June of 2009 to 139.1 million in June of 2010. In other words, there are 919,000 fewer people working than there were a year ago. I don’t know why Obama is out boasting about the success of his ‘Recovery Program’ when it is clearly a dud. Speaking in plain English, since there are currently 919,000 fewer jobs than there were a year ago, no jobs have been created or saved within the last twelve months (see Table A above).

There are 919,000 fewer jobs than there were a year ago.

Data Sources:

BLS Employment Situation: http://bls.gov/news.release/empsit.toc.htm

BLS Employment Summary: http://bls.gov/news.release/empsit.nr0.htm

Table A: http://bls.gov/news.release/empsit.a.htm

Table A-15: http://bls.gov/news.release/empsit.t15.htm

Table A-16: http://bls.gov/news.release/empsit.t16.htm

Progressive Regression II | Financial Regulation Crisis

– By: Larry Walker, Jr. –

Government Regulation vs. Self-Regulation

Once again, the Progressive Obama Administration’s magical solution, for all problems American, is more government regulation. But is government regulation really any better than self-regulation? Progressive government regulation is even worse. (A Progressive regulator is pictured to the left.)

I contend that banks and financial services companies have a direct interest in the safe, efficient, and profitable business of making loans, investments, and protecting assets. Would it benefit a bank to carelessly make loans to unqualified borrowers, taking the risk of never being repaid? No. Would it benefit a financial services company to recommend investments in financial instruments that continually lose money? No. Every private sector company has a direct interest in self-regulation.

Surely there will be incidents of fraud, theft, and abuse, but when such incidents occur, private companies will pay stiff fines under applicable Federal and State laws. When it is discovered that laws have been violated, corporate employees, and executives often face stiff fines and/or prison time. But what happens when government regulators screw up?

On August 9, 2007, former SEC Commissioner, Roel C. Campos officially announced his resignation.

On October 2, 2007, former SEC Commissioner, Annette L. Nazareth, a nine-year SEC veteran, officially announced her resignation.

On August 13, 2008, Florida’s top financial regulator, Don B. Saxon resigned before he could be fired. He was blamed for lax enforcement of state laws which allowed convicted felons to be licensed as mortgage brokers, including individuals who took part in mortgage fraud.

On January 26, 2009, Timothy Geithner, former President of the Federal Reserve Bank of New York, was sworn in as Secretary of the Treasury.

On May 7, 2009, Stephen Friedman, the former chairman of the Federal Reserve Bank of New York, abruptly resigned; days after questions arose about his ties to Goldman Sachs.

When regulators make costly mistakes most of them simply resign, disappearing into the shadows with taxpayer funded golden-parachutes. However, in some cases (Geithner) they get promoted. So there is no accountability when it comes to government regulation.

The case against more government regulation:

Raymond Richmond, in his latest article, Geithner and Summers Make Their Economic Mistakes Transparent, reminds us that the last major governmental intrusion into the private financial sector is what created our current recession. Instead of learning the valuable lesson that ‘government regulation equals no regulation’, the Progressive Obama Administration’s solution, like a junkie in relapse, is more of the same. “This time it will be different.”

“Here at home, we are on the verge of completing the most sweeping financial reform in more than 70 years.”

They failed to mention that the last major intervention in bank regulation caused this recession. Beginning in 1977 with the Community Reinvestment Act, every administration pressured the banks to make loans on easy terms, turning their eyes away from the housing bubble they were causing and the dangerous lack of collateral backing most mortgages. Government created two Government Sponsored Enterprises, Fannie Mae and Freddie Mac to create a secondary market for such ill-fated loans. Wall Street got into the act and created derivatives which brokers sold all over the world. When the housing bubble burst, the U.S. and Europe’s largest banks and insurance companies faced bankruptcy, and stock markets round the world collapsed. The U.S. does not need new bank regulations; it needs to keep the politicians from making decisions that should be left to the shareholders of private firms who have the major stake in the firm’s success. This is the lesson that should be learned around the world.

The past year and a half has seen unemployment grow in the U.S. to double digits, factories disappear, witnessed a worsening in the distribution of income, saw soaring government budget deficits, saw the U.S. dollar, the world’s standard, lose more than a third of its value in foreign exchange.

Prospects have never been worse. And all of these are the product of government intervention in the private economy. This is the lesson the G-20 ought to learn, government intervention in the economy usually does more harm than good. That would include intervention in the economy by the G-20, should it become an institution that makes and enforces decisions.

Michael Pomerleano in a Financial Times article entitled, The Failure of Financial Regulation, explains how government regulation failed. This is more proof that all of the time, effort, and money spent on government financial regulation has been for naught.

The regulation and supervision of the banking system rest on three pillars: disclosure to ensure market discipline, adequate capital and effective supervision.

Did the regulatory philosophy governing our financial markets withstand the test of the recent crisis? My conclusion is that all three regulatory pillars failed.

Was adequate information available before the crisis erupted? The information on the subprime exposure was out there for anyone who had the determination to collect and [analyze] the (sometimes patchy) data from quarterly 10Q reports filed with the Securities and Exchange Commission for US banks, supplemented by rating agencies’ and investment banks’ research reports.

A final question we need to ask is how effective was the supervisory apparatus in this crisis?

It is reasonable therefore to infer that the regulatory agencies would have taken notice of those estimates as early as the autumn of 2007. For a long time the regulatory and supervisory apparatus was silent.

We need to question why didn’t any regulator add up the potential size of the losses on the sub prime exposure, based on publicly available information, and verify them with on-site examinations?

Why wasn’t there a far more forceful response from the supervisory agencies? Equally, we should have expected credit rating agencies, investment research and investors to respond more forcefully. In this context, one can only express puzzlement and disappointment at the tepid regulatory reaction. Only after the monumental policy mistake of allowing Lehman Brothers to fail, did the authorities grasp the full significance of the problems and we witnessed a systematic effort to manage and contain the crisis.

Finally, Glenn Hubbard in his Harvard Business Review Article, Financial Regulation: It’s Not About More, reminds us that over-regulation by the government can do more harm than good.

…the economic concern that over-regulation of financial instruments and institutions in the name of safety can lead to aggregate harm — most obviously by raising the cost of funds to household and business borrowers. The key is to design regulation to insure proper pricing of risk and information about risk — such an approach (not that really taken in the bill winding its way through Congress) offers the right balance between protection of the individual and society.

The end result of the Progressive Obama Administration’s magical plan of more government regulation will lead directly to higher costs for American consumers and businesses. Businesses will pass their costs on to customers. Consumers will be hurt. Those who get hurt the most will be those on the lowest end of the economic food chain. Thus, the end result of Barack Obama’s cowardly, status quo, regressive, regulation policies will be to harm those that he claims to be helping.

Smaller government and less governmental regulation will lead to lower taxes, lower consumer prices, greater accountability, more freedom, and more opportunities for wealth creation. What exactly have we gotten in return for all of our money that has been squandered on regulating the financial industry? What will we get with Obama’s ‘more of the same’ approach?

Final: Obamacare | The Macro View

The Endgame

Catch 22 –

By: Larry Walker, Jr. –

Point #1 – As I pointed out previously here, and as you can see in the top portion of the table below, Mr. Obama has outlined a budget which contains deficit spending of $-3.7 trillion more than the CBO’s Baseline Budget, between the years 2011 and 2020. The CBO’s Baseline Budget was already $-5.9 trillion in the red for the budget years 2011 through 2020. If you start with fiscal year 2010, the CBO’s Baseline Budget deficit was already $-7.3 trillion. The CBO’s estimate of the President’s budget calls for total deficit spending of $-11.2 trillion beginning with fiscal year 2010 and ending in fiscal year 2020. (Note: The baseline budget total is for 2011-2020, so you have to add 2010 to get this figure.) Now if you add the President’s budget deficit of $-11.2 trillion to our National Debt which was $-12.1 trillion at the end of 2009, then the national debt will reach $-23.3 trillion by the year 2020.

Table 1 - Click to Enlarge

Point #2 – You will note in the bottom half of the table above (re-posted below), that the National Debt, which was $-12.11 trillion at the end of 2009, is projected to grow to $-22.12 trillion by the year 2019. (Note: The totals on this table end with fiscal year 2019 to correspond with the scoring of Obamacare.) This represents a percentage increase of 82.6% over the 10 year period. So before Obamacare, the President was already on target to increase our National Debt by 82.6% over the present decade.

Point #3 – Also in the table below, you will note that after implementing Obamacare, if one adds in the savings projected by the CBO of $119 billion over the first decade, then the National Debt is projected to grow to just $-22.00 trillion, or a percentage increase of 81.6% over the decade. This means that Obamacare will decrease the rate of growth of the national debt by just 1.0% in the first decade (82.6% vs 81.6%). In other words, by the year 2019, the National Debt will either be $-22.00 trillion with Obamacare, or $-22.12 trillion without it. (Note: I omitted the other $19 billion of savings which the CBO projected because I do not believe it to be attributable to Obamacare, however this is diminimus.)

Table 2 - Click to Enlarge

Point #4 – You will note that the CBO projects the savings from Obamacare to be $102 billion over the first five years, and only $17 billion over the second five, for a total of $119 billion in the first decade. The greatest savings appear in the years 2013 and 2014, $50 billion and $47 billion respectively. Why would anyone believe that there would suddenly be savings of over $1 trillion in the second decade, when the rate of savings decreases so dramatically in just the second five year period? If you study the numbers closely, the rate of savings from Obamacare declines by 83% from the first five years to the second. Yet, we are expected to believe that the rate of savings will suddenly jump by 740% (to over $1 trillion) during the second decade. This is simply unrealistic. Not to mention, unreliable, because the CBO calculated the savings rate in the second decade as a percentage of GDP. What we don’t have from the CBO is a projection of the Federal Budget that far out. If budget deficits continue to soar during the second decade after Obamacare, then any savings projected will be nullified.

Point # 5 – With government spending so out of control – with the national debt projected to grow to either $-22.12 trillion without, or $-22.00 trillion with Obamacare by 2019 – with the national debt projected to grow by either 82.6% without Obamacare, or 81.6% with it – it’s as if Obama and his Progressive colleagues have chosen to stick their heads in the sand, and to ignore the problem. The problem being the inability to pay for current federal programs. They are giddy and claiming victory because they think they have finally come up with a deficit neutral program, but what have they really done?

What have they done? – The term ‘deficit neutral’ implies that a program is implemented in a way that will not add to the deficit. But what does it mean for us as relates to Obamacare? What does it mean when government spending is already out of control? It means that the government will raise around $500 billion in new taxes, fees and fines in order to pay for a new entitlement program, Obamacare. It’s one thing to raise revenues in order to begin to balance the existing budget, but entirely another to ignore the debt, and to take more money out of our pockets for a new program. Meanwhile, the National Debt continues to grow at essentially the same rate.

Obamacare solves nothing. By the year 2020, the national debt will be nearly twice the amount of our current GDP. If we don’t take the debt crisis seriously, then by the year 2020 there will be no Obamacare, no Social Security, no Medicare, no Education, no Defense, and possibly not even a United States of America. Obamacare and its sister entitlement programs are not the solution to our problems, Obamacare and its sister entitlement programs are the problem.

Sources:
http://www.treasurydirect.gov/NP/NPGateway
http://www.cbo.gov/ftpdocs/113xx/doc11355/hr4872.pdf
http://www.cbo.gov/ftpdocs/112xx/doc11231/budgetprojections.xls
Obamacare: A Fiscal Point of View Updated!

Obama’s Tax Fallacy

By: Larry Walker, Jr. [Updates in Red]

Barack Obama – “I gave 95% of all Working Families a tax cut…”

Really?

First of all 43.4% of Americans don’t pay any income taxes. That leaves the rest of us. So did 95% of the 56.6% who actually pay income taxes get a tax cut? I doubt it, but even if that were true, it’s not 95% of all Americans (or ‘working families’, whatever that means) [see Tax Fallacy II: 95% B.S. for more on this].

Is a refundable tax credit the same as a tax cut?

But the real fallacy lies in the fact that refundable tax credits are not tax cuts, but rather, they are subsidies. Subsidies are paid for by taking money from some Americans and giving it to others. This is also known as ‘spreading the wealth around’.

I’m not very cheery knowing that while I have been faithfully paying my mortgage, people are buying foreclosed houses down the street for $110K less than what I owe. And not only that, but the Government is giving them an $8,500 subsidy out of my tax dollars. It’s as if the $110K of potential equity wasn’t enough of a subsidy. Also, when the government refunds a person $8,500 to buy a house, it only applies to those who bought houses, not to 95% of all Americans.

The $400 ($800 for joint filers) Making Work Pay Credit is also a refundable tax subsidy. It is however only available in full to those (a) who made less than $75,000 ($150,000 for joint filers), (b) is reduced if income exceeds these amounts, (c) and it is not available at all for those making over $95,000 ($170,000 for joint filers) in 2009. Is it possible that 95% of Americans who actually pay income taxes made less than $95K ($170K for joint filers) and will get the full credit? Not when the top 50% of wage earners pay 96% of income taxes.

The earned income credit is a well known tax subsidy. If you made $10,000 and have a child, you will pay no taxes and will get back a $4,043 tax subsidy ($3,043 earned income credit, plus $1,000 child tax credit). This is not a tax cut, but rather a 40.43% bonus awarded for not trying very hard.

Non-refundable tax credits represent true tax cuts, as they can only be used to reduce the amount of tax actually owed, with the balance being lost. The child care credit is an example of a non-refundable tax credit, and has not changed in years. The retirement savings credit would be a good way to cut taxes, but unfortunately if you made over $27,750 ($55,500 for joint filers), you don’t qualify. The education credit used to be a way to cut taxes, yet it is already $2,500 per year, so nothing new was stated by Obama when he said he will give out a $10K credit over 4 years. Uh, we already have that, sir. [What is new, however, is that as of 2009, now 40% of the education credit has become a refundable tax subsidy.]

Another tidbit, right now, all three of my kids are in college. I’m divorced and they live with their mother out of state. I am paying part of the way for one while the other two have full scholarships. Because I don’t claim any of them as dependents, I am not allowed any credit for the tuition that I’m paying. I wonder how many others are in the same boat. It’s not that I want anything from the Government, but just want to let you know that there are cracks in the real world.

Capital Gains Tax Cut for Small Business?

Finally, Obama wants to give a Capital Gains Tax Cut for Small Business Investment. What does that mean? A capital gains tax cut only applies if someone has an appreciated asset to sell, which they have held for more than one year. So, first you have to have an appreciated asset. Then you have to either have a small business that buys and sells appreciated long-term assets, or would need to sell your business in order to benefit. The only problem with what Obama said is that the lower Capital Gains Tax rate that we already have, which is currently 0% for those in a 15% or lower tax bracket, already applies. Nothing new here.

As a small business owner I haven’t quite figured out how anyone can really use this one. And what kind of tax rate are we talking about anyway? He didn’t say anything specific. The only way I could use it is if I sold my business. But I don’t want to sell the business. And if I did sell my business I would already benefit from the Section 1244 exclusion or the low capital gains rate.

While you are applauding Obama’s words, you should stop and think about how a capital gains tax cut can benefit a small business. If anyone can explain it to me, I’ll be glad to listen, but to me, it’s just rhetoric.

In conclusion, all I heard from Obama tonight, regarding taxes, was the same class warfare, wealth redistribution rhetoric that I heard in 2008 when I cast my ballot for the other guy.

___________________________________________________

References:

http://www.taxpolicycenter.org/numbers/displayatab.cfm?Docid=2276&DocTypeID=7