
Charting Insanity
– By: Larry Walker, Jr. –
Sorry but I can’t seem to find the extreme left-wing’s touted correlation between government borrowing and economic growth. They say things like: “We have to spend more to keep from going broke,” and, “For every dollar spent on unemployment and food stamps, $2.00 is put back into the economy.” But such statements don’t appear to have any rational basis, and as we shall see, no basis in fact.
For example, in 1988 while the national debt increased by 10.7% over the preceding year, real GDP* increased by just 4.1%, and then when the national debt shot up by 13.2% in 1990, real GDP merely increased by 1.9%. It looks to me like the more the government borrows, the worse the economy performs, but maybe it’s just me.
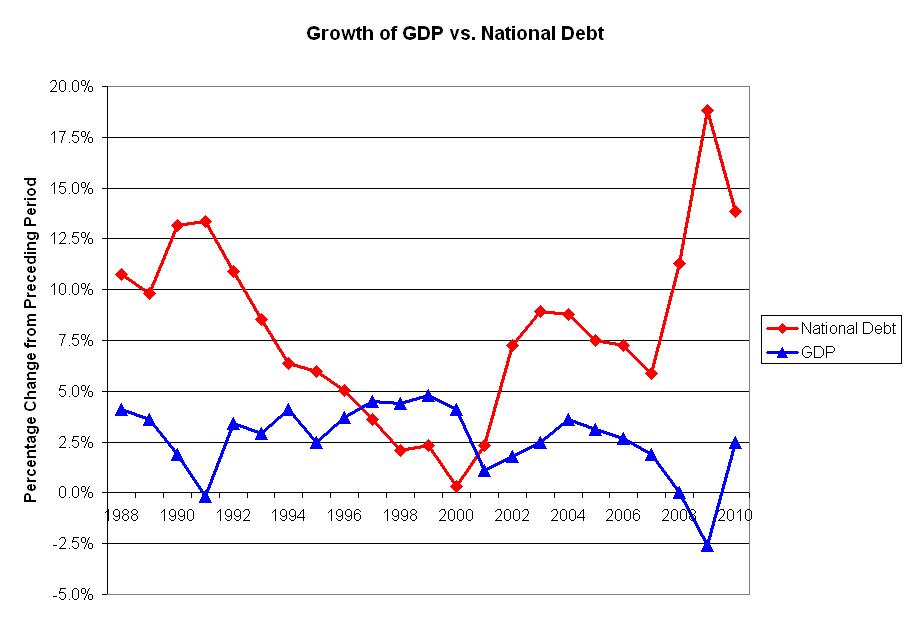
From 1992 to 2000, while national debt growth was declining year-over-year, GDP remained relatively stable with growth rates between 2.5% and 4.8%, something that’s not supposed to happen in leftist ideology. But, GDP growth only exceeded national debt growth for four short years (1997-2000), and then came more borrowing.
In 2002, the national debt shot up by 7.2%, and GDP growth was an anemic 1.8%. The largest deviations were in 1991 and 2009. In 1991 while the national debt grew by 13.4%, GDP dropped by -0.2%. And again in 2009, the worst yet, as the national debt grew by 18.8%, GDP fell by -2.6%.
In 2010, although national debt growth slowed a bit from the previous year, it still grew by a whopping 13.9%, yet the increase to GDP was barely 2.5%. So far there doesn’t seem to be any proof to support the absurd leftist beliefs.
Now the diviners of the left seem to think that the key to robust economic growth is more borrowing. It’s as if they’re clueless. Here’s a question for you: How did that work out in 2009? The rationale du jour seems to be that since national debt growth slowed a bit in 2010 it should be quickly brought back up to 2009 levels. After all, increased government borrowing always leads to sound economic growth, right?
Wrong. In the real world, based on historical trends, economic growth probably will not follow, but the left will at least have been able to prove their point, whatever that is. My bet is that as government borrowing rises in 2011, GDP will head south again.

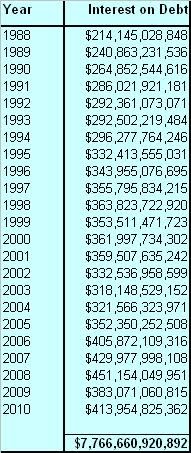
Meanwhile, how about those interest payments? Woo hoo! The government has gone from paying interest on the debt of $214 billion per year in 1988, to $414 billion in 2010.
Good thing interest rates are only around 3.007%. I mean with all the excess debt Congress has been piling on, it will probably be ‘game over’ when interest rates double to 6%, but I guess that will be the price of stupidity.
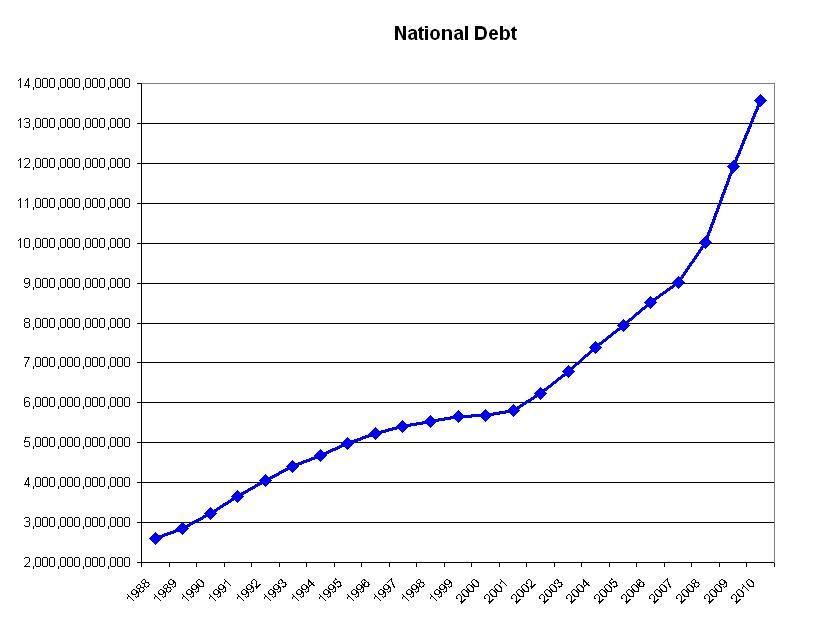
And, the debt grows on and on. Too bad we can’t invest in a national debt index fund. We could be making a killing.
If GDP and national debt growth rates in the first chart were reversed, we would be on the right track, but unfortunately, Washington D.C. is on the wrong track. I don’t see any evidence of a correlation between government borrowing and economic growth. Sorry government guys, but real GDP has failed to grow above the 5% level in the last 23 years in spite of over $11.2 trillion of government borrowing.
And, how much did all of this borrowing cost? Well, over the past 23 years the government has paid $7.8 trillion in interest payments.
I’m still waiting on that 100% return that Nancy Pelosi promised on her last unemployment extension, you know, the one that was supposed to be the ‘biggest bang for the buck’ and all. And, with all this new proposed spending I’m sure that unemployment probably won’t go above 11.0%, but nobody’s making that promise.
‘Maybe this time, it will be different’. Yeah, well either keep hoping, or jump ship. I recommend the latter. If there were any correlation at all between government borrowing and economic growth, it would probably be that the less the government borrows the better off the economy, but there doesn’t appear to be any positive correlation.
* Note – GDP is expressed as Real GDP from BEA Table 1.1.1
Data Sources: Bureau of Economic Analysis ; Treasury Direct

Without falling into the trap of esoteric hair-splitting technicalities, almost all research reveals that national debt and the federal deficit grew the most under Republican administrations (current administration excluded).
LikeLike
That's fine as long as you split the hairs correctly. I have done my own research on this topic. “In the United States, the total debt outstanding as of September 30, 2010, stood at $13,561,623,030,891.70. It’s interesting to note that over the past 40 years, 69.1% of this debt is attributable to Democrat led congresses, and only 28.1% to Republicans.” See: National Debt: a National Disgrace
U.S. Constitution – Article 1 Section 7: “All bills for raising Revenue shall originate in the House of Representatives; but the Senate may propose or concur with Amendments as on other Bills.”
LikeLike
Pingback: Budgeting 201: An Immediate Debt Crisis | Black and Center
Pingback: Budgeting 101: A Balanced Approach | Black and Center