Obamacare’s Deadweight Loss

Why you should repeal it right away!

By: Larry Walker, Jr.-

“The most important single central fact about a free market is that no exchange takes place unless both parties benefit.” ~Milton Friedman –

Failure to repeal Obamacare by January of 2013 will result in deadweight losses in the American economy. Although static revenue believers contend that the federal government will be able to line its pockets through a new source of revenue, inefficiency will occur in the private sector causing the loss of existing and future jobs, a decline in income tax revenues, less private sector health insurance coverage, and fewer business expansions. In fact, many small businesses will be left with lower revenues, after paying the so called shared responsibility penalty, causing them to either price themselves out of the market, downsize, or shutter, depending on market conditions.

What is Deadweight Loss? – It’s an economic term which represents the costs to society created by market inefficiency. Deadweight loss can be applied to any deficiency caused by an inefficient allocation of resources. Price ceilings (such as price controls and rent controls), price floors (such as minimum wage and living wage laws) and taxation are all said to create deadweight losses. Deadweight loss occurs when supply and demand are not in equilibrium. To see how deadweight loss occurs with Obamacare, let’s use an expanded real world example.

TEA, Inc. is a small Georgia based parts assembly plant with 50 full-time employees, not including its single owner. The company doesn’t provide health insurance for its employees due to a low profit margin, as doing so would impair its ability to continue as a going concern. However, the owner wants to expand in order to increase profits through horizontal integration. The company’s pre-tax net profit is projected to be $150,000 for each plant it operates, and each plant is expected to employ 50 full-time employees. Prior to the passage of Obamacare, TEA Inc.’s owner had planned on opening a second plant in 2012 and a third in 2013 creating an additional 100 jobs, but this misguided legislation has pretty much killed that dream. How’s that?

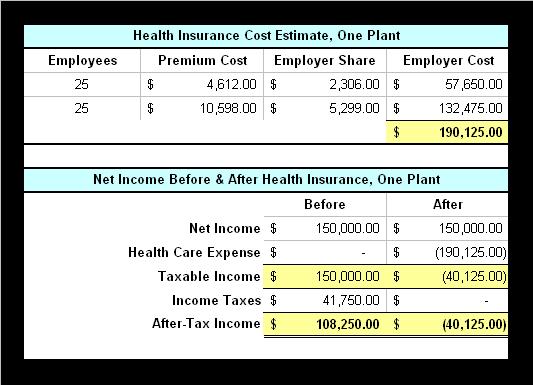
Well, since TEA, Inc. already has 50 full-time employees, it will be required by Obamacare to either provide and pay for at least half the cost of health insurance for its employees in 2014, or pay a penalty of $2,000 on each (excluding the first 30). In analyzing the financial impact, TEA, Inc. determines that 25 of its employees will require family plans, and 25 will require self-only plans. TEA, Inc. expects the ratio of family versus self-only plans to remain about the same as it expands. In examining the average cost of small group premiums within the Georgia market, it is known that self-only plans cost an average of $4,612, and family plans cost $10,598 (see Obamacare’s Effect on Small Business).

Single Plant Option

Prior to Obamacare, with its one existing plant, TEA, Inc. would have net income of $150,000, would pay federal income taxes of $41,750, and would be left with after-tax income of $108,250 (see table below). Assuming all things are equal, by 2014 when TEA, Inc. is mandated to provide health insurance at its existing plant, its health care expense will be $190,125 leaving it with a $(40,125) net operating loss, and no federal income tax liability. Since this is out of the question TEA, Inc. will be forced to either reduce its number of full-time employees to below 50, or pay a shared responsibility penalty (i.e. Health Care Tax).

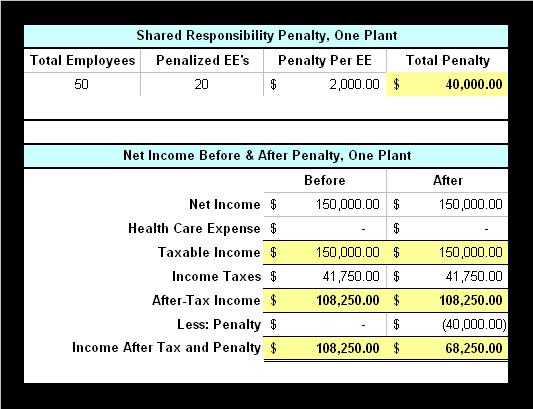
Since TEA, Inc. cannot afford to comply with the play portion of the “play or pay rules”, if it does not reduce its workforce before 01/01/2013, then by 2014 it will be forced to pay a shared responsibility penalty of $40,000 ($2,000 per person on 20 of its 50 employees). Since the shared responsibility penalty is not deductible for tax purposes, TEA, Inc. will still have taxable income of $150,000, will pay federal income taxes of $41,750, and will have after-tax income of $108,250. However, after paying the shared responsibility penalty, the company will be left with just $68,250 or $40,000 less than it would have had before Obamacare (see table below). What will TEA, Inc. do? Its owner only has 14 months to decide, because the penalty will apply in 2014 if TEA, Inc. still has 50 or more full-time employees in the year 2013 (see Obamacare’s Effect on Small Business).

Options: If TEA, Inc. reduces its current workforce by one full-time equivalent employee, it can avoid paying the $40,000 penalty in 2014, but it must eliminate that position before the end of 2012, due to the twelve month look-back rule contained in Obamacare’s fine print. By doing so, TEA, Inc. will save the amount of one employee’s wages, less the increase in applicable federal taxes, and will avoid paying the $40,000 shared responsibility penalty, making the company better off. Unfortunately, this might be the best option available under the circumstances. So far, the deadweight loss is one full-time job.

Two Plant Option

If TEA, Inc. opts to push ahead and open the second plant, prior to Obamacare it would have net income of $300,000, would pay federal income taxes of $100,250, and would be left with after-tax income of $199,750. Assuming all things are equal, in 2014 when TEA, Inc. is mandated to provide health insurance at its old and new plant, its health care expense will be $380,250 leaving it with a net operating loss of $(80,250), and no federal income tax liability (see table below). Since this is out of the question TEA, Inc. will be forced to either forgo its expansion plans and not provide the additional 50 jobs, or pay the shared responsibility penalty (i.e. Health Care Tax).

Since TEA, Inc. cannot afford to comply with the play part of the “play or pay rules”, if it proceeds with the expansion, then by 2014 it will be forced to pay a shared responsibility penalty of $140,000 ($2,000 per person on 70 of its 100 employees). Since the shared responsibility penalty is not deductible for tax purposes, TEA, Inc. will still have taxable income of $300,000, will pay federal income taxes of $100,250, and will have after-tax income of $199,750. However, after paying the penalty, the company will be left with just $59,750 or $140,000 less than it would have had before Obamacare (see table below).

It’s worth noting that even after doubling its profits, TEA, Inc. would be left with less money — $59,750, than it would have had with just the one plant — $68,250. Again, what will TEA, Inc. do? Its owner only has 14 months to decide, because the penalty will apply in 2014 if TEA, Inc. has 50 or more full-time employees in the year 2013 (see Obamacare’s Effect on Small Business). The best option appears to be to not open the second plant, and to reduce the number of full-time employees at the initial plant by one. Thus, the deadweight loss has increased to 51 full-time jobs.

Three Plant Option

If TEA, Inc. decides to trust in “hope and change” and moves ahead with adding yet a third plant, pre-Obamacare it would have net income of $450,000, would pay federal income taxes of $153,000, and would be left with after-tax income of $297,000 (see table below). Assuming all things are equal, in 2014 as TEA, Inc. is mandated to provide health insurance at all three plants, its health care expense will be $570,375 leaving it with a $(120,375) net operating loss, and no federal income tax liability. Since this is impossible, TEA, Inc. will be forced to either forgo its expansion plans and not provide the additional 100 jobs, or pay the shared responsibility penalty (i.e. Health Care Tax).

Since TEA, Inc. cannot afford to comply with the play aspect of the “play or pay rules”, if it proceeds with its expansion plans, then by 2014 it will be forced to pay a shared responsibility penalty of $240,000 ($2,000 per person on 120 of its 150 employees). Since the shared responsibility penalty is not deductible for tax purposes, TEA, Inc. will still have taxable income of $450,000, will pay income taxes of $153,000, and will have after-tax income of $297,000. However, after paying the shared responsibility penalty, the company will be left with just $57,000 (see table below).

It’s notable that even after tripling in size, TEA, Inc. would be left with less money –- $57,000, than it would have had with just two plants –- $59,750, and even less than it would have had with just the one plant –- $68,250. Again, what will TEA, Inc. do? Its owner only has 14 months to decide, because the penalty will apply in 2014 if TEA, Inc. has 50 or more full-time employees in the year 2013 (see Obamacare’s Effect on Small Business).

The best option for TEA, Inc. appears to be to forget about opening a second and third plant, and to reduce the number of employees at its existing plant. By doing so, TEA, Inc. will be able to maintain its present after-tax net income of $108,250, plus the savings achieved by eliminating a job, which yields the optimal result. Thus, in this real-life scenario, the deadweight loss created by Obamacare is 101 full-time jobs. In addition, 49 full-time employees are left without health insurance, and by 2014 will be forced to either pay a tax or secure their own health insurance coverage. Failure to repeal Obamacare means that this entrepreneur’s dreams of expansion will be destroyed, and 101 potential employees will be left on the sidelines. Obamacare will impose unnecessary deadweight losses upon the American economy, which will be multiplied many times over.

Forcing the free-market to accept and live with market inefficiency just doesn’t work out so well in a free market society. Any so called Jobs Bill which doesn’t immediately repeal this irresponsibly enacted, job killing, legislation isn’t a jobs bill at all. In my humble opinion, the Patient Protection and Affordable Care Act (PPACA) should be repealed right away. You should repeal it, right now! Be sure to sign the White House Petition to Repeal Obamacare. You must sign by 10/22/11. “Live free or die.”

The Folly of Government Investment

It's Back on the Road

Car’s Out of the Ditch; What’s Left of It Anyway!

– By: Larry Walker, Jr. –

Realistically, it doesn’t look like anyone’s going to be driving this car ever again, so the highway that it’s on is irrelevant. And as far as what they’re sipping on, why that would be Kool-Aid. It looks like we’re going to need a new car, or perhaps just a new President, one who knows something about restoration. What in the heck is a government investment? I mean has anybody ever attempted to figure out what kind of return the government is getting on its current “investments”? I find it rather alarming when I compare the nominal rates of change in GDP, Unemployment, and the Public Debt during the recessions of 2001 and 2008.

click to enlarge

click to enlarge

For example, we see that in 2001, while the number of unemployed Americans increased by 46.6%, GDP was still growing, and the Public Debt was still shrinking. Then in 2002, the second year after the recession, the number of unemployed only grew by another 4.6%, with a modest increase in the Public Debt of 6.4%. And in 2003, the third year post-recession, the Public Debt increased by 10.4%, while the number of unemployed dropped by -3.7%. Unemployment continued to decline in each subsequent year until the beginning stages of the financial crisis appeared, near the end of 2007. In 2007 the number of unemployed Americans rose by 13.4% with modest changes in both the Public Debt and GDP. Following is the question of the day from @danlothiancnn, and then we’ll compare the periods of 2001 through 2003, with 2008 through 2010.

Year 1: The Recession of 2001 vs. 2008

The following statistics are drawn from the table and chart above. We are comparing nominal figures of the number of unemployed, gross domestic product, and the public debt. The percentages shown represent the rate of change from one year to the next.

  • In 2001, the increase in the number of unemployed was 46.6%, or nearly the same as the 48.1% increase in 2008.

  • In 2001, GDP growth was positive at 3.4%, versus an increase of just 2.2% in 2008.

  • The biggest difference was that the public debt decreased by -1.9% in 2001, versus an increase of 15.0% in 2008.

Year 2: Post-Recession 2002 vs. 2009

Moving into the year after the recession began, we notice a huge difference in the number of unemployed.

  • In 2002, the number of unemployed increased by just 4.6%, while in 2009 the increase was a whopping 33.9%.

  • You will also note that GDP increased by 3.5% in 2002, versus a decline of -1.7% in 2009.

  • Next, you will note that while the public debt increased by just 6.4% in 2002, the increase in 2009 was an astronomical 30.0%. What this indicates is that the government overacted in 2009 by implementing a barrage of stimulus, regulations, and bailouts which did little more than increase unemployment and slow economic growth.

Year 3: Post-Recession 2003 vs. 2010

Now let’s look at the 3rd year after the beginning of each recession.

  • In 2003 the number of unemployed declined by -3.7%, versus a decline of just -1.0% in 2010.

  • GDP grew by 4.7% in 2003, versus an increase of 4.4% in 2010.

  • Meanwhile, the public debt grew by 10.4% in 2003, versus an increase of 19.5% in 2010.

Summary

To summarize, the percentage changes over each three-year period were as follows:

  1. GDP was elevated by 12.0% in 2001-2003, while increasing by just 4.9% in 2008-2010.

  2. The Public Debt grew by 15.2% in 2001-2003, versus an escalation of 78.7% in 2008-2010.

  3. The number of the unemployed increased by 47.6% in 2001-2003, compared to mushrooming by 96.5% in 2008-2010.

Conclusion

There is no such thing as government investment. In spite of the government’s colossal spending campaign, which over the past three years has increased the public debt by 78.7%, in the end, the number of unemployed Americans expanded by an absurd 96.5%, and gross domestic product grew by just 4.9% (the same that was achieved in the single year of 2007). So it looks like the federal government’s return on investment over the past three years has been negative. All we got out of the deal was a ballooning of the public debt by 78.7%, and a gargantuan uptick of 96.5% in the number of unemployed Americans. So much for that theory. Government investment amounts to nothing more than meaningless rhetoric.

Perhaps it’s time for the government to get in the back seat; what’s left of it anyway. (1) Stop spending money that you don’t have, under the guise of making “investments”. (2) While you’re at it, you can stop playing God; enough with over-regulation. (3) And further, you guys can stop patting yourselves on the backs, because so far you have achieved nothing (nada). The car wasn’t in that bad a shape when Obama took the keys. The policies which Obama, Pelosi, and Reid implemented in 2009 are directly responsible for expanding both the number of unemployed, and the amount of public debt. Now that the car has been totalled, good luck with the C.Y.A. campaign.

Photo Credit: http://stock-free.com

GDP: Bureau of Economic Analysis

Unemployment: Table 1-A, Bureau of Labor Statistics

Public Debt: Treasury Direct – Debt to The Penny

Tax Rates, Earmarks, and Weiners

Money to Burn

Put Up, or Shut Up!

– By: Larry Walker, Jr. –

Okay, it’s time for all you rich whiners (a.k.a. Anthony Weiner) and cry babies to man up. For those who think that a top federal tax rate of 35% is too low, there is a solution. How about forking over some of that excess lucre? How about putting your money where your mouth is? The time to stand up for your convictions has come. It’s time to make a voluntary donation towards the national debt.

If you meet all of the following criteria, then I’m talking to you:

  1. You don’t like the tax rate extension.
  2. You are overcome with guilt, and want to pay more taxes.
  3. You are a congressman, senator, federal employee, millionaire or billionaire.
  4. You don’t have a business or payroll to meet, and have money to burn.

If this is you, then it’s time to step up. You can make a voluntary gift to the Bureau of the Public Debt, earmarked towards the national debt. That’s the only kind of earmark that we find acceptable. And the best part is that your donation is fully tax deductible. That’s right! You won’t have to pay taxes on any income you voluntarily contribute towards the national debt, not one dime. So what are you waiting for?

Only $2.8 million was donated in the last fiscal year. That’s pathetic. Let’s get that up in the hundreds of millions, or billions. Harry Reid and Nancy Pelosi should be the first to write checks, since they’re the ones who blew a $5 trillion hole in deficit. Where’s Warren Buffet? What about Anthony Weiner? What’s up with Bill Clinton? Is there an Obama in the house? It’s time to put up, or shut up. All those who love to talk trash, while advocating the squander of other people’s money, need to be the first in line. It’s time to trifle some of your own. Otherwise shut the hell up.

How do you make a contribution to reduce the debt?

There are two ways for you to make a contribution to reduce the debt:

  • You can make a contribution online either by credit card, checking or savings account at Pay.gov
  • You can write a check payable to the Bureau of the Public Debt, and in the memo section, notate that it’s a Gift to reduce the Debt Held by the Public. Mail your check to:

    Attn Dept G
    Bureau of the Public Debt
    P. O. Box 2188
    Parkersburg, WV 26106-2188

We will be following up in a couple of months to see how well you did.

Disclosure: 1. Before making a donation to the federal government or any other organization, be sure to review how it spends its money. 2. Voluntarily contributing to the same government that taxes you, may negate any (or all) potential tax savings. 3. Sorry, but I will not be joining you, as I do not fit the criteria.

Links: Treasury Direct ; Forbes Billionaire List

Uncorrelated: GDP and National Debt

Flatlined

Charting Insanity

– By: Larry Walker, Jr. –

Sorry but I can’t seem to find the extreme left-wing’s touted correlation between government borrowing and economic growth. They say things like: “We have to spend more to keep from going broke,” and, “For every dollar spent on unemployment and food stamps, $2.00 is put back into the economy.” But such statements don’t appear to have any rational basis, and as we shall see, no basis in fact.

For example, in 1988 while the national debt increased by 10.7% over the preceding year, real GDP* increased by just 4.1%, and then when the national debt shot up by 13.2% in 1990, real GDP merely increased by 1.9%. It looks to me like the more the government borrows, the worse the economy performs, but maybe it’s just me.

click to enlarge

From 1992 to 2000, while national debt growth was declining year-over-year, GDP remained relatively stable with growth rates between 2.5% and 4.8%, something that’s not supposed to happen in leftist ideology. But, GDP growth only exceeded national debt growth for four short years (1997-2000), and then came more borrowing.

In 2002, the national debt shot up by 7.2%, and GDP growth was an anemic 1.8%. The largest deviations were in 1991 and 2009. In 1991 while the national debt grew by 13.4%, GDP dropped by -0.2%. And again in 2009, the worst yet, as the national debt grew by 18.8%, GDP fell by -2.6%.

In 2010, although national debt growth slowed a bit from the previous year, it still grew by a whopping 13.9%, yet the increase to GDP was barely 2.5%. So far there doesn’t seem to be any proof to support the absurd leftist beliefs.

Now the diviners of the left seem to think that the key to robust economic growth is more borrowing. It’s as if they’re clueless. Here’s a question for you: How did that work out in 2009? The rationale du jour seems to be that since national debt growth slowed a bit in 2010 it should be quickly brought back up to 2009 levels. After all, increased government borrowing always leads to sound economic growth, right?

Wrong. In the real world, based on historical trends, economic growth probably will not follow, but the left will at least have been able to prove their point, whatever that is. My bet is that as government borrowing rises in 2011, GDP will head south again.

click to enlarge

Meanwhile, how about those interest payments? Woo hoo! The government has gone from paying interest on the debt of $214 billion per year in 1988, to $414 billion in 2010.

Good thing interest rates are only around 3.007%. I mean with all the excess debt Congress has been piling on, it will probably be ‘game over’ when interest rates double to 6%, but I guess that will be the price of stupidity.

click to enlarge

And, the debt grows on and on. Too bad we can’t invest in a national debt index fund. We could be making a killing.

If GDP and national debt growth rates in the first chart were reversed, we would be on the right track, but unfortunately, Washington D.C. is on the wrong track. I don’t see any evidence of a correlation between government borrowing and economic growth. Sorry government guys, but real GDP has failed to grow above the 5% level in the last 23 years in spite of over $11.2 trillion of government borrowing.

And, how much did all of this borrowing cost? Well, over the past 23 years the government has paid $7.8 trillion in interest payments.

I’m still waiting on that 100% return that Nancy Pelosi promised on her last unemployment extension, you know, the one that was supposed to be the ‘biggest bang for the buck’ and all. And, with all this new proposed spending I’m sure that unemployment probably won’t go above 11.0%, but nobody’s making that promise.

‘Maybe this time, it will be different’. Yeah, well either keep hoping, or jump ship. I recommend the latter. If there were any correlation at all between government borrowing and economic growth, it would probably be that the less the government borrows the better off the economy, but there doesn’t appear to be any positive correlation.

* Note – GDP is expressed as Real GDP from BEA Table 1.1.1

Data Sources: Bureau of Economic Analysis ; Treasury Direct

The Pelosi Effect: Fatally Flawed

Highway Robbery?

Rational Expectations and Two-Bit Liars

– by: Larry Walker, Jr. –

It is impossible to calculate the effect of deficit-financed government spending on demand without specifying how people expect the deficit to be paid off in the future. ~ The Theory of Rational Expectations

In Rational Expectations and Irrational Intentions, we attempted to show the cost of a deficit-financed $1 over time, as a rebuttal to Nancy Pelosi’s flawed analysis. There we used an interest rate of just 4%. But what if interest rates were to suddenly rise to 8%, something which is within the realm of reasonable possibilities? Well, as you can see below, when interest rates rise to 8%, the Pelosi Effect completely disintegrates. You see, while Ms. Pelosi has merely provided the benefit side of what should be a cost-benefit analysis, like-minded Americans are thinking about the cost.

Click to Enlarge

Well, with an interest rate of 8%, the benefit of Ms. Pelosi’s dollar disappears in just 7 to 9 years, when the cost, with financing, will then be between $1.71 and $2.00. In just 30 years the cost rises to $10.06. In 40 years the cost more than doubles to $21.72. In 50 years, it more than doubles again to $46.90. And at the end of 100 years, the cost to the treasury of just one additional deficit-financed dollar will be as much as $2,199.76. It’s highway robbery. It’s not even necessary to chart the next two centuries, as the nation will have been reduced to ashes in under 50 years. And moving forward, heaven forbid that interest rates should ever exceed 8%.

Excuse me, but when a politician, who is already personally responsible for adding over $5 trillion to the national debt in just four years, attempts to explain that borrowing just one more dollar (hundreds of billions more as is the case) will somehow add a benefit of $2 to the economy, and omits the most important part, the cost, she deserves to be swinging in the public square. Has the $5 trillion she has already flushed down the toilet returned two-fold as of yet? If so, then why hasn’t her debt been paid off, or why hasn’t our gross domestic product suddenly risen by $5 to $10 trillion? If not, then one can only conclude that this woman is a fraud, and should, at the very least, spend the rest of her days in a federal penitentiary. Nancy Pelosi is a fraud.

Photo Credit: Last public execution at Tyburn Gallows in London

Rational Expectations and Irrational Intentions

π is an irrational number

The Pelosi Effect Revisited

– by: Larry Walker, Jr. –

“It has been said that we judge others by their actions, but judge ourselves by our intentions.” ~ The Philippian Jailer

On October 6, 2010, Lame Duck Speaker of the House of Representatives, and Democrat, Nancy Pelosi said, “For every dollar a person receives in food stamps, $1.79 is put back into the economy. It is the biggest bang for the buck when you do food stamps and unemployment insurance. The biggest bang for the buck.” Now she’s boasting that for every dollar spent on unemployment and food stamps, $2.00 is put back into the economy. But as we pointed out in Rational Expectations vs. Obamanomics, “According to the theory of rational expectations, it is impossible to calculate the effect of deficit-financed government spending on demand without specifying how people expect the deficit to be paid off in the future.”

So okay let’s pretend that it’s true that every dollar the government spends on unemployment and food stamps magically doubles across the economy. There is just one major problem with the Pelosi Effect. Since the initial dollar was borrowed, and interest payments on the debt are effectively being borrowed as well, that same dollar will wind up costing the government $2.03 within 18 years, and may wind up costing in excess of $1,355,196.11 over time.

The cost of a deficit-financed dollar will double to $2.03 in about 18 years at an interest rate of 4.0%. Since we are not paying down the national debt, and are in effect borrowing further to make the interest payments, the cost will continue to rise over time. By the 29th year the cost of that dollar will be $3.12. By the 37th year it will have cost $4.27. By the 100th year the cost skyrockets to $50.50. And finally, by the 360th year that same dollar will have cost a total of $1,355,196.11, ad infinitum (see chart and table below).

You see, it is one thing for the government to spend a dollar from surplus, but entirely another when that buck has been deficit-financed. Thus, the effect that the proposed spend and spend package will have on demand will most certainly not be positive. It all points back to the importance of not spending what you don’t have (i.e. PAYGO). What happened to that theory? With the national debt currently at $13.8 trillion, and growing by $5 billion per day; how is it ever to be repaid when hundreds of billions more is recklessly piled on with every whim? Lady, please!

Apparently the word compromise means payoff rather than paygo. One can only imagine how much that elusive deficit reduction plan will cost [sarc]. Oh give me a break!

_______________________________

Note – The dollar never gets fully returned to the government, or to the recipient of benefits. In the near term, unemployment is partially taxable, but the most the government will get back in taxes is 10%. The recipient will only effectively be receiving 90 cents due to federal income taxes, and less when you factor in State taxes (in Georgia that would be 85 cents). So we’re back to around $1.70 (0.85 * 2) added to the economy rather than $2.00. Then once the recipient has spent the money it’s gone. Unless they are able to find a job within 13 months they will be knocking again, ad infinitum. First 99 weeks, then 56 more, and the debt grows on, and on, and on…….