We Are All Billionaires Now

Big Words Small Mind

Tax Breaks for Millionaires and Billionaires ~

“But we cannot afford $1 trillion worth of tax cuts for every millionaire and billionaire in our society.” ~ Barack Obama

~ By: Larry Walker, Jr. ~

The Class Warfare Instigator in Chief (CWIC) has been railing against wealth. People who have saved up for retirement, or who were fortunate enough to acquire assets which have appreciated substantially are not impressed. Anyone with half a brain knows that a millionaire (or billionaire) is an individual whose net worth is equal to or exceeds one million (or one billion) units of currency. Net worth refers to an individual’s net economic position. It is calculated by adding the value of all of ones assets minus the value of all of their liabilities. Being a millionaire or billionaire has nothing to do with an individual’s annual taxable income. So when politicians, such as Obama, speak of tax breaks for millionaires and billionaires, do they even know what they’re talking about?

In the United States of America, we don’t pay income taxes based on the value of our net worth. We pay income taxes based on the amount of income earned or produced annually. So where exactly are these so called tax breaks for millionaires and billionaires? I contend that they don’t exist, namely because as I just stated; individuals are not taxed based on their net worth.

At the last count, there were just 412 billionaires in the United States. So the next time Obama refers to “billionaires”, it would be more appropriate for him to refer to them as “the 412 billionaires”. When one studies the IRS’ Statistics of Income reports, the top 400 annual incomes reported on tax returns in 2007 averaged just under $138 million, far short of a billion. Word twisting politicians, namely Obama, would have us believe that there are people making billions of dollars per year, but that’s simply not true. In reality, only 400 households were fortunate enough to report average annual incomes of around $138 million. And as stated, only 412 Americans have a net worth of over a billion dollars. According to the Spectrum Group there were 7.8 million millionaires in the United States in 2009. However, according to a Taylor Nelson Sofres report, half of all millionaire households in the US are headed by retirees.

Good luck to Democrats in first identifying tax breaks that benefit people with net worth’s of over $1 million (or $1 billion). They don’t exist. And secondly, since more than half of millionaire households are headed by retirees, most likely the only taxable income they receive is from pensions and investment income (a healthy chunk of that being tax-exempt). So does Obama want to raise taxes on grandpa? You mean to say that when people work hard all their lives and save up more than a million dollars for retirement, now that they have become millionaires they are evil and deserve to pay higher taxes? Get out of town, literally.

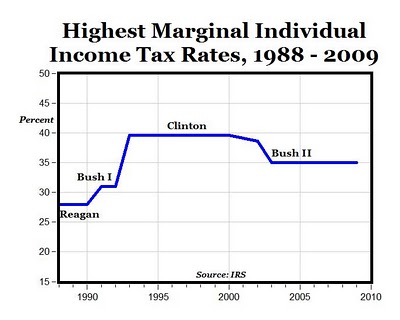
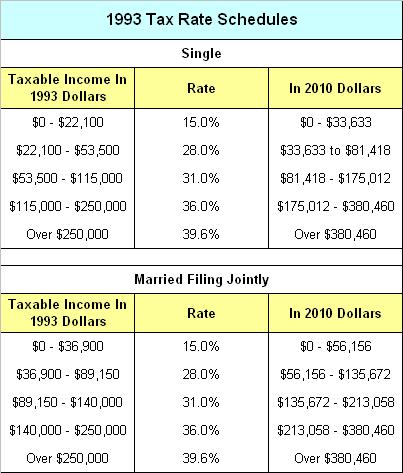
So is Obama talking about increasing taxes on investment income? Is he talking about doing away with tax-exempt interest? Does he want to get rid of the favorable capital gains rates? Does he intend to impose a tax based on unearned income (the amount of equity a citizen has in assets on a given date)? Or is he talking about re-imposing confiscatory death taxes? Say what you mean, and mean what you say, otherwise shut the hell up. It’s time to stop inciting envy, strife and class-warfare. On the other hand, if all Obama is trying to say, and rather poorly, is that he wants to lower the top tax bracket down to $250,000 and raise marginal tax rates to 39.6% above that amount (i.e. return to the 1993 tax rate schedules), then he should just continue to say that like a broken record until his demise.

I think I understand what Obama is really saying. What he’s saying to me is that since $250,000 is to $1 billion as $25,000 is to $100 million, if you make $25,000 per year, you’re a billionaire. Got it? That seems to be how Obama, sleepy Joe, and the 143 Democrats in Congress see it. With 535 members of Congress, and only 143 of them Democrats, how are they controlling this conversation anyway? After all, there are 311,174,158 citizens, only 412 billionaires, 7.8 million millionaires, and a mere 145 delusional Democrats in DC. Perhaps one of these 145 simpletons can list for the public all of the alleged tax breaks for millionaires and billionaires. I will attempt to identify a few of them presently.

Alternative Minimum Tax (reference)

The Alternative Minimum Tax attempts to ensure that anyone who benefits from certain tax advantages pays at least a minimum amount of tax. The AMT provides an alternative set of rules for calculating your income tax. In general, these rules should determine the minimum amount of tax that someone with your income should be required to pay. If your regular tax falls below this minimum, you have to make up the difference by paying alternative minimum tax.

Tax laws provide tax benefits for certain kinds of income and allow special deductions and credits for certain expenses. These benefits can drastically reduce some taxpayers’ tax obligations. Congress created the AMT in 1969, targeting higher-income taxpayers who could claim so many deductions they owed little or no income tax. Because the AMT is not indexed for inflation, a growing number of middle-income taxpayers are discovering they are subject to the AMT.

You may have to pay the AMT if your taxable income for regular tax purposes plus any adjustments and preference items that apply to you are more than the AMT exemption amount.

The AMT exemption amounts are set by law for each filing status. For tax year 2010, Congress raised the AMT exemption amounts to the following levels:

  • $72,450 for a married couple filing a joint return and qualifying widows and widowers;

  • $47,450 for singles and heads of household;

  • $36,225 for a married person filing separately.

  • The minimum AMT exemption amount for a child whose unearned income is taxed at the parents’ tax rate has increased to $6,700 for 2010.

Do the AMT exemption amounts (above) look like they’re targeting millionaires and billionaires to you? It doesn’t look that way to me. Not unless, like I said from the beginning, “we are all billionaires”. So just what kind of items can trigger the AMT? Here are a few.

Personal Exemptions – What? Believe it or not, personal exemptions contribute to AMT liability. The exemptions you claim for yourself, your spouse and your dependents are not allowed when calculating alternative minimum tax. It’s pretty rare (though not impossible) to see a tax return where someone had to pay AMT solely because of their exemptions, but the more exemptions you claim, the more likely it is that you’ll have AMT liability.

Standard Deduction – What? Some 70% of American taxpayers claim the standard deduction (rather than itemizing). The standard deduction isn’t allowed under the AMT. Usually this isn’t a problem because the AMT generally hits people with higher incomes, and these people are more likely to claim itemized deductions. Yet it’s worth noting that a deduction that’s so widely used can contribute to AMT liability.

State and Local Taxes – What? If you itemize, there’s a good chance you claim a deduction for state and local tax, including property tax, income tax and sales tax. These deductions are not allowed under the AMT. If you live in a place where state and local taxes are high, you’re more likely to be subject to the alternative minimum tax.

Interest on Second Mortgages – The AMT allows a deduction for interest on mortgage borrowings used to buy, build or improve your home. If you borrowed against your home for some other purpose, the interest deduction isn’t allowed under the alternative minimum tax.

Medical Expenses – The AMT allows a medical expense deduction, but it’s more limited than the deduction under the regular income tax. If you claim an itemized deduction for medical expenses, part or all of it will be disallowed when you calculate your alternative minimum tax.

Miscellaneous Itemized Deductions – Certain itemized deductions are available if your total deductions in this general category add up to more than 2% of your adjusted gross income. Among the items here are unreimbursed employee expenses, tax preparation fees and many investment expenses. You can’t deduct these items under the AMT, though. A large deduction in this category could lead you to pay alternative minimum tax.

Various Credits – Some of the credits that are allowed when you calculate your regular income tax aren’t allowed when you calculate your AMT. The more credits you claim, the more likely it is that you’ll end up paying alternative minimum tax. Fortunately, Congress has extended relief for the “personal credits” in recent years.

Well, the AMT certainly doesn’t constitute a tax break for millionaires and billionaires. Heck, we’ve barely breached the $75,000 mark if married ($50,000 if single) and most of the main tax breaks have already dissipated. Next!

Retirement Contributions Credit Limitation (reference)

You may be eligible for a tax credit if you make contributions to an employer-sponsored retirement plan or to an individual retirement arrangement. If you make eligible contributions to a qualified IRA, 401(k) and certain other retirement plans, you may be able to take a credit of up to $1,000 or up to $2,000 if filing jointly. The credit is a percentage of the qualifying contribution amount, with the highest rate for taxpayers with the least income. However, income limits apply to individuals with a filing status and income of the following amounts:

  • Single, married filing separately, or qualifying widow(er), with income up to $27,750

  • Head of Household with income up to $41,625

  • Married Filing Jointly, with incomes up to $55,500

So if you’re single and make more than $27,750 you can forget about this tax credit. It doesn’t appear that we’ve tapped into those elusive tax breaks for millionaires and billionaires yet. So let’s try again.

Earned Income Tax Credit Limitation (reference)

The Earned Income Tax Credit or the EITC is a refundable federal income tax credit for low to moderate income working individuals and families. Congress originally approved the tax credit legislation in 1975 in part to offset the burden of social security taxes and to provide an incentive to work. When EITC exceeds the amount of taxes owed, it results in a tax refund to those who claim and qualify for the credit.

Tax Year 2010 maximum credit:

  • $5,666 with three or more qualifying children

  • $5,036 with two qualifying children

  • $3,050 with one qualifying child

  • $457 with no qualifying children

Earned Income and adjusted gross income (AGI) must each be less than:

  • $43,352 ($48,362 married filing jointly) with three or more qualifying children

  • $40,363 ($45,373 married filing jointly) with two qualifying children

  • $35,535 ($40,545 married filing jointly) with one qualifying child

  • $13,460 ($18,470 married filing jointly) with no qualifying children

  • Investment income must be $3,100 or less for the year.

So much for tax breaks for millionaires and billionaires. There don’t appear to be many real breaks for folks making even $50,000 per year. Shall we try again?

Mortgage Interest Limitation (reference)

Interest deductions on home mortgages are limited. The law allows taxpayers to deduct interest on two categories of indebtedness secured by their residences. Acquisition indebtedness is used to acquire, construct, or substantially improve a residence, and cannot exceed $1,000,000. Home equity indebtedness is any debt other than acquisition indebtedness and cannot exceed $100,000.

So if you are lucky enough to be able to borrow more than $1 million on a mortgage, you cannot deduct any mortgage interest for the amount above $1 million. And if you have a home equity loan of more than $100,000, the amount of interest you can deduct is not allowed for the amount above $100,000. This doesn’t look like a tax break for millionaires and billionaires either. Surely there must be a humongous tax break for rich folks with children.

Child Tax Credit Limitation (reference)

The Child Tax Credit is for people who have a qualifying child under the age of 17. It is in addition to the earned income credit, if you even qualify for that. The maximum amount you can claim for the credit is $1,000 for each qualifying child. However, you must reduce your child tax credit if your modified adjusted gross income (AGI) is above the amount shown below for your filing status.

  • Married filing jointly – $110,000.

  • Single, head of household, or qualifying widow(er) – $75,000.

  • Married filing separately – $55,000.

So if you’re married with children and have income of more than $110,000, you don’t get the full $1,000 child tax credit. Oh well, this isn’t a tax break for so called millionaires and billionaires. Maybe if you borrow a ton of money to invest in a graduate degree you’ll get a huge tax break.

Student Loan Interest Limitation (reference)

You can claim up to $2,500 of student loan interest you paid as an above-the-line tax deduction on Form 1040. What? Does the government even have any idea that some people are paying upwards of $4,000 – $10,000 in student loan interest per year? And do they understand that an above-the-line tax deduction on $2,500 can at the most save an individual or couple 25-28% of the maximum amount? So if you’re married and pay $7,000 in student loan interest, you’ll receive a tax break amounting to between $250 and $700 depending on your tax bracket.

But if your income is too high, you won’t get any break at all. You can take this deduction only if your modified adjusted gross income (AGI) is less than: $75,000 if single, head of household, or qualifying widow(er); or $150,000 if married filing jointly. Oh well, we could go on and on, but so much for that theory.

Conclusion

No one pays income tax based on their net worth. We pay income taxes based on the amount of income we earn or produce each year. The simplistic act of raising the top marginal tax rate from 35% to 39.6%, and lowering the top tax bracket down to $250,000 won’t bring in an extra dime from millionaires and billionaires. Although it will take some money out of the pockets of small businesses, families and other hard working Americans, it will leave true millionaires and billionaires unscathed. There’s a dearth of tax breaks for anyone making more than $75,000 per year, and marginal tax rates are already way too high across the board, so Obama’s comments are simply absurd. Perhaps one of the other 144 Democratic Party simpletons in DC can list for us all of the alleged tax breaks for millionaires and billionaires. But until then, I’m going to have to ask you to muzzle it. Otherwise, prepare to give up your remaining 145 seats.

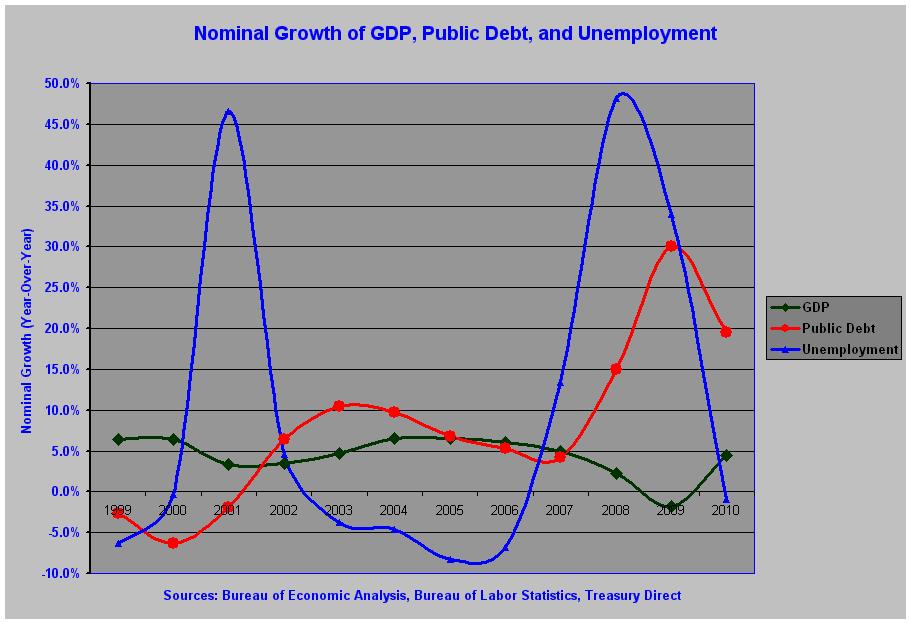
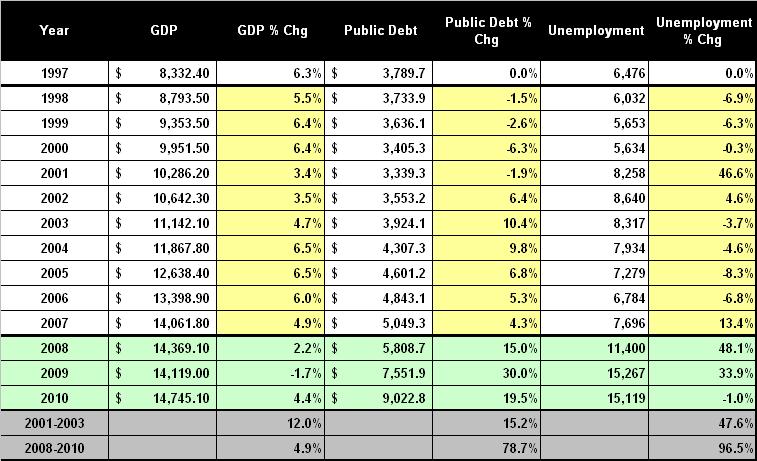
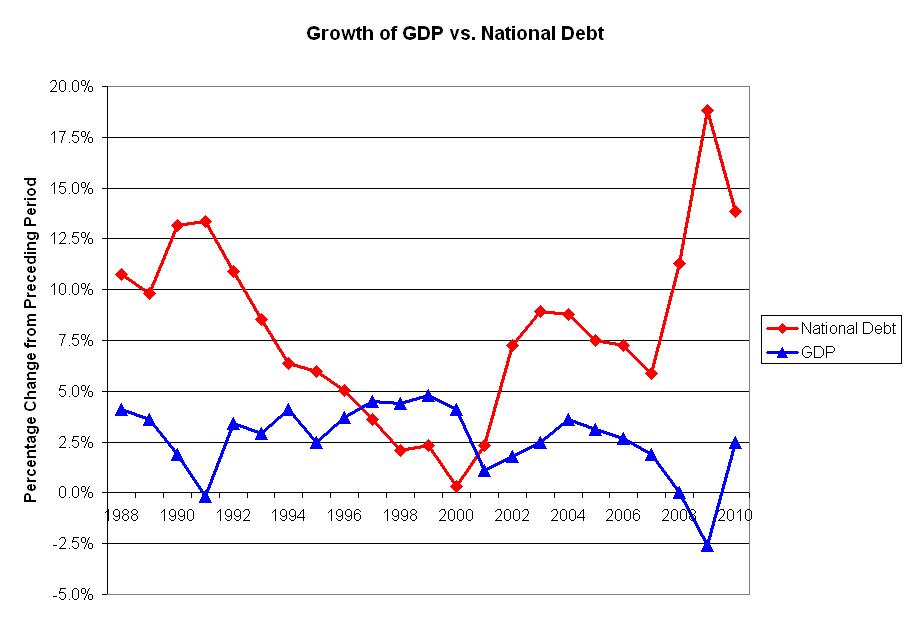
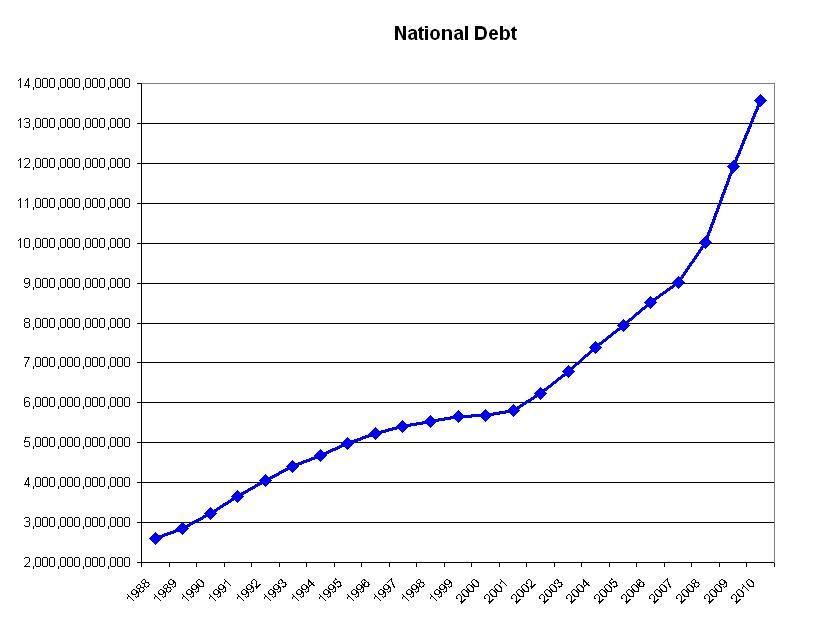
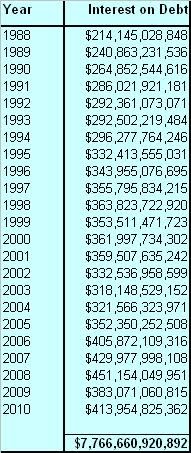
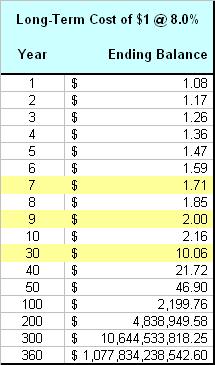
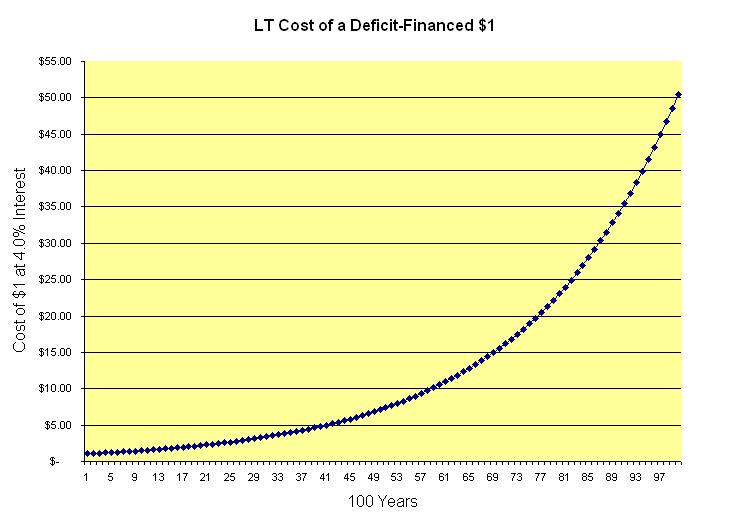
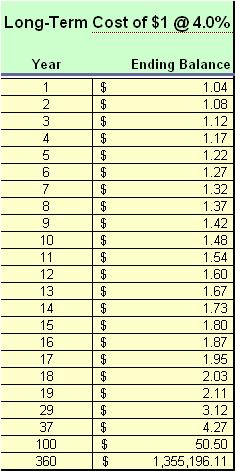
It’s not the 412 billionaires that worry me; it’s the federal government, $14 trillion in debt, with its hand in my pocket. That makes me queasy.

The Folly of Government Investment

It's Back on the Road

Car’s Out of the Ditch; What’s Left of It Anyway!

– By: Larry Walker, Jr. –

Realistically, it doesn’t look like anyone’s going to be driving this car ever again, so the highway that it’s on is irrelevant. And as far as what they’re sipping on, why that would be Kool-Aid. It looks like we’re going to need a new car, or perhaps just a new President, one who knows something about restoration. What in the heck is a government investment? I mean has anybody ever attempted to figure out what kind of return the government is getting on its current “investments”? I find it rather alarming when I compare the nominal rates of change in GDP, Unemployment, and the Public Debt during the recessions of 2001 and 2008.

click to enlarge

click to enlarge

For example, we see that in 2001, while the number of unemployed Americans increased by 46.6%, GDP was still growing, and the Public Debt was still shrinking. Then in 2002, the second year after the recession, the number of unemployed only grew by another 4.6%, with a modest increase in the Public Debt of 6.4%. And in 2003, the third year post-recession, the Public Debt increased by 10.4%, while the number of unemployed dropped by -3.7%. Unemployment continued to decline in each subsequent year until the beginning stages of the financial crisis appeared, near the end of 2007. In 2007 the number of unemployed Americans rose by 13.4% with modest changes in both the Public Debt and GDP. Following is the question of the day from @danlothiancnn, and then we’ll compare the periods of 2001 through 2003, with 2008 through 2010.

Year 1: The Recession of 2001 vs. 2008

The following statistics are drawn from the table and chart above. We are comparing nominal figures of the number of unemployed, gross domestic product, and the public debt. The percentages shown represent the rate of change from one year to the next.

  • In 2001, the increase in the number of unemployed was 46.6%, or nearly the same as the 48.1% increase in 2008.

  • In 2001, GDP growth was positive at 3.4%, versus an increase of just 2.2% in 2008.

  • The biggest difference was that the public debt decreased by -1.9% in 2001, versus an increase of 15.0% in 2008.

Year 2: Post-Recession 2002 vs. 2009

Moving into the year after the recession began, we notice a huge difference in the number of unemployed.

  • In 2002, the number of unemployed increased by just 4.6%, while in 2009 the increase was a whopping 33.9%.

  • You will also note that GDP increased by 3.5% in 2002, versus a decline of -1.7% in 2009.

  • Next, you will note that while the public debt increased by just 6.4% in 2002, the increase in 2009 was an astronomical 30.0%. What this indicates is that the government overacted in 2009 by implementing a barrage of stimulus, regulations, and bailouts which did little more than increase unemployment and slow economic growth.

Year 3: Post-Recession 2003 vs. 2010

Now let’s look at the 3rd year after the beginning of each recession.

  • In 2003 the number of unemployed declined by -3.7%, versus a decline of just -1.0% in 2010.

  • GDP grew by 4.7% in 2003, versus an increase of 4.4% in 2010.

  • Meanwhile, the public debt grew by 10.4% in 2003, versus an increase of 19.5% in 2010.

Summary

To summarize, the percentage changes over each three-year period were as follows:

  1. GDP was elevated by 12.0% in 2001-2003, while increasing by just 4.9% in 2008-2010.

  2. The Public Debt grew by 15.2% in 2001-2003, versus an escalation of 78.7% in 2008-2010.

  3. The number of the unemployed increased by 47.6% in 2001-2003, compared to mushrooming by 96.5% in 2008-2010.

Conclusion

There is no such thing as government investment. In spite of the government’s colossal spending campaign, which over the past three years has increased the public debt by 78.7%, in the end, the number of unemployed Americans expanded by an absurd 96.5%, and gross domestic product grew by just 4.9% (the same that was achieved in the single year of 2007). So it looks like the federal government’s return on investment over the past three years has been negative. All we got out of the deal was a ballooning of the public debt by 78.7%, and a gargantuan uptick of 96.5% in the number of unemployed Americans. So much for that theory. Government investment amounts to nothing more than meaningless rhetoric.

Perhaps it’s time for the government to get in the back seat; what’s left of it anyway. (1) Stop spending money that you don’t have, under the guise of making “investments”. (2) While you’re at it, you can stop playing God; enough with over-regulation. (3) And further, you guys can stop patting yourselves on the backs, because so far you have achieved nothing (nada). The car wasn’t in that bad a shape when Obama took the keys. The policies which Obama, Pelosi, and Reid implemented in 2009 are directly responsible for expanding both the number of unemployed, and the amount of public debt. Now that the car has been totalled, good luck with the C.Y.A. campaign.

Photo Credit: http://stock-free.com

GDP: Bureau of Economic Analysis

Unemployment: Table 1-A, Bureau of Labor Statistics

Public Debt: Treasury Direct – Debt to The Penny

Tax Rates, Earmarks, and Weiners

Money to Burn

Put Up, or Shut Up!

– By: Larry Walker, Jr. –

Okay, it’s time for all you rich whiners (a.k.a. Anthony Weiner) and cry babies to man up. For those who think that a top federal tax rate of 35% is too low, there is a solution. How about forking over some of that excess lucre? How about putting your money where your mouth is? The time to stand up for your convictions has come. It’s time to make a voluntary donation towards the national debt.

If you meet all of the following criteria, then I’m talking to you:

  1. You don’t like the tax rate extension.
  2. You are overcome with guilt, and want to pay more taxes.
  3. You are a congressman, senator, federal employee, millionaire or billionaire.
  4. You don’t have a business or payroll to meet, and have money to burn.

If this is you, then it’s time to step up. You can make a voluntary gift to the Bureau of the Public Debt, earmarked towards the national debt. That’s the only kind of earmark that we find acceptable. And the best part is that your donation is fully tax deductible. That’s right! You won’t have to pay taxes on any income you voluntarily contribute towards the national debt, not one dime. So what are you waiting for?

Only $2.8 million was donated in the last fiscal year. That’s pathetic. Let’s get that up in the hundreds of millions, or billions. Harry Reid and Nancy Pelosi should be the first to write checks, since they’re the ones who blew a $5 trillion hole in deficit. Where’s Warren Buffet? What about Anthony Weiner? What’s up with Bill Clinton? Is there an Obama in the house? It’s time to put up, or shut up. All those who love to talk trash, while advocating the squander of other people’s money, need to be the first in line. It’s time to trifle some of your own. Otherwise shut the hell up.

How do you make a contribution to reduce the debt?

There are two ways for you to make a contribution to reduce the debt:

  • You can make a contribution online either by credit card, checking or savings account at Pay.gov
  • You can write a check payable to the Bureau of the Public Debt, and in the memo section, notate that it’s a Gift to reduce the Debt Held by the Public. Mail your check to:

    Attn Dept G
    Bureau of the Public Debt
    P. O. Box 2188
    Parkersburg, WV 26106-2188

We will be following up in a couple of months to see how well you did.

Disclosure: 1. Before making a donation to the federal government or any other organization, be sure to review how it spends its money. 2. Voluntarily contributing to the same government that taxes you, may negate any (or all) potential tax savings. 3. Sorry, but I will not be joining you, as I do not fit the criteria.

Links: Treasury Direct ; Forbes Billionaire List

Uncorrelated: GDP and National Debt

Flatlined

Charting Insanity

– By: Larry Walker, Jr. –

Sorry but I can’t seem to find the extreme left-wing’s touted correlation between government borrowing and economic growth. They say things like: “We have to spend more to keep from going broke,” and, “For every dollar spent on unemployment and food stamps, $2.00 is put back into the economy.” But such statements don’t appear to have any rational basis, and as we shall see, no basis in fact.

For example, in 1988 while the national debt increased by 10.7% over the preceding year, real GDP* increased by just 4.1%, and then when the national debt shot up by 13.2% in 1990, real GDP merely increased by 1.9%. It looks to me like the more the government borrows, the worse the economy performs, but maybe it’s just me.

click to enlarge

From 1992 to 2000, while national debt growth was declining year-over-year, GDP remained relatively stable with growth rates between 2.5% and 4.8%, something that’s not supposed to happen in leftist ideology. But, GDP growth only exceeded national debt growth for four short years (1997-2000), and then came more borrowing.

In 2002, the national debt shot up by 7.2%, and GDP growth was an anemic 1.8%. The largest deviations were in 1991 and 2009. In 1991 while the national debt grew by 13.4%, GDP dropped by -0.2%. And again in 2009, the worst yet, as the national debt grew by 18.8%, GDP fell by -2.6%.

In 2010, although national debt growth slowed a bit from the previous year, it still grew by a whopping 13.9%, yet the increase to GDP was barely 2.5%. So far there doesn’t seem to be any proof to support the absurd leftist beliefs.

Now the diviners of the left seem to think that the key to robust economic growth is more borrowing. It’s as if they’re clueless. Here’s a question for you: How did that work out in 2009? The rationale du jour seems to be that since national debt growth slowed a bit in 2010 it should be quickly brought back up to 2009 levels. After all, increased government borrowing always leads to sound economic growth, right?

Wrong. In the real world, based on historical trends, economic growth probably will not follow, but the left will at least have been able to prove their point, whatever that is. My bet is that as government borrowing rises in 2011, GDP will head south again.

click to enlarge

Meanwhile, how about those interest payments? Woo hoo! The government has gone from paying interest on the debt of $214 billion per year in 1988, to $414 billion in 2010.

Good thing interest rates are only around 3.007%. I mean with all the excess debt Congress has been piling on, it will probably be ‘game over’ when interest rates double to 6%, but I guess that will be the price of stupidity.

click to enlarge

And, the debt grows on and on. Too bad we can’t invest in a national debt index fund. We could be making a killing.

If GDP and national debt growth rates in the first chart were reversed, we would be on the right track, but unfortunately, Washington D.C. is on the wrong track. I don’t see any evidence of a correlation between government borrowing and economic growth. Sorry government guys, but real GDP has failed to grow above the 5% level in the last 23 years in spite of over $11.2 trillion of government borrowing.

And, how much did all of this borrowing cost? Well, over the past 23 years the government has paid $7.8 trillion in interest payments.

I’m still waiting on that 100% return that Nancy Pelosi promised on her last unemployment extension, you know, the one that was supposed to be the ‘biggest bang for the buck’ and all. And, with all this new proposed spending I’m sure that unemployment probably won’t go above 11.0%, but nobody’s making that promise.

‘Maybe this time, it will be different’. Yeah, well either keep hoping, or jump ship. I recommend the latter. If there were any correlation at all between government borrowing and economic growth, it would probably be that the less the government borrows the better off the economy, but there doesn’t appear to be any positive correlation.

* Note – GDP is expressed as Real GDP from BEA Table 1.1.1

Data Sources: Bureau of Economic Analysis ; Treasury Direct

The Pelosi Effect: Fatally Flawed

Highway Robbery?

Rational Expectations and Two-Bit Liars

– by: Larry Walker, Jr. –

It is impossible to calculate the effect of deficit-financed government spending on demand without specifying how people expect the deficit to be paid off in the future. ~ The Theory of Rational Expectations

In Rational Expectations and Irrational Intentions, we attempted to show the cost of a deficit-financed $1 over time, as a rebuttal to Nancy Pelosi’s flawed analysis. There we used an interest rate of just 4%. But what if interest rates were to suddenly rise to 8%, something which is within the realm of reasonable possibilities? Well, as you can see below, when interest rates rise to 8%, the Pelosi Effect completely disintegrates. You see, while Ms. Pelosi has merely provided the benefit side of what should be a cost-benefit analysis, like-minded Americans are thinking about the cost.

Click to Enlarge

Well, with an interest rate of 8%, the benefit of Ms. Pelosi’s dollar disappears in just 7 to 9 years, when the cost, with financing, will then be between $1.71 and $2.00. In just 30 years the cost rises to $10.06. In 40 years the cost more than doubles to $21.72. In 50 years, it more than doubles again to $46.90. And at the end of 100 years, the cost to the treasury of just one additional deficit-financed dollar will be as much as $2,199.76. It’s highway robbery. It’s not even necessary to chart the next two centuries, as the nation will have been reduced to ashes in under 50 years. And moving forward, heaven forbid that interest rates should ever exceed 8%.

Excuse me, but when a politician, who is already personally responsible for adding over $5 trillion to the national debt in just four years, attempts to explain that borrowing just one more dollar (hundreds of billions more as is the case) will somehow add a benefit of $2 to the economy, and omits the most important part, the cost, she deserves to be swinging in the public square. Has the $5 trillion she has already flushed down the toilet returned two-fold as of yet? If so, then why hasn’t her debt been paid off, or why hasn’t our gross domestic product suddenly risen by $5 to $10 trillion? If not, then one can only conclude that this woman is a fraud, and should, at the very least, spend the rest of her days in a federal penitentiary. Nancy Pelosi is a fraud.

Photo Credit: Last public execution at Tyburn Gallows in London

Rational Expectations and Irrational Intentions

π is an irrational number

The Pelosi Effect Revisited

– by: Larry Walker, Jr. –

“It has been said that we judge others by their actions, but judge ourselves by our intentions.” ~ The Philippian Jailer

On October 6, 2010, Lame Duck Speaker of the House of Representatives, and Democrat, Nancy Pelosi said, “For every dollar a person receives in food stamps, $1.79 is put back into the economy. It is the biggest bang for the buck when you do food stamps and unemployment insurance. The biggest bang for the buck.” Now she’s boasting that for every dollar spent on unemployment and food stamps, $2.00 is put back into the economy. But as we pointed out in Rational Expectations vs. Obamanomics, “According to the theory of rational expectations, it is impossible to calculate the effect of deficit-financed government spending on demand without specifying how people expect the deficit to be paid off in the future.”

So okay let’s pretend that it’s true that every dollar the government spends on unemployment and food stamps magically doubles across the economy. There is just one major problem with the Pelosi Effect. Since the initial dollar was borrowed, and interest payments on the debt are effectively being borrowed as well, that same dollar will wind up costing the government $2.03 within 18 years, and may wind up costing in excess of $1,355,196.11 over time.

The cost of a deficit-financed dollar will double to $2.03 in about 18 years at an interest rate of 4.0%. Since we are not paying down the national debt, and are in effect borrowing further to make the interest payments, the cost will continue to rise over time. By the 29th year the cost of that dollar will be $3.12. By the 37th year it will have cost $4.27. By the 100th year the cost skyrockets to $50.50. And finally, by the 360th year that same dollar will have cost a total of $1,355,196.11, ad infinitum (see chart and table below).

You see, it is one thing for the government to spend a dollar from surplus, but entirely another when that buck has been deficit-financed. Thus, the effect that the proposed spend and spend package will have on demand will most certainly not be positive. It all points back to the importance of not spending what you don’t have (i.e. PAYGO). What happened to that theory? With the national debt currently at $13.8 trillion, and growing by $5 billion per day; how is it ever to be repaid when hundreds of billions more is recklessly piled on with every whim? Lady, please!

Apparently the word compromise means payoff rather than paygo. One can only imagine how much that elusive deficit reduction plan will cost [sarc]. Oh give me a break!

_______________________________

Note – The dollar never gets fully returned to the government, or to the recipient of benefits. In the near term, unemployment is partially taxable, but the most the government will get back in taxes is 10%. The recipient will only effectively be receiving 90 cents due to federal income taxes, and less when you factor in State taxes (in Georgia that would be 85 cents). So we’re back to around $1.70 (0.85 * 2) added to the economy rather than $2.00. Then once the recipient has spent the money it’s gone. Unless they are able to find a job within 13 months they will be knocking again, ad infinitum. First 99 weeks, then 56 more, and the debt grows on, and on, and on…….

Ill-Conceived Stimulus Threatens to Gum Up Recovery

Government Revenue Growth Surpasses Spending

– by: Larry Walker, Jr. –

Here we go again. At a time when government revenues are actually growing faster than spending, in step the clueless to gum it all up again. Sure, we still have a spending problem, but the cure is not more of the disease. Lawmakers always attempt to solve what they perceive to be a problem, well after self-correction has begun, and in all their ill-conceived efforts always manage to muck things up. In the present lame-duck session, all that the people asked is for tax rates to remain constant. That’s all we requested, and that’s all that’s needed at this moment in time. But instead, politicians are still playing around with the failed stimulus ideal, a policy which has never worked in American history. The truth is that with tax rates at present levels, revenues have already begun to surpass spending on a percentage basis. Government revenues have been growing faster than spending since the 2nd quarter of 2009.

The following chart, courtesy of the Bureau of Economic Analysis shows that government revenues are currently growing at a faster rate than spending (click to enlarge).

Government Spending and Revenues (% Change)

The chart below (click to enlarge) shows the discrepancy between revenues and spending in dollars. Clearly what’s needed is for spending to decline while revenues remain constant.

Government Spending and Revenues ($ Change)

In my piece entitled, “Untimely and Proven to Fail”, the myth behind government stimulus programs was clearly exposed. During the most recent recession, at the end of 2007, economists recommended stimulus spending as a means of averting a full blown recession. In order to work successfully, such a stimulus needed to be large enough; timely, targeted, and temporary. Although such a plan was implemented, by the time tax refunds began to reach taxpayers, in April of 2008, economists declared that it was too late, and that recession was then unavoidable. In February of 2009 a second stimulus was enacted, well after the recession had begun, and nearly at the time it was over. What was the point? The only purpose of an economic stimulus program, although one has never actually worked, is to avoid a recession. Once a recession has commenced, an entirely different set of policies is required.

What is called for in our present crisis is both a reduction in government spending, and stability in tax rates. Although reductions in income tax rates worked in the 1960’s, 1980’s and 2000’s, the present administration did not appear to actually want to improve the economy when it had the chance. Instead, progressives have been fixated on gumming things up in order to achieve what they claim are more noble goals. What lawmakers have proposed in lieu of a common sense compromise is more temporary stimulus. Where government errs is that businesses don’t respond to temporary policies. We are focused on the long-term. If we could see a coherent tax plan, one in which tax rates remain stable for some period and then eventually decline, there would be stability and growth. The Bush tax cuts were gradual in nature and, like Reagan’s plan, culminated in the lowest rates at the end, while the current administration is still playing around with temporary policies which lead to an uncertain end. Taxpayers can only suspect that in the end, we’ll all get screwed.

In an August 2004 article of the Journal of Political Economy, two UCLA economists said they figured out why the Great Depression dragged on for almost 15 years, and they blamed a suspect previously thought to be beyond reproach: President Franklin D. Roosevelt. After scrutinizing Roosevelt’s record for four years, Harold L. Cole and Lee E. Ohanian concluded that the New Deal policies signed into law 77 years ago thwarted economic recovery for seven long years. Ohanian and Cole blamed specific anti-competition and pro-labor measures that Roosevelt promoted and signed into law June 16, 1933.

“Why the Great Depression lasted so long has always been a great mystery, and because we never really knew the reason, we have always worried whether we would have another 10- to 15-year economic slump,” said Ohanian, vice chair of UCLA’s Department of Economics. “We found that a relapse isn’t likely unless lawmakers gum up a recovery with ill-conceived stimulus policies.”

“The fact that the Depression dragged on for years convinced generations of economists and policy-makers that capitalism could not be trusted to recover from depressions and that significant government intervention was required to achieve good outcomes,” Cole said. “Ironically, our work shows that the recovery would have been very rapid had the government not intervened.”

In conclusion, while policymakers should be focused on a plan which will reduce spending, and remove uncertainty, as the Fiscal Commission has already spelled out; instead what we are being served is another $700 to $900 billion stimulus program, this time three years after the fact. A lame-duck session is not a good time to consider a long-term strategy. All that we asked for was that tax rates remain stable until a solid plan may be implemented next year. We did not request another economic stimulus, but rather a stay, in order to remove the present cloud of unusual uncertainty. Will we ever have a government who gets it? I would rather see the current proposal fail and have tax rates rise for the first couple of weeks in 2011, than be herded into more bad policy by a bunch of incompetent lame ducks. Isn’t this why they lost in the first place?

The Elitist Condescension Tax Credit

Charge It

A.K.A. Making Work Pay Tax Credit (a.k.a. 2% Payroll Tax Holiday*)

– by: Larry Walker, Jr. –

Bundled in the 2009 economic stimulus plan was the $400 ($800 for couples) Making Work Pay tax credit which provided a tax credit in 2009 and 2010 equal to 6.2 percent of earned income of up to $6,450 for individual filers and $12,900 for couples. The tax credit took effect in July 2009. Workers who have taxes withheld from their paychecks have seen a decrease in the federal income taxes withheld from each paycheck by about $15 per paycheck every two weeks ($30 for couples). The credit phases out by two percent of any income over $150,000 for couples and $75,000 for others. Couples earning more than $190,000 and individuals earning more than $95,000 do not benefit from the credit.

Washington elitists seem to think that handing an American a $7.50 per week bonus ($15.00 for couples) out of their broke treasury will actually help somebody. Yeah, maybe in 1929, but $30 to $60 per month won’t even cover room and board in 2010. All it really amounts to is waste and abuse. It’s a waste of taxpayer resources as it helps no one, and abuse because all it really does is add to the national debt. This is just another fine example of how the crooks of D.C. have built themselves a monumental national debt of $13.8 trillion. Politicians should learn how to say the word “No”. Come on say it with me, “No”.

According to some estimates, if made permanent, the Making Work Pay tax credit will cost the U.S. government an estimated $640 billion through 2018. Any idiot who would vote for something that cost so much and helps no one should be targeted and fired in 2012. If Obama continues to push this, he’s one and done. Hopefully he will, because I will enjoy listening to another year of complaints from his former base.

*Addendum: What a disaster. The proposed 2.0% payroll tax cut will amount to about the same thing, a $15 per week pay increase for a $40,000 per year wage earner, or $27 per week for a family making $70,000, paid for by additional deficit financing. Did anyone get the memo entitled, “Stop Spending“? The package which includes extending the college tuition tax credit and other breaks for middle-class families that were due to expire on Dec. 31, would add more than $700 billion to the rising national debt, said congressional sources who were briefed on the package.

____________________________

“You cannot help the poor by destroying the rich…

You cannot strengthen the weak by weakening the strong…

You cannot bring about prosperity by discouraging thrift…

You cannot lift the wage earner up by pulling the wage payer down…

You cannot further the brotherhood of man by inciting class hatred…

You cannot build character and courage by taking away people’s initiative and independence…

You cannot help people permanently by doing for them, what they could and should do for themselves…”

~ Abraham Lincoln

___________________________

Tax Policy Center – Tax Stimulus Report Card

http://romans828pslm23.blogspot.com/2010/12/friends-e-mail.html?spref=tw

Shared Sacrifice and a Free Lunch

Veto This

A Taxpayer’s Lips to God’s Ear

– by: Larry Walker, Jr. –

Shared sacrifice? I’ll think about that the next time I’m forking over a check for $8,000 in income taxes, while the person in front of me is walking out with an $8,000 refund check. Nobody is willing to pitch in any further to help out an irresponsible bunch of crooks in Washington D.C. The truth is that 53% of us have already been pitching in, while 47% of Americans have not been paying any income taxes at all. It’s the 47% who don’t pay income taxes, the ones reaping all the misconstrued benefits, who need to pitch in.

According to the Tax Policy Center, in tax year 2009 there were 151,500,000 tax filers excluding dependents of other taxpayers and out of those 71,000,000 (46.9%) had a zero or negative income tax liability. Those are the ones who need to start sharing and sacrificing. “But how”, you say? “There’s nothing to cut”.

Cutting Waste, Fraud and Abuse

There’s always room for cutting waste, fraud, and abuse. For starters we can get rid of the following tax credits: Make Work Pay Credit, Economic Recovery Credit, Earned Income Tax Credit, Child Tax Credit, Hire Credit, and American Opportunity Credit. (And while we’re on the topic, no one asked for the first time home buyers credit, or cash for clunkers, so don’t get any new bright ideas.) No one really asked for any of this crap in the first place, it was all crammed down our throats by politicians thinking that they were helping us out by throwing away a little money that they didn’t have to begin with. And now they want us to pay more to cover their … tab? How irresponsible can you get? And what’s sick about it is that their real motivation was vote buying (probably with criminal intent).

My parents never got a child tax credit or an earned income tax credit. Neither did I. This stuff wasn’t around in the 60’s and 70’s, and though the EITC was around in my day, we always made too much to qualify. I always looked at these credits as a form of welfare anyway, and I have never taken welfare or food stamps. I slept in a homeless shelter for a week one time, but I never asked for anything from the government. I was on unemployment for two weeks one time, when I was laid-off by the federal government, and then quickly recalled, but I didn’t ask for a government handout. What I have asked for, and will continue to, is for the federal government to get its hand out of my pocket, to stop wasting my money, and to lower my tax rate. All I want is more of my own money, not someone else’s.

Mind Your Own Business

Politicians are quick to judge a private party’s income statement while ignoring their own. What they don’t realize is that there’s such a thing as a balance sheet. According to the government, corporate profits are up, and according to them ‘the bastards aren’t spending’. And so if they don’t spend, political crooks say, “We’ll take it, and spend it for them”. How unconstitutional of you. However, there are two forms of expenditures not included on an income statement of which financial illiterates have no knowledge. Corporate profits on an income statement don’t reflect the amount of money spent on principal repayments of debt, nor dividend payments, as these are not deductible as expenses. Politicians have no idea what obligations a private party may have.

They treat individuals in the same manner. For example, the federal government has no idea how much debt an individual has, or whether they have other obligations, such as child support payments. Let’s consider the issue of child support. When it comes to income taxes, there is no deduction for child support payments, and income from child support is not taxable to the recipient.

Single Mom

Let’s consider a single mother of three who receives $12,000 per year in child support, and makes a salary of $20,000, and let’s compare her to the father of the children who also makes a salary of $20,000. According to the government it’s the mother who needs taxpayer assistance, but in reality it’s the poor dad who has to work full-time and sleep in a tent.

The mom gets a tax refund of $8,297 while dad has to pay $784. The mom has disposable income of $38,767, $8,297 of which was stolen from other taxpayers and handed to her by the government, and $12,000 of which was contributed by the dad. Meanwhile the father is left with disposable income of just $5,686. Yeah, that’s right $5,686. But, according to the government, the mom needs more help, while dad can pay a little more in taxes.

Although the example is a bit simplistic, it is someone’s reality; and some degree of this reality occurs at all income levels. Been there, done that. The mom will probably cast her vote for the politicians filling her pockets with goodies, while the dad probably hates all politicians and doesn’t vote at all. The question is: Why is an extra $8,297 tax burden being put on other taxpayers to take care of this mother and her children? When the father gets a raise won’t the mom get one too, since child support is based on a percentage of gross income? Yeah, that’s how it works. So government should just stay the hell out of it, since it isn’t even assisting the right party.

Single No Kids

Now let’s consider a single homeowner, who has wages of $40,000 and pays $13,500 per year in mortgage interest and property taxes. This taxpayer bought the home for $200,000 and now it’s only worth $150,000 so he’s upside down. He has a total tax liability of $2,614 and is left with disposable income of $34,326. In effect, his tax debt of $2,614 has been transferred to the single mom above, who now has more disposable income than him, even though he makes twice as much money ($38,767 vs. $34,326). But when you ask politicians, they will again say that the single mom needs more help while the single homeowner can afford to sacrifice a little more, never mind his upside down mortgage.

Request Denied

Now politicians want to shake more money out of the 53.1% of working people who actually pay income taxes, to support spending for which they receive absolutely no benefit. Most of this excess spending isn’t even getting to the folks who really need the help anyway, such as the unemployed. To top that off, most of it isn’t even constitutional. By what authority does the government take money from one citizen and transfer it to another?

On behalf of the 53% who pay income taxes, the answer to your request for more sacrifice is ‘hell no’, ‘request denied’. It’s time for those who are not pitching in at all to give up something. It’s time to cut the fat. It’s time to end the nanny-state. The era of big government is over. If the 71,000,000 Americans who currently don’t pay any income taxes were to pitch in just $1,000 each, the government could raise $71 billion per year, or as the CBO would say, “$710 billion over 10 years”. Yes it’s time for some shared sacrifice, and it’s time to end the free lunch. Get rid of the phony tax credits, extend the current tax rates, and look into the proposal entitled, Revitalizing the U.S. Economy through Unemployment Reform. Put that in your veto pipe and smoke it.

___________________

Note: MC = Medicare Tax of 1.45%; FICA = Social Security Tax of 6.2%

Tax Reform 201: The Optimal Tax Rate

Stuck on Static

Tax Rates, GDP, and Static Retrogression

– by: Larry Walker, Jr. –

Those immersed in the static conception of human behavior say that America will never grow its way out of debt. Well, that’s a self-fulfilling prophecy if we base our tax policy on the static view. So do they think we can tax our way out of debt? If that’s the case, we might as well extend unemployment benefits indefinitely, and break out the hot dogs and beans. But there is another conception, known as the dynamic view. Dynamic analysts know that lower tax rates have positive impacts on human behavior, investment, production, economic growth, and tax receipts. Those of us who are faithful to the dynamic conception of human behavior believe it is better to grow our way out, than to surrender.

Today’s top income tax rate of 35.0% is relatively low in terms of a top rate of 39.6% during the 1990’s, but relatively high compared to rates of 7.0% in 1913, 24.0% in the 1920’s, and 28.0% in the 1980’s. A careful analysis of gross domestic product (GDP), during the highest and lowest tax rates of the past 30 years, reveals that cumulative GDP growth was 45.7% (.26/.569) higher when the lowest tax rates were imposed. Based on economic data available from the Bureau of Economic Analysis, it appears that a top tax rate of 28.0% is optimal (and that’s including the tax expenditures available in the 80’s). So today, we’ll look at relative tax rates, then analyze the performance of GDP and government revenues at relatively low and high tax rates, and then try to figure out what Obama is talking about.

Relative Tax Rates

As Mark Perry points out, in Tax Cuts, Tax Hikes, It’s All Relative; tax cuts and tax hikes are indeed relative. “…Certainly, compared to the “Clinton tax hikes” that took effect in 1993 and raised the top marginal income rate to 39.6%, the reductions of the top tax rate to 38.6% in 2002 and 35% in 2003 were “tax cuts”. But if you go back further and compare the Bush tax rates to the highest marginal tax rates under Bush, Sr. (31%) and Reagan (28%), couldn’t the Bush II tax rates more accurately be referred to as the “Bush tax hikes”?

“Of course, the tax rates were much higher before 1988, here’s the full history back to 1913 in the chart below. Compared to most of the tax rates between the 1930s and the 1980s, couldn’t the Clinton tax rates also accurately be referred to as the “Clinton tax cuts”?”

Sure it’s all relative, but what’s the optimal rate? In order to find the answer, we need a measurement.

Cumulative GDP Growth and Tax Rates

An analysis of the cumulative growth of GDP for the periods of 1981 to 1988, and 1993 to 2000 reveals that with top tax rates capped at 28.0%, GDP grew at a cumulative rate of 82.9%; and that when top tax rates rose to 39.6%, GDP only grew by 56.9%. This refutes the myth that the economy performed better under Clinton’s burdensome tax rates. The economy performed better than when? In reality, the economy grew at a much higher rate under Reagan, in fact 45.7% greater (see the table and chart below).

GDP Growth 80's-90's

A top marginal tax rate of 28.0% is optimal.

Optimal Tax Rates - Click to Enlarge

Why did the economy perform so much better with lower tax rates? The answer may have something to do with behavioral psychology. Let’s face it, there’s a big difference between knowing that ones top tax rate will be under 30.0%, versus essentially 40.0%. Perhaps human behavior is both conditioned and determined by its own outcomes or consequences (rewards and punishments). As a commenter recently remarked, “My first customer, like my last, responded to stimuli that benefited him and his business, and at the best possible price.” And what are income taxes, if not a price?

The difference between top tax rates of 28.0% and 39.6% can be reasonably quantified as a cost, or benefit, of 45.7% in cumulative economic growth, over an eight-year period. The effect of tax policies on GDP is but one aspect of a dynamic tax policy. Lower tax rates lead to increased economic activity, and eventually to greater tax revenues.

Growth in Government Revenue and Tax Rates

In terms of government revenues, tax receipts grew at a cumulative rate of 75.8% during the 80’s, and at 85.6% during the 90’s. In other words, Clinton’s tax policies increased tax revenue by 12.9% more than Reagan’s (see table below). But when we bring GDP back into the picture, we see that Clinton’s policies actually grew tax receipts by 50.4% more than GDP, while Reagan’s policies increased GDP by 9.4% more than revenue.

Government Revenues 80's and 90's

Under Clinton, government revenue grew at 85.6%, while GDP only managed 56.9%. Under Reagan GDP grew by 82.9%, while revenue increased by 75.8%. So which top tax rate is optimal? Although a top tax rate of 39.6% increased tax revenues by 12.9% more than a top rate of 28.0%, the cost to our economy was a loss of 45.7% in cumulative GDP growth. Again, a top tax rate of 28.0% is optimal. Think about it. What happens to you when your tax burden increases significantly faster than your personal income? Yeah, not a good thing; yet many idolize Clinton. And then there’s Obama, who not only wants to raise top rates back to 39.6%, but also to reset the top tax bracket to where it was 17 years ago. What’s up with that?

Obama’s Retrogression: Why $250,000?

Now that we know for sure that capping top tax rates at 28.0% leads to optimal economic and revenue growth, and that raising rates to 39.6% causes tax revenues to outpace the economy by 50.4%, the question is: What does $250,000 have to do with it? Well, a quick examination of the 1993 tax rate schedules reveals that the top tax bracket back then, seventeen years ago, was $250,000 (see table below).

1993 Tax Rates

Why is Obama regressing when it comes to the top tax bracket? He keeps saying he’s moving ‘forward’, and ‘making progress’, yet when it comes to income tax brackets, he wants to put it in reverse. If that is indeed his intent, then the major flaw in Obama’s appraisal is that he has failed to adjust for inflation. In real terms, $250,000 of income today was equal to just $164,275 in 1993 (calculate it here). And, $250,000 earned in 1993 is the equivalent of $380,460 today. Annual inflation over the 17-year span has been 2.5%. In fact, the top tax bracket today would be $380,460 if properly adjusted for inflation, and yet in 2010 it is $373,650 (the same as in 2009).

So Obama’s proposal boils down to taxing those with current incomes of $250,000, in 1993 dollars, without the benefit of an inflation adjustment, while taxing everyone else in current dollars. And if approved, it will result in nothing more than ‘legalized theft’. In effect, taxpayers who made between $164,275 and $250,000 in 1993 would be pushed into the top tax bracket by 2011. If Obama was playing it straight, he would simply let the Bush tax cuts expire. But instead, we are being asked to tolerate the idea that some taxpayers deserve the benefit of an inflation adjustment, while others do not.

However, Obama’s static retrogression is implausible. If the imposition of a top tax rate of 39.6% were optimal for our economy, then Obama’s approach might be practical, however, in light of the facts, it is most unsuitable. History proves that our economy achieved maximum growth when top tax rates were limited to 28.0%. The difference amounted to a 45.7% increase in cumulative GDP growth over an eight-year period. Obama’s strategy of lowering the bar of the top income bracket, while raising the top tax rate will cost our economy more than 45.7% in cumulative growth over the ensuing eight years, as more taxpayers get bilked.

At a time when America really needs an across the board tax rate cut, Americans are being asked to accept higher taxes, and regressive income brackets. If we are dumb enough to accept Obama’s proposal, in time we will achieve what many long for, a flat-rate-tax. But unfortunately the rate will wind up being 39.6% for all who are fortunate enough to endure. We can do this, but we need to be dynamic. Don’t get stuck on static. Cut spending, lower taxes, step back, quit lecturing, and for God’s sake stop chanting.

In the beginning it was:

Yes we can!
Yes we can!
Yes we can!

Then those chants quickly evolved into:

Yes government can!
Yes government can!
Yes government can!

And just before fizzling into dead silence, it was:

More for government, less for us!

Now that this foolishness has been exposed, and a line has been drawn, the question is: Which side are you on? Do you side with the people, or with the government? You can’t be for both. Either you are in favor of keeping more of your hard earned pay, or you are for handing over more to the government. Either you are for individual freedom and personal responsibility, or more government control. You are either for you, or against yourself.

Prerequisites: Tax Reform 101: Stuck on Static; Obama’s Inverted Wealth Curve

Data Sources: Bureau of Economic Analysis; Office of Management and Budget