
Don’t be lame. Be dynamic.
– By: Larry Walker, Jr. –
When it comes to tax policy, there are two schools of thought. Liberals and progressives cling to what’s known as static revenue analysis, while conservatives lean towards what’s known as dynamic revenue analysis. Today we will be comparing both concepts to gross domestic product, and government revenue between the years of 1993 and 2008. The objective is to open minds to the concept of dynamic analysis, and to prove once and for all that tax cuts lead to increased government revenues, and higher levels of economic activity. But first, lets look at a couple of examples:
Example 1: Static Revenue Policy – Joe the retailer owns a gift shop. One day Joe got sick and tired of lackluster sales and decided to raise prices by 100%. Joe believed that if he doubled prices, while maintaining the same volume of sales, that his revenues would double. Joe doubled prices but soon noticed that sales volume had dropped dramatically. Before the price increase, Joe averaged 1,000 customers per month, with average sales of $10 per customer, and total sales of $10,000 per month. After the price increase, the number of customers fell to 500 per month, with average sales of $20 per customer, and total sales of $10,000 per month. Joe soon realized that higher prices don’t necessarily lead to more revenue. Joe had applied a static revenue policy, and in the process learned that there’s more to business than meets the eye.
Example 2: Dynamic Revenue Policy – After taking a few businesses courses, Joe the retailer decided to give it another try. This time Joe decided to cut prices by 50%. Joe quickly noticed that sales traffic picked up dramatically. After the price cut, the average number of monthly customers rose to 2,000, with average sales of $10 per customer, and total sales of $20,000 per month. Why didn’t the average sale per customer fall from $10 to $5? Because, customers were already spending $10 per sale, and quickly figured out that they could now buy twice as much for the same amount; so consumption didn’t decrease. This time, Joe had applied a dynamic revenue policy, and in the process was able to double sales. Not only did sales double but, Joe was able to receive volume discounts from his suppliers for placing larger orders. Joe had finally arrived. Now, let’s look at GDP.
Gross Domestic Product
A comparison of GDP between the periods of 1993-2000 and 2001-2008 can be looked at in two ways. Static minds will focus to the far right of the table below, and pontificate that GDP grew at a higher rate, an average of 5.79% under Clinton, than the lackluster 4.71% under Bush. What they miss is found in the third and fourth columns. Comparing the total amount of gross domestic product over each term, we see that total GDP under Clinton was only $65.4 trillion, while it was $98.4 trillion under Bush. We also see that average annual GDP under Bush was $12.3 trillion, while under Clinton it was a mere $8.2 trillion. In other words, total economic production grew by 50.4% during an era of lower tax rates.
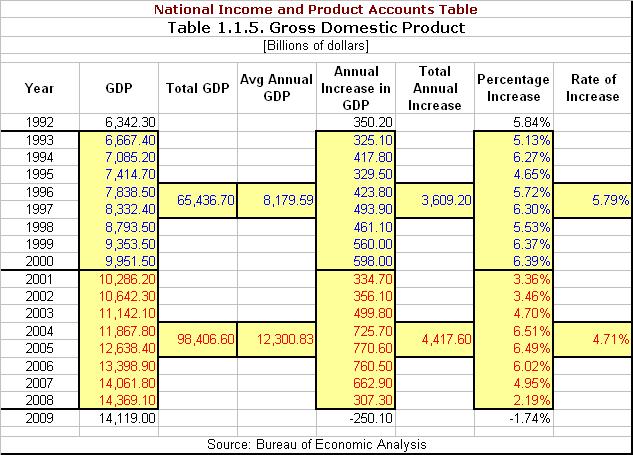
So then why was the annual percentage growth rate higher under Clinton? That’s easy. If you make $10,000 per year and get a 10% raise, your pay will have increased by $1,000. Fair enough. But if you make $100,000 per year and get a 5% raise, your pay will have increased by $5,000. Which would you rather have, more money, or a larger percentage increase? I’ll take the money.
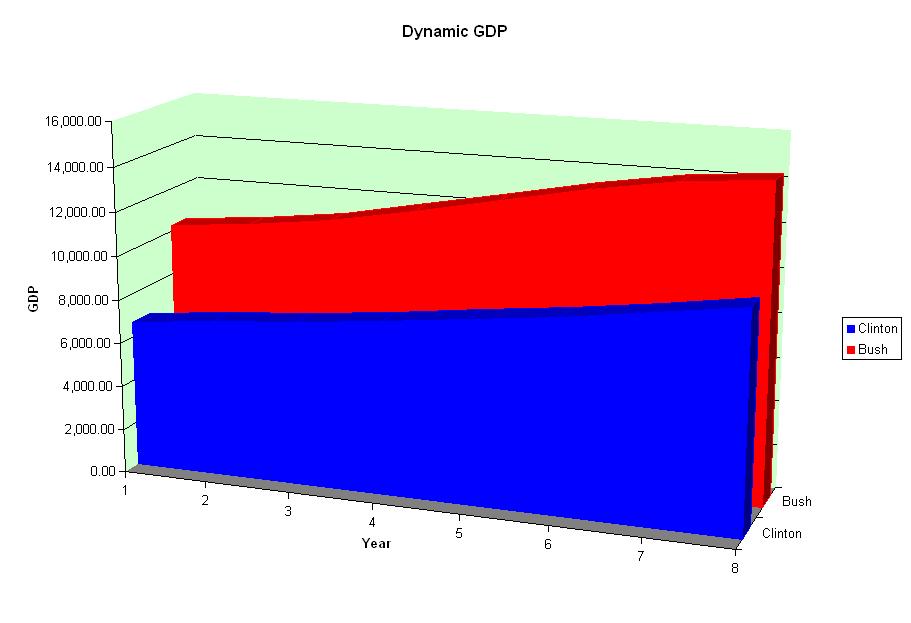
Here’s what this looks like graphically:
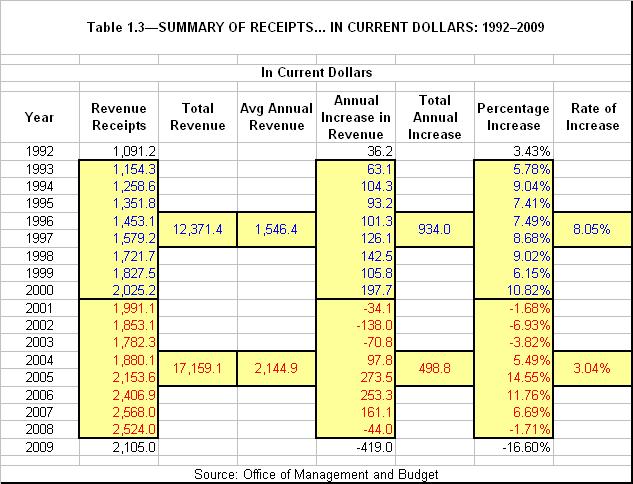
Government Revenues
Now let’s look at total government revenues over the same period. Static minds will focus to the far right of the table below, and lecture that government revenues grew at a higher rate, an average of 8.05% under Clinton, than the lackluster 3.04% under Bush. Again, what they miss is found in the third and fourth columns. Comparing the total amount of revenue raised over each term, we see that total revenues under Bush were $17.2 trillion, while under Clinton revenues were only $12.4 trillion. We also see that average annual revenue under Bush was $2.1 trillion, while under Clinton it was a mere $1.5 trillion. In other words, total government revenue grew by 38.7% during an era of lower tax rates.
Lower tax rates lead to greater tax revenues, and a larger economy. That’s the whole point. It’s the number of dollars that matters, not the rate of increase. The fact that revenue growth is achieved at lower annual growth rates is a bonus, especially when it comes to tax rates. The only problem we have is that the demands of government have grown faster than both revenues and GDP, but that’s another story. Remember: “Government is not a solution to our problem, government is the problem.” ~ Ronald Reagan
If we want to grow the economy and spread wealth, tax cuts are the way to go. It all depends on ones philosophy. Liberals and progressives want to grow the size of government, at the expense of the economy. Conservatives want to grow the economy at the expense of government. So let us all think clearly now, and not be stuck on static. Have a Merry Lame Duck session.
Sources: Bureau of Economic Analysis and Office of Management and Budget

Larry, you are so spot on….the problem is very few are listening.
LikeLike
Three things cannot be long hidden: the sun, the moon, and the truth. ~ Buddha
LikeLike
Pingback: Tax Reform 201: The Optimal Tax Rate | Black and Center