Tax Reform 201: The Optimal Tax Rate

Stuck on Static

Tax Rates, GDP, and Static Retrogression

– by: Larry Walker, Jr. –

Those immersed in the static conception of human behavior say that America will never grow its way out of debt. Well, that’s a self-fulfilling prophecy if we base our tax policy on the static view. So do they think we can tax our way out of debt? If that’s the case, we might as well extend unemployment benefits indefinitely, and break out the hot dogs and beans. But there is another conception, known as the dynamic view. Dynamic analysts know that lower tax rates have positive impacts on human behavior, investment, production, economic growth, and tax receipts. Those of us who are faithful to the dynamic conception of human behavior believe it is better to grow our way out, than to surrender.

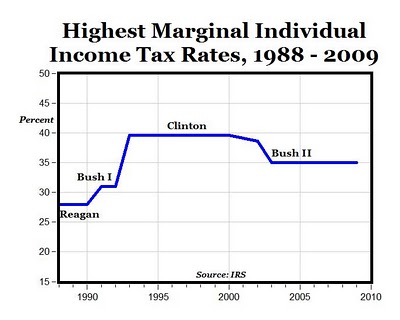
Today’s top income tax rate of 35.0% is relatively low in terms of a top rate of 39.6% during the 1990’s, but relatively high compared to rates of 7.0% in 1913, 24.0% in the 1920’s, and 28.0% in the 1980’s. A careful analysis of gross domestic product (GDP), during the highest and lowest tax rates of the past 30 years, reveals that cumulative GDP growth was 45.7% (.26/.569) higher when the lowest tax rates were imposed. Based on economic data available from the Bureau of Economic Analysis, it appears that a top tax rate of 28.0% is optimal (and that’s including the tax expenditures available in the 80’s). So today, we’ll look at relative tax rates, then analyze the performance of GDP and government revenues at relatively low and high tax rates, and then try to figure out what Obama is talking about.

Relative Tax Rates

As Mark Perry points out, in Tax Cuts, Tax Hikes, It’s All Relative; tax cuts and tax hikes are indeed relative. “…Certainly, compared to the “Clinton tax hikes” that took effect in 1993 and raised the top marginal income rate to 39.6%, the reductions of the top tax rate to 38.6% in 2002 and 35% in 2003 were “tax cuts”. But if you go back further and compare the Bush tax rates to the highest marginal tax rates under Bush, Sr. (31%) and Reagan (28%), couldn’t the Bush II tax rates more accurately be referred to as the “Bush tax hikes”?

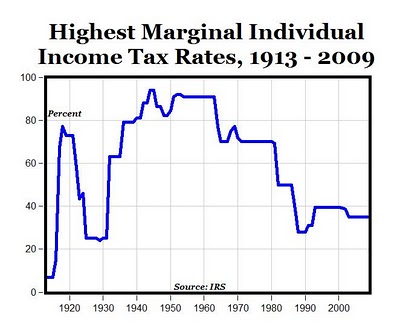
“Of course, the tax rates were much higher before 1988, here’s the full history back to 1913 in the chart below. Compared to most of the tax rates between the 1930s and the 1980s, couldn’t the Clinton tax rates also accurately be referred to as the “Clinton tax cuts”?”

Sure it’s all relative, but what’s the optimal rate? In order to find the answer, we need a measurement.

Cumulative GDP Growth and Tax Rates

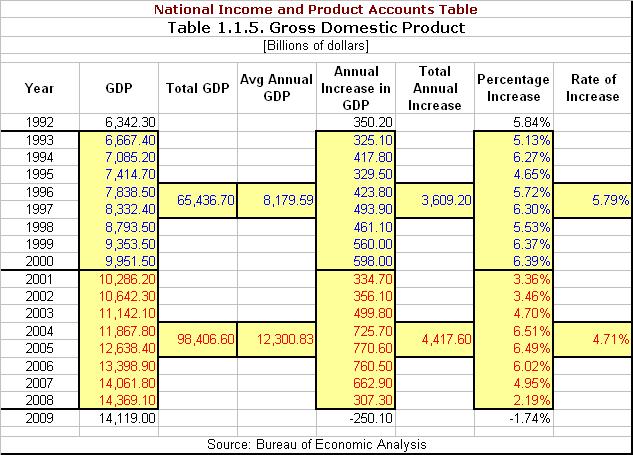
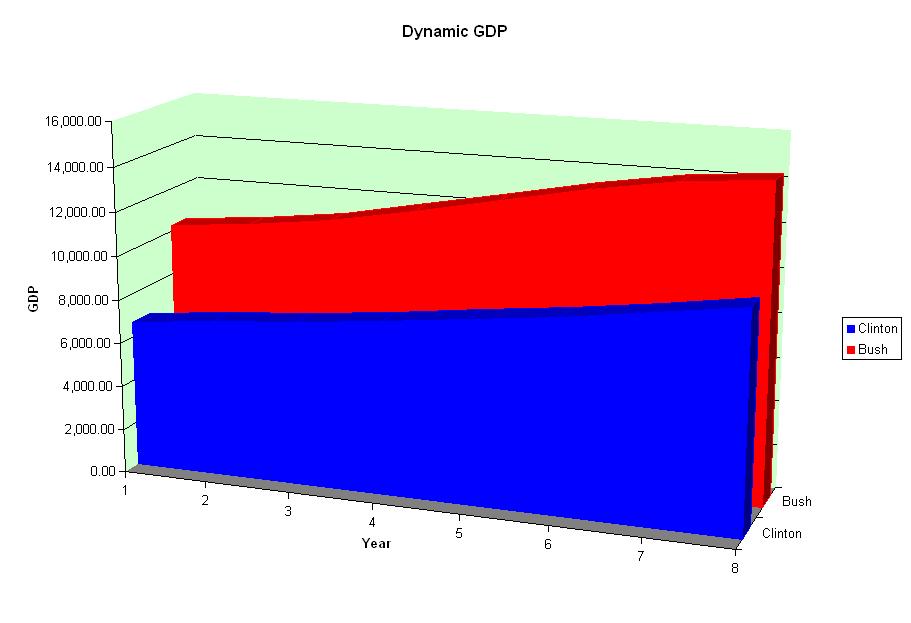
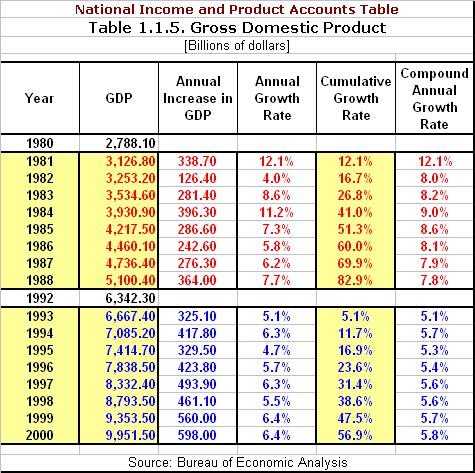
An analysis of the cumulative growth of GDP for the periods of 1981 to 1988, and 1993 to 2000 reveals that with top tax rates capped at 28.0%, GDP grew at a cumulative rate of 82.9%; and that when top tax rates rose to 39.6%, GDP only grew by 56.9%. This refutes the myth that the economy performed better under Clinton’s burdensome tax rates. The economy performed better than when? In reality, the economy grew at a much higher rate under Reagan, in fact 45.7% greater (see the table and chart below).

GDP Growth 80's-90's

A top marginal tax rate of 28.0% is optimal.

Optimal Tax Rates - Click to Enlarge

Why did the economy perform so much better with lower tax rates? The answer may have something to do with behavioral psychology. Let’s face it, there’s a big difference between knowing that ones top tax rate will be under 30.0%, versus essentially 40.0%. Perhaps human behavior is both conditioned and determined by its own outcomes or consequences (rewards and punishments). As a commenter recently remarked, “My first customer, like my last, responded to stimuli that benefited him and his business, and at the best possible price.” And what are income taxes, if not a price?

The difference between top tax rates of 28.0% and 39.6% can be reasonably quantified as a cost, or benefit, of 45.7% in cumulative economic growth, over an eight-year period. The effect of tax policies on GDP is but one aspect of a dynamic tax policy. Lower tax rates lead to increased economic activity, and eventually to greater tax revenues.

Growth in Government Revenue and Tax Rates

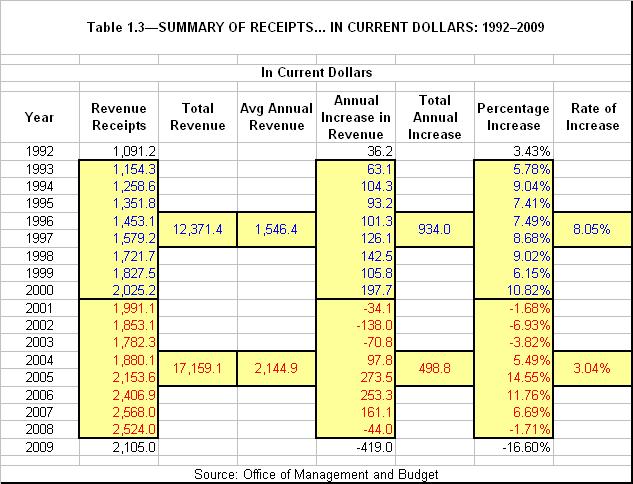
In terms of government revenues, tax receipts grew at a cumulative rate of 75.8% during the 80’s, and at 85.6% during the 90’s. In other words, Clinton’s tax policies increased tax revenue by 12.9% more than Reagan’s (see table below). But when we bring GDP back into the picture, we see that Clinton’s policies actually grew tax receipts by 50.4% more than GDP, while Reagan’s policies increased GDP by 9.4% more than revenue.

Government Revenues 80's and 90's

Under Clinton, government revenue grew at 85.6%, while GDP only managed 56.9%. Under Reagan GDP grew by 82.9%, while revenue increased by 75.8%. So which top tax rate is optimal? Although a top tax rate of 39.6% increased tax revenues by 12.9% more than a top rate of 28.0%, the cost to our economy was a loss of 45.7% in cumulative GDP growth. Again, a top tax rate of 28.0% is optimal. Think about it. What happens to you when your tax burden increases significantly faster than your personal income? Yeah, not a good thing; yet many idolize Clinton. And then there’s Obama, who not only wants to raise top rates back to 39.6%, but also to reset the top tax bracket to where it was 17 years ago. What’s up with that?

Obama’s Retrogression: Why $250,000?

Now that we know for sure that capping top tax rates at 28.0% leads to optimal economic and revenue growth, and that raising rates to 39.6% causes tax revenues to outpace the economy by 50.4%, the question is: What does $250,000 have to do with it? Well, a quick examination of the 1993 tax rate schedules reveals that the top tax bracket back then, seventeen years ago, was $250,000 (see table below).

1993 Tax Rates

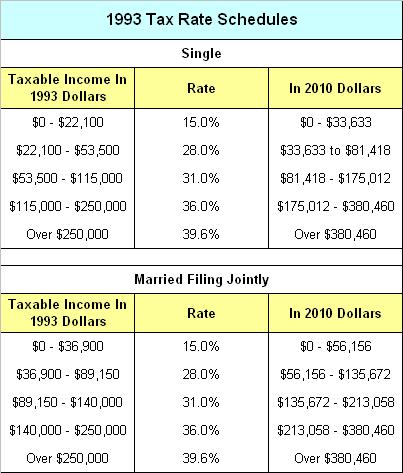
Why is Obama regressing when it comes to the top tax bracket? He keeps saying he’s moving ‘forward’, and ‘making progress’, yet when it comes to income tax brackets, he wants to put it in reverse. If that is indeed his intent, then the major flaw in Obama’s appraisal is that he has failed to adjust for inflation. In real terms, $250,000 of income today was equal to just $164,275 in 1993 (calculate it here). And, $250,000 earned in 1993 is the equivalent of $380,460 today. Annual inflation over the 17-year span has been 2.5%. In fact, the top tax bracket today would be $380,460 if properly adjusted for inflation, and yet in 2010 it is $373,650 (the same as in 2009).

So Obama’s proposal boils down to taxing those with current incomes of $250,000, in 1993 dollars, without the benefit of an inflation adjustment, while taxing everyone else in current dollars. And if approved, it will result in nothing more than ‘legalized theft’. In effect, taxpayers who made between $164,275 and $250,000 in 1993 would be pushed into the top tax bracket by 2011. If Obama was playing it straight, he would simply let the Bush tax cuts expire. But instead, we are being asked to tolerate the idea that some taxpayers deserve the benefit of an inflation adjustment, while others do not.

However, Obama’s static retrogression is implausible. If the imposition of a top tax rate of 39.6% were optimal for our economy, then Obama’s approach might be practical, however, in light of the facts, it is most unsuitable. History proves that our economy achieved maximum growth when top tax rates were limited to 28.0%. The difference amounted to a 45.7% increase in cumulative GDP growth over an eight-year period. Obama’s strategy of lowering the bar of the top income bracket, while raising the top tax rate will cost our economy more than 45.7% in cumulative growth over the ensuing eight years, as more taxpayers get bilked.

At a time when America really needs an across the board tax rate cut, Americans are being asked to accept higher taxes, and regressive income brackets. If we are dumb enough to accept Obama’s proposal, in time we will achieve what many long for, a flat-rate-tax. But unfortunately the rate will wind up being 39.6% for all who are fortunate enough to endure. We can do this, but we need to be dynamic. Don’t get stuck on static. Cut spending, lower taxes, step back, quit lecturing, and for God’s sake stop chanting.

In the beginning it was:

Yes we can!
Yes we can!
Yes we can!

Then those chants quickly evolved into:

Yes government can!
Yes government can!
Yes government can!

And just before fizzling into dead silence, it was:

More for government, less for us!

Now that this foolishness has been exposed, and a line has been drawn, the question is: Which side are you on? Do you side with the people, or with the government? You can’t be for both. Either you are in favor of keeping more of your hard earned pay, or you are for handing over more to the government. Either you are for individual freedom and personal responsibility, or more government control. You are either for you, or against yourself.

Prerequisites: Tax Reform 101: Stuck on Static; Obama’s Inverted Wealth Curve

Data Sources: Bureau of Economic Analysis; Office of Management and Budget

Tax Reform 101: Stuck on Static

Lame Duck

Don’t be lame. Be dynamic.

– By: Larry Walker, Jr. –

When it comes to tax policy, there are two schools of thought. Liberals and progressives cling to what’s known as static revenue analysis, while conservatives lean towards what’s known as dynamic revenue analysis. Today we will be comparing both concepts to gross domestic product, and government revenue between the years of 1993 and 2008. The objective is to open minds to the concept of dynamic analysis, and to prove once and for all that tax cuts lead to increased government revenues, and higher levels of economic activity. But first, lets look at a couple of examples:

Example 1: Static Revenue Policy – Joe the retailer owns a gift shop. One day Joe got sick and tired of lackluster sales and decided to raise prices by 100%. Joe believed that if he doubled prices, while maintaining the same volume of sales, that his revenues would double. Joe doubled prices but soon noticed that sales volume had dropped dramatically. Before the price increase, Joe averaged 1,000 customers per month, with average sales of $10 per customer, and total sales of $10,000 per month. After the price increase, the number of customers fell to 500 per month, with average sales of $20 per customer, and total sales of $10,000 per month. Joe soon realized that higher prices don’t necessarily lead to more revenue. Joe had applied a static revenue policy, and in the process learned that there’s more to business than meets the eye.

Example 2: Dynamic Revenue Policy – After taking a few businesses courses, Joe the retailer decided to give it another try. This time Joe decided to cut prices by 50%. Joe quickly noticed that sales traffic picked up dramatically. After the price cut, the average number of monthly customers rose to 2,000, with average sales of $10 per customer, and total sales of $20,000 per month. Why didn’t the average sale per customer fall from $10 to $5? Because, customers were already spending $10 per sale, and quickly figured out that they could now buy twice as much for the same amount; so consumption didn’t decrease. This time, Joe had applied a dynamic revenue policy, and in the process was able to double sales. Not only did sales double but, Joe was able to receive volume discounts from his suppliers for placing larger orders. Joe had finally arrived. Now, let’s look at GDP.

Gross Domestic Product

A comparison of GDP between the periods of 1993-2000 and 2001-2008 can be looked at in two ways. Static minds will focus to the far right of the table below, and pontificate that GDP grew at a higher rate, an average of 5.79% under Clinton, than the lackluster 4.71% under Bush. What they miss is found in the third and fourth columns. Comparing the total amount of gross domestic product over each term, we see that total GDP under Clinton was only $65.4 trillion, while it was $98.4 trillion under Bush. We also see that average annual GDP under Bush was $12.3 trillion, while under Clinton it was a mere $8.2 trillion. In other words, total economic production grew by 50.4% during an era of lower tax rates.

Dynamic GDP Table - Click to Enlarge

So then why was the annual percentage growth rate higher under Clinton? That’s easy. If you make $10,000 per year and get a 10% raise, your pay will have increased by $1,000. Fair enough. But if you make $100,000 per year and get a 5% raise, your pay will have increased by $5,000. Which would you rather have, more money, or a larger percentage increase? I’ll take the money.

Here’s what this looks like graphically:

Dynamic GDP Chart - Click to Enlarge

Government Revenues

Now let’s look at total government revenues over the same period. Static minds will focus to the far right of the table below, and lecture that government revenues grew at a higher rate, an average of 8.05% under Clinton, than the lackluster 3.04% under Bush. Again, what they miss is found in the third and fourth columns. Comparing the total amount of revenue raised over each term, we see that total revenues under Bush were $17.2 trillion, while under Clinton revenues were only $12.4 trillion. We also see that average annual revenue under Bush was $2.1 trillion, while under Clinton it was a mere $1.5 trillion. In other words, total government revenue grew by 38.7% during an era of lower tax rates.

Dynamic Revenue Table - Click to Enlarge

Lower tax rates lead to greater tax revenues, and a larger economy. That’s the whole point. It’s the number of dollars that matters, not the rate of increase. The fact that revenue growth is achieved at lower annual growth rates is a bonus, especially when it comes to tax rates. The only problem we have is that the demands of government have grown faster than both revenues and GDP, but that’s another story. Remember: “Government is not a solution to our problem, government is the problem.” ~ Ronald Reagan

If we want to grow the economy and spread wealth, tax cuts are the way to go. It all depends on ones philosophy. Liberals and progressives want to grow the size of government, at the expense of the economy. Conservatives want to grow the economy at the expense of government. So let us all think clearly now, and not be stuck on static. Have a Merry Lame Duck session.

Sources: Bureau of Economic Analysis and Office of Management and Budget

Obama’s Tax Fallacy III

WH Rubbish

More White House Rubbish

– by: Larry Walker, Jr. –

Does keeping the current tax rates in place constitute a tax cut? No. Only a reduction in current tax rates could be considered a tax cut. Keeping the current tax rates on one group, while raising tax rates on another, constitutes a net tax hike (i.e. 0 + 1 = 1). That’s just common sense. Let’s face the facts; there are really only five logical possibilities:

  1. Lower Tax Rates on Everyone = Tax Cut

  2. Raise Tax Rates on Everyone = Tax Hike

  3. Maintain Current Tax Rates on Some + Raise Tax Rates on Others = Net Tax Hike

  4. Maintain Current Tax Rates on Everyone = No Change

  5. Raise Tax Rates on Some + Cut Tax Rates on Others = It Depends*

Net Tax Hike

Let’s focus on number three, which seems to be Obama’s solution. To raise tax rates on a few is to raise them on everyone. For example, let’s say that we have a two-person society, of limited resources, composed of Joe the employee, and Joe the employer. If tax rates are left alone on Joe the employee and raised on Joe the employer what will happen? Joe the employer will either have to cut back on expenses, one of which is Joe the employee’s wages, or raise prices in order to maintain the status quo. Either reaction will curtail economic growth. This drag on the overall economy will decrease the amount of income earned, and the amount of taxes paid by both Joe’s. Of course there are other possibilities, one of which would be for Joe the employer to fire Joe the employee, and move his operations to another country, one that has lower wage demands, which leaves Joe the ex-employee totally dependent on the State. The point is that the imposition of a net tax hike will have negative consequences.

One Economy

While Obama has neatly dissected the American economy into classes based on annual income, our economy is actually one. There is no lower class, middle class or upper class America; there is just one United States of America. It doesn’t matter whether you are a doctor, lawyer, accountant, CEO, manager, teacher, or wage earner; we are all interconnected. We all rely on the products and services of one another. To increase tax rates on one is to raise them on all, to cut tax rates on one is to lower them on all.

Defining the Problem

Now, since Obama has come up with a solution, the question we need to ask ourselves is, what is the problem? Are we looking for a way to grow the economy and to create jobs? Or, are we looking for a way to reduce the federal budget deficit? If the goal were to grow the economy and create jobs, then the logical solution would be to implement across the board tax cuts. Under number five* (above); a tax cut would imply cutting taxes by more than they are raised; otherwise only number one will suffice.

However, if the objective is to reduce the federal budget deficit, then tax policy alone will not suffice. The reason that tax policy will not solve our budget woes is that our budgetary problem is comprised of two variables: revenues and expenditures. The main reason for the present imbalance is expenditures. In fiscal year 2010, the federal government spent around $1.6 trillion more than its revenues. So can this problem be solved through implementing a $1.6 trillion tax increase? Not hardly. We already know that drastic spending cuts are required.

It has already been proven time and again that the act of lowering tax rates has the effect of broadening the tax base and increasing revenues. It has also been proven repeatedly that increasing tax rates has the opposite effect. A recent example would be the NY cigarette tax. As the NY Post reported, “Sales of taxed cigarettes have plummeted a staggering 27 percent statewide since the highest cigarette tax in the nation took hold in July.” So did over a quarter of NY smokers quit smoking? Not exactly, they simply started buying cigarettes outside of the state. So the plan to increase revenues by raising cigarette taxes actually wound up creating a budget shortfall.

We already know that a tax increase will not spark economic growth or aid in job creation; only a tax cut will suffice. It is also clear that a tax increase won’t solve the budget dilemma. So why is Obama stuck on number three? What problem is he trying to solve? There is only one logical possibility: wealth redistribution (i.e. class warfare). Is this really where we should be focused at this moment in time? I say no. To me this is just a bunch of rubbish (i.e. partisan trash talk).

Certainty

Lowering tax rates would begin a new era of growth, like I personally experienced between the years 2003 through 2006, while a tax hike will only cause further cutbacks. Maintaining current tax rates would have one benefit, and one alone: certainty. Small business owners, such as myself, are just not able to function under the present cloud of unusual uncertainty. My experience this year has been that where I should have concrete answers, I have none. Most of my advice, and all of my decisions regarding asset acquisitions are on the shelf. It’s probably too late to change anything for 2010, but there’s always next year. However, there won’t be any definite decisions until there is certainty. And for me, certainty means stability. In other words, a temporary fix or patch won’t cut it. I’m holding out for a clearly defined long-term plan, such as W’s 10-year tax plan.

If I have to endure any more partisan rubbish from the White House, I will explode. I don’t think I can bear listening to another two years of partisan campaign trash. One and done son. One and done. For God’s sake, repeal the AMT, and either cut tax rates now, or extend the current rates, and then work on the out-of-control spending problem next year. These are the only logical options.

Obama on ‘Getting Stuff Done’

Stuff?

Too Busy Talking Trash to Lead

By: Larry Walker, Jr.

What happens when you spend years trying to persuade people, yet they are not persuaded? What happens when you try to instill confidence, yet only raise doubt? What happens when you try to bring people together, yet they become more divided? What happens when you attempt to set a tone, yet the tone you set is one of deafness? And what happens when you attempt to make an argument that the people can understand, and they understand it, yet they reject it? You get fired.

Barack Obama on 60 Minutes said, “You know, I think that over the course of two years we were so busy and so focused on getting a bunch of stuff done that we stopped paying attention to the fact that leadership isn’t just legislation. That it’s a matter of persuading people. And giving them confidence and bringing them together. And setting a tone. And making an argument that people can understand. And I think that we haven’t always been successful at that. And I take personal responsibility for that. And it’s something that I’ve got to examine carefully as I go forward.”

You can bet that voters will be carefully examining Obama’s leadership skills as we go forward. As far as getting a ‘bunch of stuff done’, now the task at hand is figuring out how to undo all of it without further damage to the nation. The major tax is whether Obama will be able to admit his failures, and work with others to correct his misconceptions. And speaking of taxes, how long will it take Obama to make that decision? Has he learned any lessons? We are watching and waiting.

One lesson that Obama has yet to learn is that, whether he is speaking from the Oval Office, in India, or on the campaign trail, he speaks on behalf of all Americans. When Obama trashes ½ of America, he is trashing all Americans. As Obama moves forward with his attempts to divide employee against employer, brother against sister, and child against parent, he risks an even greater backlash: total and complete rejection. Grow up or depart.

Leadership Quotes

“Management is doing things right; leadership is doing the right things.” ~ Peter F. Drucker

“Delegating work works, provided the one delegating works, too.” ~ Robert Half

“The very essence of leadership is that you have to have vision. You can’t blow an uncertain trumpet.” ~ Theodore M. Hesburgh

“The best executive is the one who has sense enough to pick good men to do what he wants done, and self-restraint to keep from meddling with them while they do it.” ~ Theodore Roosevelt

“Effective leadership is not about making speeches or being liked; leadership is defined by results not attributes.” ~ Peter Drucker

“You don’t lead by hitting people over the head – that’s assault, not leadership.” ~ Dwight D. Eisenhower

Definitions

Stuff: ideas of little value: trash

Trash: something worth little or nothing: as
a : junk, rubbish
b : (1) : empty talk : nonsense (2) : inferior or worthless writing or artistic matter (as a television show); especially : such matter intended purely for sensational entertainment (3) : trash talk

Translation

‘I was so busy talking trash that I forgot what I was supposed to be doing.’

Lesson

Leadership isn’t about talking trash.

References: President Obama on 60 Minutes: ‘Leadership Isn’t Just Legislation’

Stimulus: How China Created 22 Million Jobs While Obama Squandered 3.3 Million

Keys to success

Why Obama’s Stimulus Failed

By: Larry Walker, Jr.

China.org recently reported that China’s economic stimulus created 22 million jobs over the past two years. During same time frame, the Obama Administration’s economic stimulus plan lost 3.3 million jobs. The Chinese government’s two-year stimulus package cost an estimated $595.4 billion, while the Obama Administration squandered an estimated $887 billion.

What China got right, and what the Obama Administration did wrong.

The Goal

First, the Chinese government put the focus on jobs growth, with a goal of reaching full employment. The Obama Administration simply sought to create 3.5 million jobs, which is pathetic considering that 15 million Americans are unemployed.

The Target

Second, China focused on helping businesses retain jobs by allowing them to defer social insurance payments. The Obama Administration focused on demonizing businesses, while allowing a social security tax credit directly to what they referred to as the “middle class”. The “Make Work Pay” credit amounted to an annual subsidy of $400 per year ($30 per month, or $1.50 per day) for the average working person. The Obama Administration also implemented an Economic Recovery Credit of $250 per year, which was paid directly to retired persons. Out of the $887 billion squandered on Obama’s stimulus plan; only around 13% ($116 billion) was allocated between these programs. Although one might be able to live off of $1.00 to $1.50 per day in China, it doesn’t work like that in America. On top of this, if jobs growth were the goal, it would have made more sense to stimulate employers, rather than workers and retired persons.

The Timing

Third, the Chinese government cut the rate of social insurance contributions and provided certain social insurance subsidies for businesses. The Obama Administration, after doing virtually nothing to help businesses for all of 2009, finally woke up. After having lost 3.9 million jobs by the end of 2009 (link), the Administration finally pushed for the “Hire Act”, but not until February of 2010. Although the “Hire Act” allows a tax credit for the employer’s portion of social security taxes on new employees, the catch is that businesses have to hire new employees who can demonstrate that they have been unemployed for at least 60 days. Unfortunately, the Obama Administration has failed, to this day, to do anything to help employers retain their existing workforce. The Obama Administration has failed by doing too little, too late.

The Result

In addition to creating 22 millions jobs, the Chinese government claims to have helped 1.6 million businesses, and to have saved 60 million jobs. The Obama Administration’s stimulus plan was supposed to save 1,613,000 jobs in addition to creating 1,887,000 jobs, but since it actually resulted in the loss of 3,348,000 jobs, it will now take the creation of 5,235,000 jobs, by January of 2011, to reach the original target (reference).

Revised: Stimulus Job Tracker

Revised: Stimulus Jobs Created or Saved - Click to Enlarge

Multiple Choice Questions (choose one):

Who creates jobs in America?

A. Retired Persons
B. Working Persons
C. Businesses
D. None of the Above

When job creation is the goal, whom should an economic stimulus target?

A. Retired Persons
B. Working Persons
C. Businesses
D. None of the Above

How much longer will the American people stand for an arrogant and incompetent government?

Reference: China’s economic stimulus creates 22 million jobs

Minus 6.8 Million: Harry Reid’s Record on Jobs

Fired Up and Ready to Go

Reid’s Record on Jobs

*By: Larry Walker, Jr.*

Harry Reid says, “I think it is my job to create jobs and I’ve done my best.” Really? That was your best?

Harry Mason Reid is the senior United States Senator from Nevada and a member of the Democrat Party. He was first elected to the Senate in 1986, and was re-elected in 1992, 1998, and 2004, and is currently seeking a fifth term in 2010. Reid has served as the 24th Senate Majority Leader since January 4, 2007. Before his election to the Senate, Reid was a member of the United States House of Representatives, representing Nevada’s 1st congressional district from 1983 to 1987. Altogether, Reid has been a part of Washington D.C. for 28 years.

As far as Reid’s record on job creation, since the time he became the Senate Majority Leader our economy has shed 6.8 million jobs. Let’s check the record:

Total Non-Farm Employment 2007 to 2010

Total Non-Farm Employment 2007-2010 (click to enlarge)

Chart: Bureau of Labor Statistics through 10/8/10

Total Non-Farm Employment, 2007-2010

So Harry Reid thinks it’s his job to create jobs, and he says he’s done his best. And from the time Reid became the Senate Majority Leader, our economy has lost a total of 6,866,000 jobs. If job creation is Harry’s job, and that was the best he could do, then perhaps it’s time to hand over the keys.

Is job creation even part of a Senator’s job description?

During their October 14th debate, Sharron Angle answered, “Once again, Harry Reid: It’s not your job to create jobs.”

She continued, “I believe my job is to create the policies that will encourage the private sector to do what they do best.”

And then Angle hit the nail on the head, “We need to get back to work. The way we do that is by encouraging the private sector to do what they do best. Employers are in a cloud of uncertainty and they’re holding back $2 trillion that they would like to invest in jobs … They have lost confidence because of things like Obamacare.”

When Harry Reid loses on Tuesday, he will have effectively fired himself.

Addendum: Nancy Pelosi was sworn in as the 60th Speaker of the House at the same time that Reid became Senate Majority Leader, on January 4, 2007.

References:

http://www.cbsnews.com/8301-503544_162-20019697-503544.html

http://en.wikipedia.org/wiki/Harry_Reid

http://stats.bls.gov/webapps/legacy/cesbtab1.htm

Tracking the 5.2 Million Jobs Obama Squandered

“We have a system that increasingly taxes work and subsidizes nonwork.” ~ Milton Friedman

 By: Larry Walker, Jr.

 “Tracking the 3.5 million jobs Obama will save or create.” That was the title of a blog post, last updated on January 8, 2010, on a website named Understanding The Market – Capire Il Mercato. In a note, the author, Cole Kendall stated, “I will make the calculations in a way that provides a “best case” to the Obama team.” Since Mr. Kendall decided to give up on his tracking operation at the end of 2009, I decided to finish it off.

Using the same criteria as originally outlined by Obama’s (now former) economic team, jobs are defined by counting the total non-farm employment, from Table B-1 of the Bureau of Labor Statistics, “Employment Situation Report” (seasonally adjusted).

Instead of boring you with the month-by-month 2010 data, I went ahead and cut to the chase, skipping from December of 2009, where Mr. Kendall left off, to September of 2010, the latest data available from the 10/08/2010 report.

Following is an excerpt from the original blog post, followed by the revised tracker, and a brief analysis:

In an earlier essay I tried to explain President Obama’s notion of saving or creating jobs. The stimulus plan bill was passed by both houses of Congress last night and the final plan was a bit smaller than the earlier version, so the President now asserts that the plan will save or create 3.5 million jobs.

This post will track the 3.5 million jobs. There are a number of ways to measure jobs in the US. Some people work several different jobs at a time while others change employers frequently, so measuring jobs is not as simple as it might seem. There was a cartoon from the Clinton era showing the President speaking at a dinner that he had created 8 million jobs and an overworked waiter thinking that he had three of them. Obama’s economic team define jobs as use the payroll data (see here for their original report).

Just before the stimulus bill passed the Department of Labor issued a report (see here). The number of people working (see Table B1, about 2/3 of the way down, with the heading “Establishment Data”) was 134,580,000 (seasonally adjusted). This is a preliminary measure and will be revised next month and probably revised again in a year. Using the Obama team methodology, without the stimulus bill employment would be expected to fall by around 1,613,000 jobs during the next two years so that without the stimulus bill we would expect employment to be 132,967,000 in January 2011.

With the revised estimate of 3,500,000 jobs “saved or created”, employment should be 136,467,000, creating 1,887,000 in addition to the 1,613,000 jobs saved.

The table below will be updated with every new employment release to see how jobs have changed. The first column is the actual number of payroll jobs starting with the month before the stimulus plan passed; the second column is the total change in employment since the month when the stimulus plan passed and the third column shows the gap remaining of jobs to be “created” in order to reach the target.

Revised: Stimulus Job Tracker

Revised: Stimulus Jobs Created or Saved - Click to Enlarge

The conclusion is pretty grim, and certainly doesn’t mesh with what Obama has been saying out on the campaign trail. The sad truth is that instead of creating 3.5 million jobs since the stimulus plan was passed, it has resulted in the loss of 3.3 million jobs. Since the stimulus plan was supposed to save 1,613,000 jobs in addition to creating 1,887,000 jobs, and since it actually resulted in the loss of 3,348,000 jobs, it would now take the creation of 5,235,000 jobs, by January of 2011, to reach the original target.

I don’t know what you call this, but I call it a failure. It’s so bad that most people simply stopped tracking it. So do we need another stimulus plan, or another Congress, Senate, and ultimately President? I don’t think it helps having Obama roam around the country making false claims in an effort to re-elect the same folks who screwed this up. The thought of $887 billion of deficit-financed spending flushed down the drain doesn’t bode well for those who supported it.

You can fool some of the people all of the time, and all of the people some of the time, but you can not fool all of the people all of the time. ~ Abraham Lincoln (R-IL)

Sources:

http://stats.bls.gov/news.release/empsit.t17.htm

http://stats.bls.gov/webapps/legacy/cesbtab1.htm

http://understandingthemarket.com/?p=63

Table B-1 Data: Total Non-Farm Employment (Seasonally Adjusted):

http://stats.bls.gov/webapps/legacy/cesbtab1.htm

BLS Table Revised 10/8/2010

Chart Per BLS 10/8/2010

National Debt: A National Disgrace

Shovel Ready Debt

Who drove us into this ditch, again?

*By: Larry Walker, Jr.* [updated]

In the United States, the total debt outstanding as of September 30, 2010, stood at $13,561,623,030,891.70. It’s interesting to note that over the past 40 years, 69.1% of this debt is attributable to Democrat led congresses, and only 28.1% to Republicans. If we agree that the National Debt has reached the crisis level, then the question we must ask ourselves is, “Whom do I trust?” And before I go further, let me point out that I am neither a Republican nor a Democrat. I am a member of the Give Me The Damn Keys Back Party. No, actually I am a member of America’s Independent Party (AIP). Now, let’s check the record.

1971 to 1977 [Democrat Debt $249,514,293,050.07]

Carl Bert Albert represented Oklahoma’s 3rd congressional district as a Democrat for 30 years. He served as the 54th Speaker of the United States House of Representatives from 1971 to 1977. During his six-year term as Speaker, Mr. Albert added $249,514,293,050.07 to the national debt, which represented an increase of 67.3%.

1977 to 1987 [Democrat Debt $1,504,869,616,658.42]

Thomas Phillip “Tip” O’Neill, Jr. represented the 8th and 11th congressional districts of Massachusetts as a Democrat for 34 years. He served as the 55th Speaker of the House from 1977 until his retirement in 1987, making him the second longest-serving Speaker in U.S. history. During his ten-year term as Speaker, Mr. O’Neill added $1,504,869,616,658.42 to the national debt, which represented an increase of 242.6%.

1987 to 1989 [Democrat Debt $732,128,343,528.90]

James Claude Wright, Jr., usually known as Jim Wright, represented the 12th congressional district of Texas as a Democrat for 34 years. He served as the 56th Speaker of the House from 1987 to 1989. During his three-year term, he added $732,128,343,528.90 to the national debt, which represented an increase of 34.4%.

1989 to 1995 [Democrat Debt $1,835,318,949,826.00]

Thomas Stephen Foley represented Washington’s 5th congressional district as a Democrat for 30 years. He served as the 57th Speaker of the House from 1989 to 1995. During his five-year term as Speaker, Mr. Foley added $1,835,318,949,826.00 to the national debt, which represented an increase of 64.2%.

1995 to 1999 [Republican Debt $833,443,098,884.30]

Newton Leroy “Newt” Gingrich represented Georgia’s 6th congressional district as a Republican for 20 years. He served as the 58th Speaker of the House from 1995 to 1999, ending 40 years of the Democrat Party being in the majority. During his four-year term as Speaker, Mr. Gingrich added $833,443,098,884.30 to the national debt, which represented an increase of 17.8%.

1999 to 2007 [Republican Debt $2,980,780,890,317.61]

John Dennis “Denny” Hastert represented Illinois’s 14th congressional district as a Republican for 20 years. He served as the 59th Speaker of the House from 1999 to 2007. During his eight-year term as Speaker, Mr. Hastert added $2,980,780,890,317.61 to the national debt, which represented an increase of 53.9%.

2007 to 2010 [Democrat Debt $5,054,649,131,676.47]

Nancy Patricia D’Alesandro Pelosi has represented California’s 8th congressional as a Democrat for 23 and one-half years. She has served as the 60th Speaker of the House since January 4, 2007. During her four-year term as Speaker, Mrs. Pelosi has added $5,054,649,131,676.47 to the national debt, which represents an increase of 59.4%.

Recap

Democrats have controlled the Congress for 28 of the last 40 years. Over this 40 year span, Democrat led congresses have added $9,376,480,334,739.86 to the national debt, which represents 69.1% of the total debt outstanding (as of 09/30/2010). In comparison, Republican led congresses have added $3,814,223,989,201.91 to the debt, which represents 28.1% of the total outstanding. In contrast, Nancy Pelosi is responsible for adding a grand total of $5,054,649,131,676.47, or 53.9% of the Democrats debt, and 37.3% of the total debt outstanding, in just four years.

During their 12 years of majority control, Republicans, Gingrich and Hastert added an annual average of $317,851,999,100.16 to the national debt. In contrast, in her short four-year term, Nancy Pelosi has added an annual average of $1,263,662,282,919.12. What Nancy Pelosi has done to this country in the last four years is nothing short of a national disgrace.

The question is which party do you trust to put a cap on our debt crisis: Democrat, Republican, or Independent?

Addendum: Harry Reid was sworn in as the 24th Senate Majority Leader at the same time that Pelosi became Speaker of the House, on January 4, 2007.

_______________

U.S. Constitution – Article 1 Section 7: “All bills for raising Revenue shall originate in the House of Representatives; but the Senate may propose or concur with Amendments as on other Bills.”

References:

http://www.treasurydirect.gov/govt/reports/pd/histdebt/histdebt.htm

http://en.wikipedia.org/wiki/Speaker_of_the_United_States_House_of_Representatives

MythBuster II: Has Obama Created More Jobs Than Bush?

Hmmm!

In Search of Private Sector Jobs

By: Larry Walker, Jr.

Without question, the majority of private sector jobs created in 2010 were created in the Service Sector. Understanding precisely where is quite revealing. After my last blog post, I received the following comments, from a blogger known as Patriot01: “Ever notice that they never say what KIND of jobs they’ve allegedly “created”? And I’d like an itemized list of the jobs “saved”………wouldn’t you?” Well, of course I would, wouldn’t you? Are you ready?

Education and Health Services

Drilling down into the numbers, we found that most of those jobs were created in the Education and Health Services sub-sector. Yet when we analyzed this sector, we found that job growth has been fairly constant, even throughout the recession. In fact, you can call this a recession proof sector (graph and table below).

Series Id: CES6500000001
Seasonally Adjusted
Super Sector: Education and health services
Industry: Education and health services
NAICS Code: –
Data Type: ALL EMPLOYEES, THOUSANDS

Education and Health Services

Under President Bush, job growth in this sub-sector averaged 465,000 jobs per year, even during the worst of the recession. So far under Obama, annual job growth in this sub-sector is averaging around 332,000. So although the industry has been virtually recession proof, the number of jobs created under Obama is on the decline.

Under President Bush a total of 3,720,000 jobs were added to this sub-sector during his eight-year term. And so far under Obama a total of 578,000 jobs have been created. In terms of percentages, during the Bush years the sub-sector grew at an average of 2.8% annually, while under Obama average job growth has cooled to 1.7%.

So does this look like anything remotely close to proof of the absurd statement that, “Obama created more jobs in 2010 than Bush did in eight years?” Not hardly. But there’s more.

Employment and Temporary Help Services

The other sub-sectors where we discovered job growth in 2010 were Employment Services, and more specifically Temporary Help Services. So far this year, we have recovered 228,000 jobs in Employment Services, and out of those, 218,000 were under the sub-category of Temporary Help Services (graphs and tables below). Add these to the 261,000 jobs created in the, recession proof, Education and Health Services sector, and together they account for 489,000 jobs “created” in the last nine months, or basically the whole enchilada.

Series Id: CES6056130001
Seasonally Adjusted
Super Sector: Professional and business services
Industry: Employment services
NAICS Code: 5613
Data Type: ALL EMPLOYEES, THOUSANDS

Employment Services

Series Id: CES6056132001
Seasonally Adjusted
Super Sector: Professional and business services
Industry: Temporary help services
NAICS Code: 56132
Data Type: ALL EMPLOYEES, THOUSANDS

Temporary Help Services

Busted Again!

So there it is, Obama’s greatest feat to-date is that he has managed to slow job growth in the Education and Health Services sector, which has always been recession proof; and he has only managed to recover jobs in the Temporary Help Services sub-sector. And this, his cohorts call a great success? Those of us who are rationally-minded beg to differ.

We wonder how long our economy can sustain itself through providing temporary job search services, especially when the type of jobs people want no longer exist. Meanwhile, our non-existent Goods-Producing sector has hemorrhaged 6,524,000 jobs over the last 10 years, and nothing is being done about it. Where are those jobs? In China.

Charts and Tables from the Bureau of Labor Statistics, Establishment Data, Table B-1 (here).

MythBuster: Has Obama Created More Jobs Than Bush?

Hmmm!

Rational or Ridiculous

by: Larry Walker, Jr.

So the latest spin by the left-wing media and the White House is to repeat the following mantra, “Obama created more jobs in 2010 than Bush did in eight years.” However, how much sense does it make to compare an arbitrary nine-month period for Obama to a full eight-year term? Well none, none at all, at least not within the realm of rational human thought. For those of us who are rationally-minded, we will begin with the month that Obama took office, and compare his full term to-date with whomever.

Turning to the Bureau of Labor Statistics (BLS), when we added up the total number of private sector jobs created during Obama’s short twenty one month tenure, we found that a total of 2,991,000 jobs had been lost (110,961,000 – 107,970,000). Oops!

Private Sector Jobs 2009/2010

Total Private Sector Employment (Bureau of Labor Statistics)

Private Sector Job Growth (Loss)

Busted!

Although I too could cherry-pick and find periods where private sector job growth was up by 4 or 5 million under Bush, I choose to remain among the rational. Needless to say, private sector job growth was at least slightly positive over Bush’s eight-year term, while under Obama, the words – worst track record in history – come to mind.

Is there no shame?

Also see: Tracking the 3.5 Million Jobs Obama Saved or Created and Deceptive Claim from Obama & The Democrats or Obama’s New Reality: Black Unemployment