The Real Jobs Deficit | Moving in the wrong direction.

“Every time in this century we’ve lowered the tax rates across the board, on employment, on saving, investment and risk-taking in this economy, revenues went up, not down.” ~ Jack Kemp

* By: Larry Walker, Jr. *

A total of 3,514,000 Nonfarm jobs had already been lost by the time President Bush handed the keys over to Barack Obama, yet even though the Great Recession officially ended in June of 2009, an additional 4,889,000 jobs were lost during Obama’s first 11 months in office (see table). By November of 2009 the recession had eliminated an estimated 8,403,000 jobs. It was at this point that Nobel Prize Winning Economist Paul Krugman set forth a reasonable benchmark for a return to more or less full employment within 5 years.

According to Mr. Krugman’s theory, in order to keep up with population growth and recover the number of jobs lost would have required the creation of 300,000 jobs per month, through December of 2014. But, as I pointed out in Obama Jobs Scorecard – Part 3, today we find ourselves more than 5.4 million jobs short of this mark. However, the real jobs deficit is even more dire.

The Real Jobs Deficit

If we return to December of 2007, the month the recession began, and apply the Economic Policy Institute’s estimate — that we need to create a minimum of 127,000 jobs each and every month to keep up with population growth — we find that the real jobs deficit, since the recession began, is currently 11,742,000 (see table). As you can see graphically in the chart below, the jobs deficit hasn’t changed much since Paul Krugman set the benchmark at 300,000 jobs a month. Since then, as shown in the corresponding table, the jobs deficit hasn’t decreased at all, but has rather increased by 291,000.

Real Jobs Deficit

Last month, according to the Bureau of Labor Statistics, the U.S. economy created a mere 69,000 jobs (only 77,000 in the month prior). Since we need to create 127,000 a month just to keep pace with population growth that means lately we’ve been falling even farther behind. In fact, at last month’s rate, the U.S. will find itself another 3,190,000 jobs in arrears after another 4 ½ years of Obama’s economic policies [(127,000 – 69,000) * 55 months]. So we need to keep a close eye on the next official Employment Situation Report, and each subsequent report through Election Day. Anything short of a 127,000 increase in Nonfarm payroll jobs adds to the current jobs deficit, while a greater result means we’re at least moving in the right direction.

The New Jobs Benchmark

If we tweak Paul Krugman’s original jobs benchmark with the revised figures, we discover that to be meaningful, the number of jobs we need to create to return to more or less full employment by December of 2014 is now as follows:

  • In order to keep up with population growth, we would need to create 127,000 jobs times 31 months, or 3,937,000. Add in the need to make up for lost ground and we’re at around 15,679,000 (3,937,000 + 11,742,000) over the next 31 months — or 505,774 jobs a month.

However, if we just simply write-off Barack Obama’s first 3 ½ years as a foolish, but costly experiment, and extend the target date until May of 2017, then we come up with the following:

  • In order to keep up with population growth, we would need to create 127,000 jobs times 60 months, or 7,620,000. Add in the need to make up for lost ground and we’re at around 19,362,000 (7,620,000 + 11,742,000) over the next 60 months — or 322,700 jobs a month.

In other words, we are worse off today than we were 2 ½ years ago. Every month that we create 506,000 jobs or more puts us on track towards full employment within 2 ½ years. Every month we create 320,000 jobs puts us on track towards full employment within 5 years. But every month we create fewer than 127,000 jobs increases the jobs deficit and pushes the goal of full employment farther away.

The Bottom Line: Due to the Great Recession, we already had a jobs deficit of 5,165,000 when Barack Obama was sworn into office, but since then the deficit has increased by an additional 6,577,000 (see table). In other words, we’re NOT moving in the right direction, no matter what Barack Obama says. So who’s going to get us out of this ditch — the same guy who just dug a hole twice as deep as the one we were already in — or someone else?

Data Table: Real Jobs Deficit Spreadsheet on Google Docs

Obama Jobs Scorecard, Part 3 : The American Dream

“53 Percent of All Young College Graduates in America are either Unemployed or Underemployed” ~ The Economic Collapse

* By: Larry Walker, Jr. *

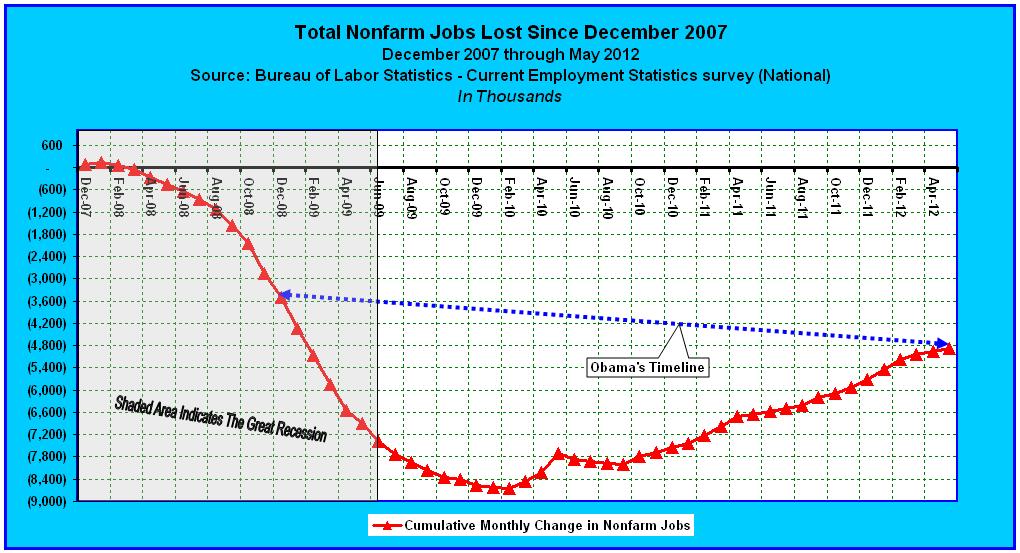
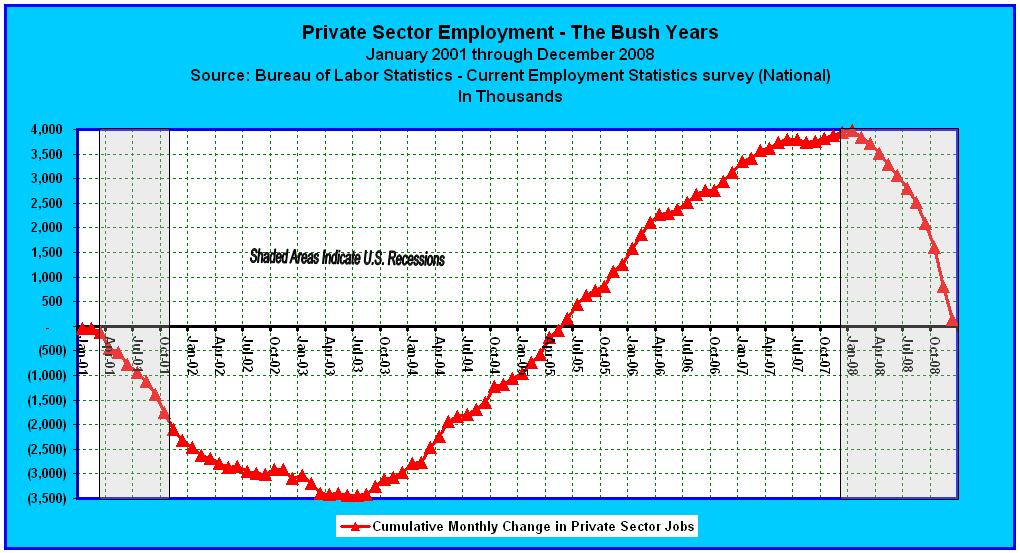
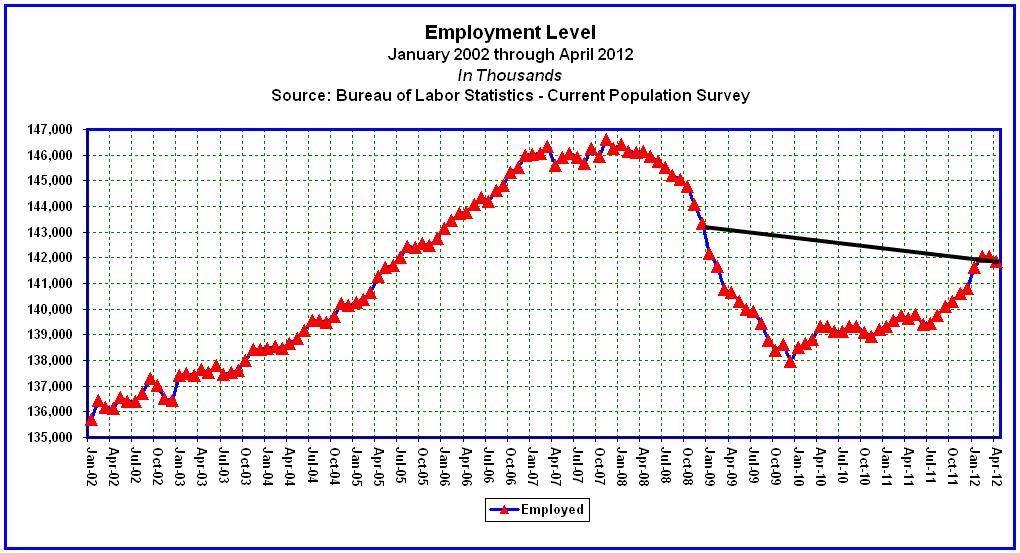
It is a fact that the U.S. economy has lost a total of 4,884,000 Nonfarm jobs since the beginning of the Great Recession. But according to the National Bureau of Economic Research, the recession officially ended three years ago. We would all like to believe that things aren’t so bad, that the glass is half full, but for many the American Dream appears to be fading away. The question we should be asking ourselves, three years into this economic recovery, is whether we are creating a sufficient number of jobs each and every month: (1) to keep pace with population growth, and (2) to recover the number of jobs already lost? Today, we will provide the answer.

The Working-Age Population

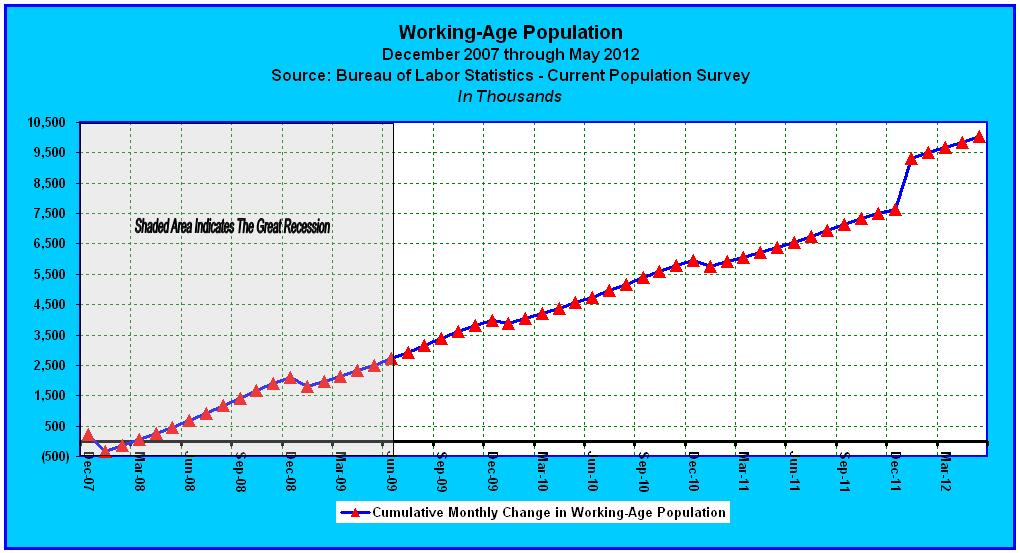
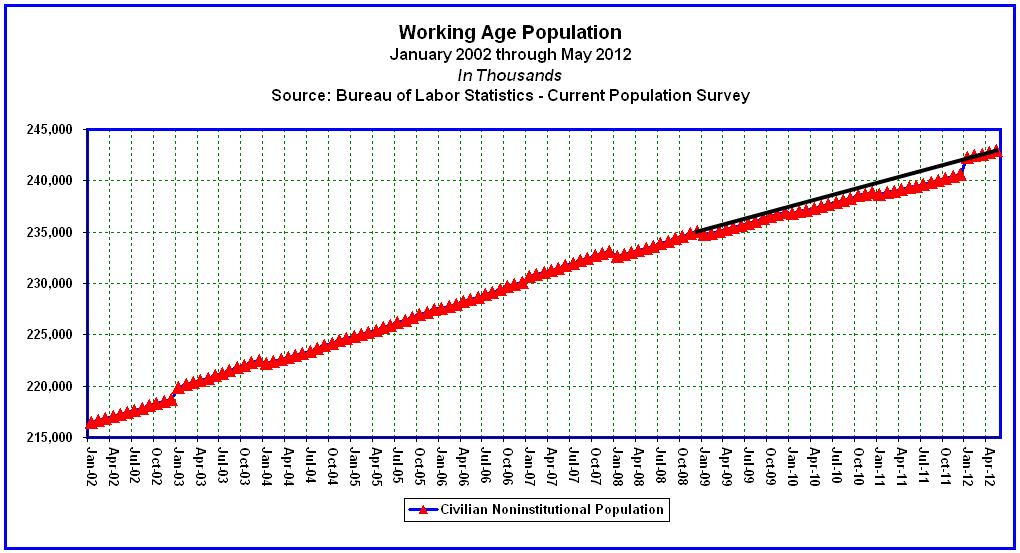
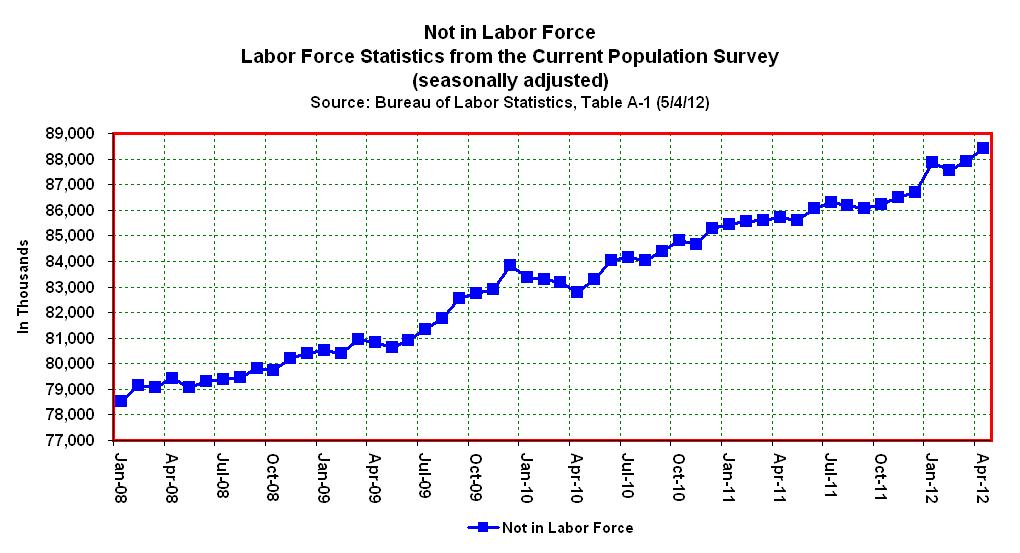
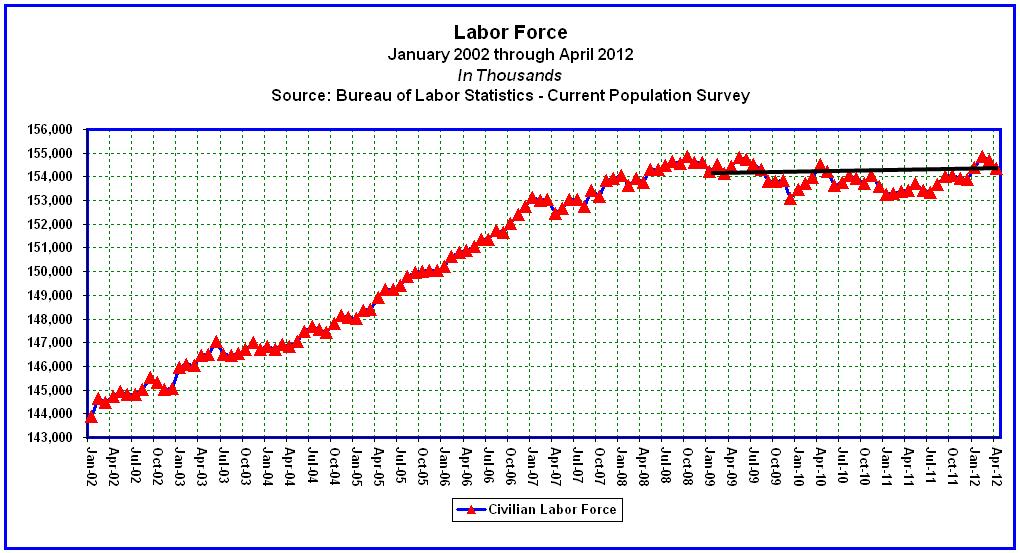
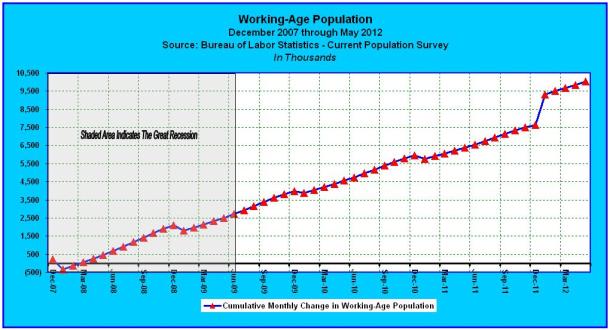
The Civilian Non-institutional Population, or as I prefer to call it, the Working-Age Population, includes persons 16 years of age and older residing in the 50 States and the District of Columbia, who are not inmates of institutions (i.e. penal and mental facilities, or homes for the aged), and who are not on active duty in the Armed Forces. According to the Bureau of Labor Statistics, Table A-1, one month before the recession began, the working-age population totaled 232,939,000, and as of May 31, 2012 it had grown to 242,966,000. Thus, the working-age population has increased by 10,027,000 persons since the start of the recession, and by 7,931,000 since they keys were handed to Barack Obama (see chart below).

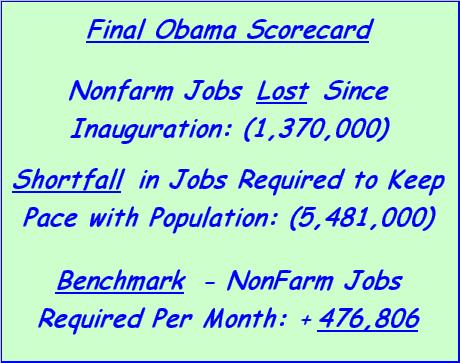
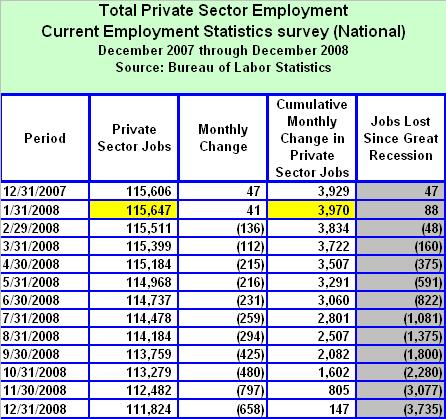
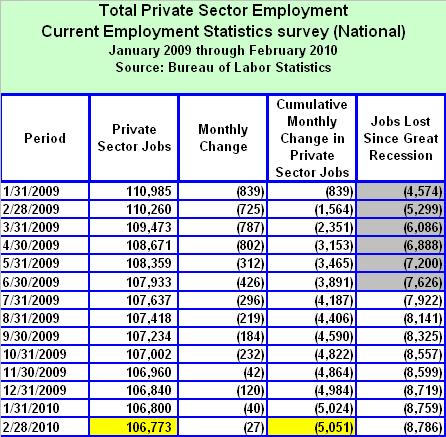
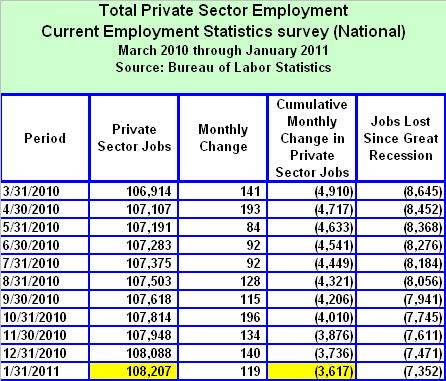
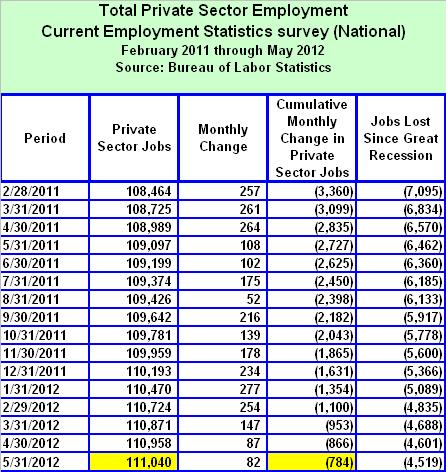
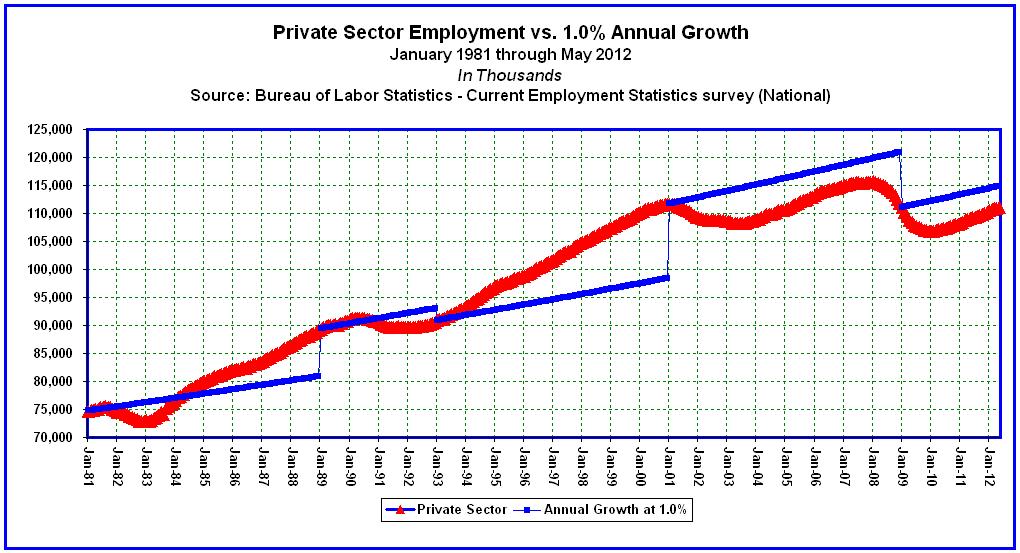
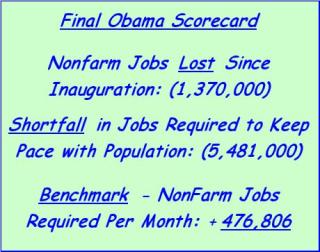
Since we know that the economy had already lost a total of 3,514,000 jobs during the last 13 month’s of President Bush’s term, that it has shed another 1,370,000 jobs since Barack Obama’s inauguration, and that the working-age population has grown by 10,027,000 persons over the same period, the question is how many jobs must we create each and every month in order to catch-up? And in light of the answer, how does anyone get away with a statement like the following: We’ve created 4.3 million new jobs over the last 27 months, over 800,000 just this year alone. The private sector is doing fine?

Krugman’s Benchmark

In Paul Krugman’s December 2009 article entitled, The Jobs Deficit, he proposed a rather useful benchmark for the level of jobs the U.S. must create each month to really matter. As of November 2009 we had lost about 8.4 million jobs from the time the recession began. He began with the Economic Policy Institute’s (EPI) estimate that we need to add 127,000 jobs per month just to keep pace with population growth. That very same month, EPI pointed out that when you put together the number of jobs lost since the recession, along with the number required to keep pace with the population, that in order to return to pre-crisis unemployment within two years we needed to add 580,000 jobs a month.

Krugman conceded that there was no way this was going to happen within two years. So he proffered a more modest goal: a return to more or less full employment in 5 years. According to his formula, in order to keep up with population growth over those 7 years (December 2007 to December 2014), “the United States would have had to add 84 times 127,000 or 10.668 million jobs.” Krugman stated, “If that sounds high, bear in mind that we added more than 20 million jobs over the 8 Clinton years.” He continued, “Add in the need to make up lost ground, and we’re at around 18 million jobs over the next five years — or 300,000 a month.”

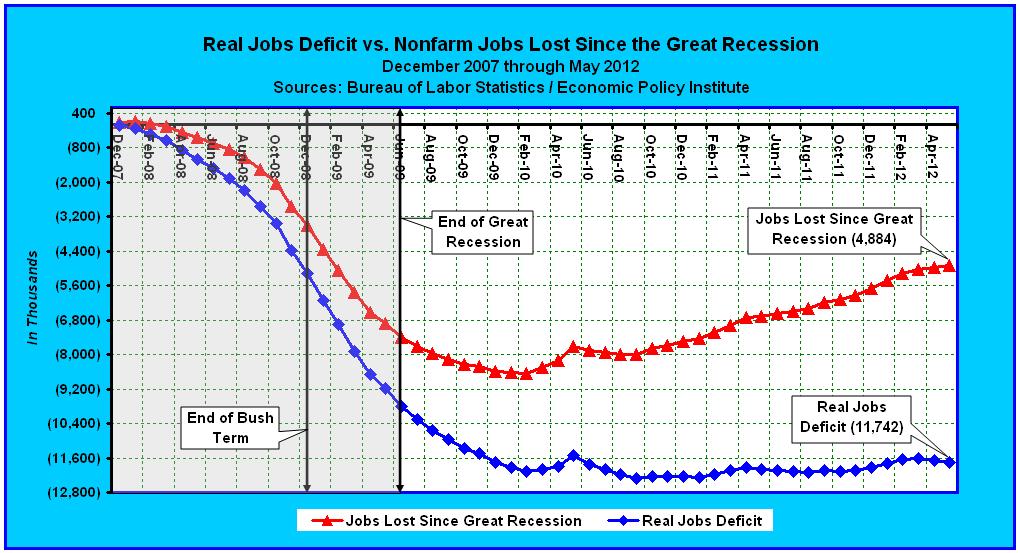
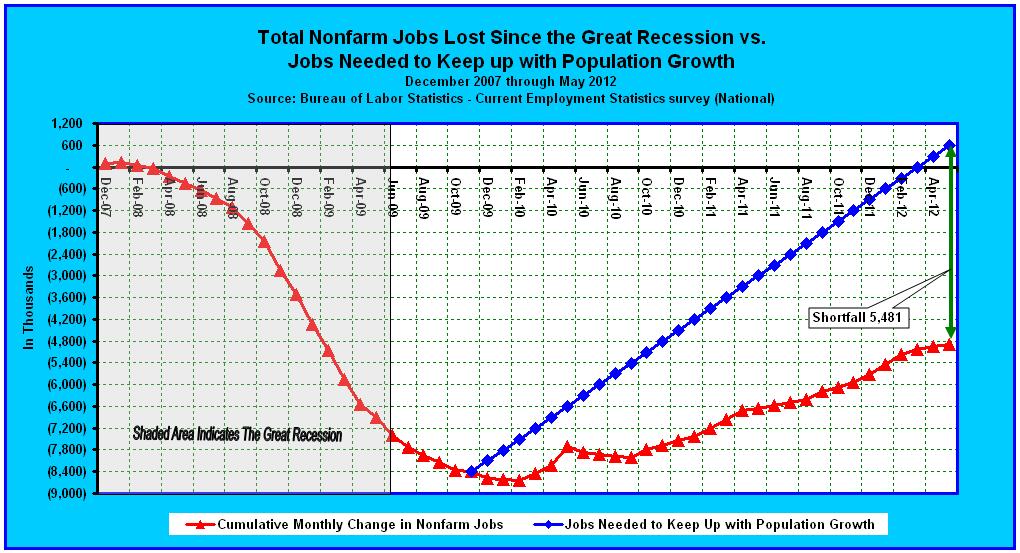
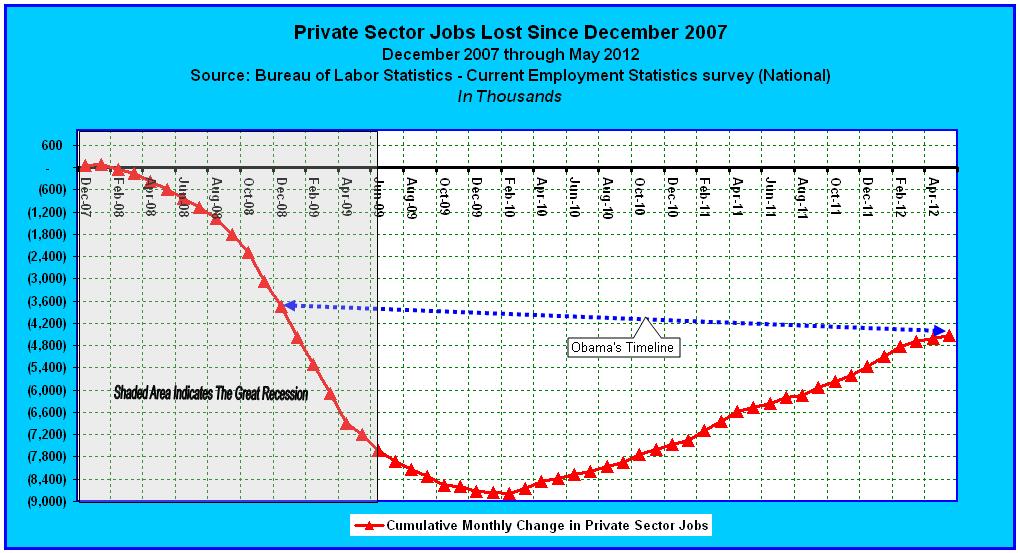
So using Krugman’s 300,000 jobs per month benchmark beginning in December 2009, I have created the following chart showing where we are today (in red), versus where we would be if we were truly keeping pace with population growth and making up for the jobs lost due to the recession (in blue). As you can see, we are currently more than 5.4 million jobs short of where we need to be.

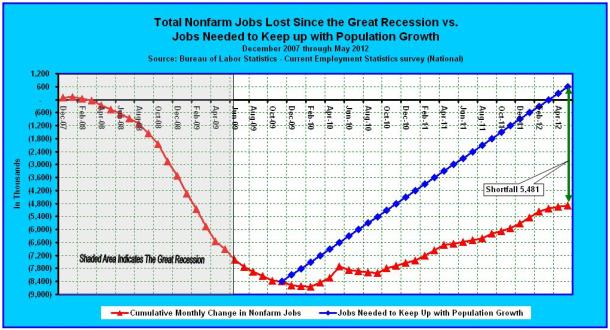
The Great Recession officially ended in June of 2009 (a fact that many seem to gloss over), and as of November 30, 2009 it had consumed 8,403,000 jobs. A total of 3,514,000 had already been lost when President Bush handed the job off to Barack Obama, but an additional 4,889,000 jobs were lost during Obama’s first 11 months. It was at this point that Paul Krugman set forth this reasonable benchmark. We have needed to create 300,000 jobs per month, since December 2009, to keep up with population growth, and to recover the jobs lost up to that point. However, where we find ourselves today is 5,481,000 jobs short of the mark.

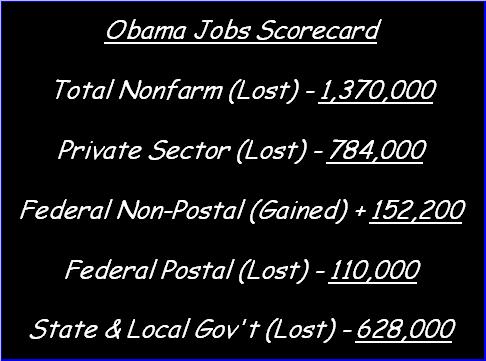
Yet, it was on June 8, 2012 when Barack Obama declared, “We’ve created 4.3 million new jobs over the last 27 months, over 800,000 just this year alone. The private sector is doing fine.” However, what he was talking about was the number private sector jobs recovered since March 2010. What he conveniently forgot to mention is the fact that we also lost 5,135,000 Nonfarm jobs during his first 14 months in office. What about that Mr. President? In fact, had he bothered to include the number of public sector, or government jobs, his statement would have been more accurately stated as follows: ‘We’ve recovered 3,765,000 Nonfarm jobs over the last 27 months, but we lost 5,135,000 during my first 14 months in addition to the 3,514,000 lost under President Bush, so we have a long, long way to go.’

Yes it’s true, we have lost 1,370,000 jobs since Barack Obama was sworn into office, and that’s on top of the 3,514,000 jobs lost from the time the recession began until President Bush handed the keys to Mr. Obama. But the bad news is that not only have we suffered the loss of 4,884,000 Nonfarm jobs since December of 2007, but we must also account for the fact that during the current recovery, we are 5,481,000 jobs short of where we ought to be. At this point we need to not only make up for the 5,481,000 jobs we are short, but we need to do so while creating an additional 300,000 jobs per month by the end of 2014. In other words, if we apply Paul Krugman’s benchmark, we now have 31 months left to create 14,781,000 jobs (9,300,000 + 5,481,000). That means we need to seriously up the pace from last month’s gain of 69,000 jobs to 476,806 jobs per month.

When Barack Obama stood before a teleprompter this month, and gloated about how well his policies have done over the last 27 months of his 41-month term, he wasn’t being honest with the American people. His dishonesty regarding the economy, among other things, is why he deserves to lose this election by a landslide.

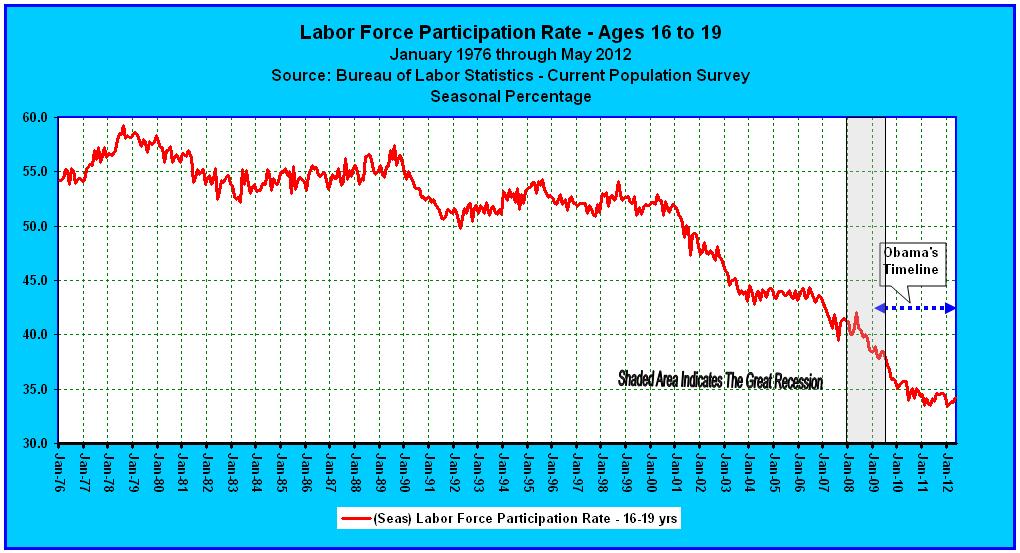
Labor Force Participation Ages 16 to 19

Like many Americans my age, I started working at the age of 16. Although my first job was only a part-time summer job, it was my first, and thus the beginning of my personal quest for the American Dream. My dream at the time was to open a savings account, buy a car (or at least pitch in on the gas), buy my own food and clothing, gain a sense of independence, and learn to be personally responsible.

There are kids who were 12 years old when the recession commenced, who are now 16 and looking forward to their first summer job, but if they can’t find work, they will miss out on some valuable lessons in the quest for the American Dream. There are others who are now 20 years of age who couldn’t find work four and a half years ago, and are still looking today. And there are yet others who were just starting college when the recession hit. We learned this month, that among recent college graduates, 53 percent find themselves either unemployed or underemployed. The dream is fading.

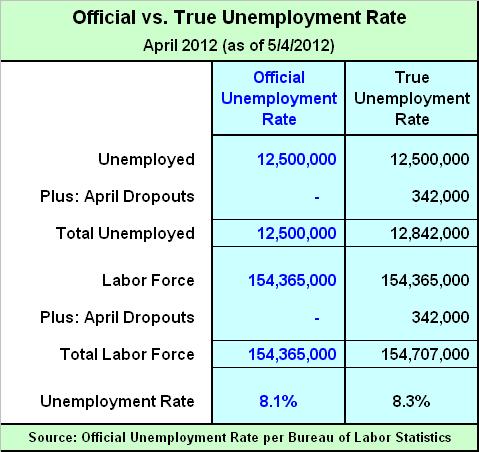
The Labor Force Participation Rate measures the Labor Force as a percentage of the Civilian Noninstitutional Population. According to the Bureau of Labor Statistics, Table A-1, the labor force participation rate for 16 to 19 year olds averaged 54.5% in 1976, when I was 16 years old (see chart above). It stood at 41.5% prior to the recession, but had declined to 38.5% by the time Barack Obama was sworn in. It has since continued in decline to an all time low of 34.2% as of May 31, 2012. So when I was 16, a young person had about a 50/50 shot at finding a job, but for today’s youth the chances are more like 30 out of 100.

The American Dream appears to be fading into the sunset, but according to Barack Obama, the private sector is doing fine. Apparently the economy is doing well enough in his eyes that last Friday was a prefect time for him to singlehandedly grant amnesty to the children of those who have crossed our borders illegally. Oh, give me a break! How does Obama get away with it? He gets away with it because Democrats let him. You all better wake up. You’re either part of the solution, or part of the problem. If you’re so stuck on a political ideology or party brand, that you can’t see the light of day, then God help you. God help us all. If you’re still on the fence, then what are you waiting for? It’s time for a plan that works, not four more years of lecturing, finger pointing and Constitutional violations.

The bottom line: After three and a half years of Barack Obama, we find ourselves 5,481,000 jobs in the hole. At this point we must not only make up this shortfall, but must do so while creating an additional 300,000 jobs per month. In other words, if we apply Paul Krugman’s reasonable benchmark, we have 31 months remaining to create 14,781,000 jobs (9,300,000 + 5,481,000). That means we need to seriously up the pace from last month’s anemic 69,000 jobs to 476,806 jobs per month. But that’s not going to happen until Barack Obama is sent back to Chicago.

Continued from…

Obama Jobs Scorecard, Part 2 : Beyond the Private Sector

Obama Jobs Scorecard, Part 1 : The Private Sector

Data:

Spreadsheets

Obama Jobs Scorecard, Part 2 : Beyond the Private Sector

“He might as well have said that his stimulus plan would provide a temporary fix and a temporary economic recovery, which may have to be repeated over and over again to provide the impression that we are getting somewhere, even if we are really just going broke.”

* By: Larry Walker, Jr. *

The Great Recession lasted for a total of 19 months, beginning in December 2007 and ending in June 2009. So the U.S. economy has technically been in a state of recovery for exactly three years. Yet, other than the federal government, which has realized a net gain of 234,300 non-postal employees, since the recession began, the rest of the economy is worse off today than it was on the day Barack Obama was sworn in.

We addressed the Private Sector in Part 1. Today we’ll examine Total Nonfarm Employment, which includes the Private Sector, the Federal government, and State & Local governments, in order to assess our economic progress, since Barack Obama promised to deliver “a new foundation for our lasting economic growth and prosperity”.

Government Sector

The chart below summarizes the Government employment situation since the start of the Great Recession. The figures come from the Bureau of Labor Statistics, Table B-1 – Establishment Data. The main highlights are outlined below the chart.

  1. The number of Federal government employees has increased by +75,000 from December 2007 through May of 2012. The federal government is the only sector of the economy with a net employment gain since the recession began. (Note: The huge spike represents temporary hiring by the U.S. Census Bureau.)

    1. Federal jobs grew by +33,000 during the last 13 months of President Bush’s term.

    1. Federal jobs have grown by an additional +42,000 during Barack Obama’s 41-month term.

    1. Non-postal workers increased by +234,300 [+82,100 during Bush’s last 13 months, and +152,200 during Obama’s 41-month term to-date].

    1. Postal workers decreased by -158,500 [-48,500 during Bush’s last 13 months, and -110,000 during Obama’s first 41 months].

  1. The number of State government employees has declined by -64,000 since December of 2007.

    1. State government jobs actually grew by +52,000 during the last 13 months of President Bush’s term.

    1. State government jobs have declined by -116,000 during Obama’s 41-month term to-date.

  1. The number of Local government employees has declined by -376,000 since the start of the Great Recession.

    1. Local government jobs continued to increase by +136,000 during the last 13 months of President Bush’s term.

    1. Local government jobs have since declined by -512,000 under the policies of Barack Obama.

Overall, the Government Sector has suffered a net loss of 365,000 jobs since the start of the Great Recession. But it’s important to note that 221,000 jobs were gained during President Bush’s final 13 months in office, while 586,000 jobs have been lost during Barack Obama’s 41-month term to-date. Digging a little deeper, we find that, since the baton was passed to Obama, 628,000 State and Local government jobs have been lost, while 42,000 Federal jobs were gained. Since government employment did not decline during the 19 months comprising the Great Recession, nor during President Bush’s term, who’s to blame for the decline?

You would think that a decline in the number of State & Local government workers is a good thing, but Barack Obama doesn’t think so. He has thus proffered more government borrowing and spending to fix the alleged problem. But as I pointed out previously, and it’s only common sense, even if the Federal government handed State and Local governments $1.0 trillion to rehire all 628,000 workers, whom they can obviously no longer afford, they will find themselves dumbfounded when the taxpayer funded handout expires.

Thus far, all of Barack Obama’s economic proposals have been temporary fixes, one after another. But the barrage of temporary measures hardly lines up with his 2009 rhetorical promise, that his stimulus plan would ‘lay a new foundation for our lasting economic growth and prosperity’. It’s been three and a half years, and he still doesn’t seem to understand that government stimulus is by its very definition, temporary. He might as well have said that his stimulus plan would provide a temporary fix and a temporary economic recovery, which may have to be repeated over and over again to provide the impression that we are getting somewhere, even if we are really just going broke.

Total Nonfarm Jobs

In Part 1, we discovered that a total of 3,735,000 Private Sector jobs were lost during the first 13 months of the Great Recession, and that an additional 784,000 have been lost since Barack Obama promised that his stimulus plan would, save or create more than 3.5 million jobs by January of 2011’. But now, as we factor in the number of government sector jobs gained or lost since the recession began, we discover the following facts.

  1. Total Nonfarm jobs declined by 3,514,000 during the last 13 months of President Bush’s term.

  2. Total Nonfarm jobs have declined by an additional 1,370,000 during Barack Obama’s 41-month term to-date.

Overall, the U.S. economy has lost a total of 4,884,000 nonfarm jobs since December of 2007. Among them, 1,370,000 have been lost since Barack Obama was sworn into office. So his claim, that we have created 4.3 million jobs over the last 27 months, is wishful thinking. In reality, we lost 5,135,000 nonfarm jobs during his first 14 months in office. Do the math. The facts speak for themselves. And although the Federal government has gained 234,300 new non-postal workers, 152,200 of which are attributable to Mr. Obama, we haven’t created a single net job in the last 54 months. The chart above summarizes where we are statically, but as we shall see, the real employment situation is far worse.

That’s the end of Part 2, but it’s still not the end of the story. In Part 3 we’ll discuss how the increase in the Working-Age Population, since December 2007, in conjunction with a decline in the Labor Force Participation Rate, has made the real employment situation far worse than it appears, placing the American Dream in jeopardy.

To be continued… Obama Jobs Scorecard, Part 3 : The American Dream

Continued from… Obama Jobs Scorecard, Part 1 : The Private Sector

Obama Jobs Scorecard, Part 1 : The Private Sector

According to Barack Obama, “We’ve created 4.3 million new jobs over the last 27 months, over 800,000 just this year alone. The private sector is doing fine.” But what he failed to mention is what any American paying attention already knows, that we lost 5.0 million jobs during the first 14 months of his 41-month term.

* By: Larry Walker, Jr. *

Using simple math, it doesn’t take much for any American to figure out that Mr. Obama has been in office for a total of 41 months. Curiosity leads us to believe that there must be some reason Mr. Obama isn’t saying anything about his first 14 months in office. So here’s what we found. By the time Mr. Obama reached the White House, the private sector had already lost 3.7 million jobs to the Great Recession. Then between January of 2009 and February of 2010, his first 14 months in office, another 5.0 million jobs were lost. And finally, over the last 27 months, 4.3 million jobs were either created or saved. Once again simple math leads us to the conclusion that the private sector is worse off today than before Mr. Obama was sworn in, by roughly 700,000 jobs.

Over George W. Bush’s eight-year term, the economy went through two recessions. The first was much shorter than the second, lasting only nine months, from March of 2001 to November of 2001. But the Great Recession lasted for a period of 19 months, commencing in December of 2007 and not ending until June of 2009, six months into Mr. Obama’s term. However, in the month after the Great Recession began, the number of private sector jobs reached an all-time record high of 115,647,000. In fact, when we summed together all private sector employment gains and losses during Mr. Bush’s time in office, it resulted in a net gain of 3,970,000 jobs through January of 2008. But once the recession heated up, from its beginning until the baton was passed to Barack Obama in January of 2009, a total of 3,735,000 of this net gain had been wiped out. As a result, the number of net jobs gained during the Bush presidency was a paltry 147,000 (see chart above, and table below).

Obama’s First 14 Months

In January of 2009, Barack Obama stepped in to rescue us from the disaster of 2008. His stimulus plan was passed by both houses of Congress on February 14, 2009. At the time, Mr. Obama delivered the following statement. “Congress has passed my economic recovery plan – an ambitious plan at a time we badly need it. It will save or create more than 3.5 million jobs over the next two years, ignite spending by business and consumers alike, and lay a new foundation for our lasting economic growth and prosperity. But the promises he made on that day would soon come back to bite him.

Obama’s economic team calculated that without the stimulus plan, the economy would lose another 1,613,000 jobs over the ensuing two-year period. But with passage of the stimulus bill, they claimed that not only would those 1,613,000 jobs be saved, but an additional 1,887,000 would be created, all by January of 2011. But as you can see in the table below, Mr. Obama’s economic team was way off the mark. By February of 2010, just one year later, an additional 5,051,000 private sector jobs were lost. This brought the total number of jobs lost from the beginning of the Great Recession to 8,786,000. Fortunately, this turned out to be the end of the decline.

Obama’s Broken Promises

By January of 2011 it was time to tally the results of Mr. Obama’s $831 billion stimulus plan. As the next table reveals, instead of saving 1,613,000 jobs and creating another 1,887,000, from the beginning of his term through January of 2011 the private sector had instead lost a net total of 3,617,000 jobs. This brought the total number of private sector jobs lost since the beginning of the Great Recession to 7,352,000.

Since the recession had already wiped out 3,735,000 private sector jobs before Mr. Obama came along, if his plan had worked as promised, then the number of jobs lost to the recession should have been reduced to 1,848,000 by January of 2011. But instead this number rose to 7,352,000. In other words, if 1,613,000 jobs were expected to be lost and saved over his first 25 months, then there should not have been any losses at all. And since we were already 3,735,000 jobs in the red before Mr. Obama’s time, if the private sector had created 1.887,000 jobs as promised, then by his 25th month we should have only been off target by 1,848,000 jobs (3,735,000 minus 1,887,000). Thus, the stimulus plan failed miserably. When Barack Obama was sworn in, he inherited an economy that was 3,735,000 jobs in the hole, but after two years of his policies, and $831 billion tax dollars squandered on his stimulus plan, the private sector lost an additional 3,617,000 jobs.

Are we there yet?

Skipping ahead to May of 2012, we find that since the time of Mr. Obama’s inauguration, the private sector has lost a total of 784,000 private sector jobs, for an average loss of 19,122 jobs per month. This is in addition to the 3,735,000 lost under Mr. Bush, for a cumulative loss of 4,519,000 jobs since the beginning of the Great Recession (see table below). In other words, the private sector is worse off today than it was on the day Barack Obama was sworn into office. And if you will, not only is the private sector worse off than it was three years and five months ago, the Federal government has taken on an additional $5.3 trillion in debt just to get us where we are – nowhere.

The total number of private sector jobs lost, since the beginning of the Great Recession, is shown graphically in the chart below. In spite of his repetitious rhetoric, and no matter how many times he boasts that his policies have “created 4.3 million private sector jobs over the last 27 months,” the truth is that not one private sector job has been created since the beginning of Barack Obama’s 41-month term.

The Bottom Line: No one likes to discuss Mr. Obama’s initial 14 months in office, but it will nevertheless go down in history as a part of his record. The truth is that over his first 14 months the private sector lost 5,051,000 jobs. Then during his last 27 months it recovered 4,267,000 of the jobs lost during his first 14 months. So it was only after suffering far worse job losses under the influence of Mr. Obama than we started with, that the private sector was able to recover 4,267,000 of the 5,051,000 jobs lost during his 41-month term. So where is the private sector today? We are still down by the same 3,735,000 jobs lost to the Great Recession before Mr. Obama arrived, plus an additional 784,000 lost during his 41-month term to-date. Yet, Mr. Obama seems to think that the private sector is doing fine, and that for some reason he deserves a second shot. Sorry pal, but we don’t have another $5.3 trillion to throw away.

That’s the end of Part 1, but it’s not the end of the story. In Part 2 we’ll tack on the total number of Government sector jobs, Federal, State and Local, lost over Mr. Obama’s 41-month term. Then we’ll discuss how the 8.2 million person increase in the Working-Age Population, during Mr. Obama’s term, has made the real employment situation far worse than it appears to a casual observer.

Note: Some economists and pundits will attribute the 839,000 jobs lost in January of 2009, Mr. Obama’s first month in office, to Mr. Bush. If you insist on doing so, then that would mean that the total number of private sector jobs gained over Mr. Obama’s 40-month term would be 55,000 (i.e. 839,000 minus 784,000). However, the number of jobs lost since the beginning of the Great Recession is unchanged, at 4,519,000. But before you start boasting about how Barack Obama added 55,000 private sector jobs over his 40-month term, you might want to consider whether a job creation record averaging just 1,375 jobs per month is worth the effort.

To be continued… Obama Jobs Scorecard, Part 2 : Beyond the Private Sector

The Private Sector is NOT Doing Fine | How’s the Federal Government Doing?

* By: Larry Walker, Jr. *

“The Private Sector is doing fine.” ~ Barack Obama *

A couple days ago, Joe Weisenthal wrote an article, inappropriately entitled, “Here’s What’s Really Happened to the Private Sector Under Obama”, in which he sought to prove why Mr. Obama will be reelected. His premise, like Obama’s, is that the Private Sector is doing fine, but State and Local governments aren’t. There was no mention at all of how the Federal government, the part of the economy Mr. Obama actually influences, is doing (see the chart above). However, what Mr. Weisenthal actually did was highlight the main reasons why Mr. Obama should not be reelected, and should lose by a landslide in November. I hate to burst Mr. Weisenthal’s bubble, but he’s in La-La Land if he thinks his 24 chart presentation will convince even Mr. Obama to defend his own senseless remark.

First of all, Mr. Weisenthal’s article was inappropriately titled because by definition, the “Private Sector” is not “under Obama”, as he so implies. To the contrary, the only part of the economy Mr. Obama presides over is the Federal government, whose $16 trillion debt, $5.3 trillion of which has been added by Obama himself, actually imposes a drag on the private economy. Yet, Mr. Weisenthal supports Mr. Obama’s plea for more Federal borrowing, to be expended at the State and Local level. Secondly, Mr. Weisenthal doesn’t provide any benchmarks. It’s as if he’s comparing the pre-2010 Obama to the post-2009 Obama. That’s all well and good, but if this were baseball, Mr. Obama would be heading back to the Minor Leagues (and so he is).

Here’s a brief summary of Mr. Weisenthal’s main points (in bold type) and my comments. You may view his 24-chart catastrophe here.

  1. ‘Corporate profits after tax are higher than ever.’ – I concur. But this is primarily due to corporate austerity, which has nothing at all to do with Mr. Obama. Although some corporations have been able to increase sales, most all of them have actually improved profitability through reductions in labor and other operating costs. We call this productivity, which is something Mr. Obama could learn from, but not something he practices within his sphere of influence.

  2. Rental Income is higher than ever. – I agree. But, the fact that more than 3.3 million families lost their homes since September of 2008, and are now forced to rent, is hardly anything to boast about. Could there be any other reason for the 125% increase in rental income since the recession began, such as some program implemented by Mr. Obama? The claim that rental income has reached a new record, under the policies of Barack Obama, is more of an admission of failure than anything else.

  3. ‘Gross private domestic investment is coming back nicely.’ – If you consider a rebound to 1999 levels a nice comeback, that’s all fine and well, but I think it’s rather pathetic. By the way, this particular chart has actually moved sideways and to the right since 1999, not upwards. So far in 2012, it looks like most of what should go towards gross private domestic investment is actually being invested into U.S. Treasury’s. After all, someone has to buy all of the newly created Federal debt, and the Federal Reserve appears to be closed for business, at least for the time being.

  4. ‘The private sector has been adding jobs steadily since the end of Obama’s first year, and today there are more private sector jobs than there were before Obama took office.’ – Did he say, ‘since the end of his first year’? Of course no good Democrat should ever discuss Obama’s first year in office. It’s as if he took over the reigns in January of 2010, instead of 2009. In reality, the Private Sector lost a total of 5,051,000 jobs between January of 2009 and February of 2010, before things started to turn around. Even still, the Private Sector has only gained 55,000 jobs over the last three years and four months (not including the 839,000 jobs lost in January of 2009). This represents an annual growth rate of just 0.015%, and a total growth rate of a mere 0.050%.

    Meanwhile, the Working Age Population increased by more than 8.2 million over the same period. So let’s see, that’s 55,000 private sector jobs created since Obama took office, for 12.2 million unemployed workers (4.0 million who had already lost their jobs before Obama took office, and another 8.2 million who reached working age during his term). That’s gotta be a record alright, but it’s not exactly the kind of record either Mr. Weisenthal, or Mr. Obama should be ginning up.

  5. ‘It would be great if the [Private] Sector were stronger, but things are going up and to the right in these charts.’ – Yes, and things are going up and to the right in some other charts as well. For example, Federal budget deficits (shown below) are far outpacing any of the statistics above. The fact that a chart is moving upwards and to the right doesn’t mean anything on its own merits. The following questions come to mind. Is this good or bad? What’s the trend? What’s the growth rate? Is it keeping pace with population growth? How is its performance against other benchmarks? Comparing the last two years and five months of Obama to his first year in office, and then drawing conclusions, is like saying that a baseball player with a batting average of .000 in his first year and who is now batting .00015 has improved. Yeah, he’s improved alright, but he won’t be playing in the Majors next year.

  6. ‘Total government employment is far below where it was when Obama started office.’ – This is true, and it’s actually a good thing. Who can afford to pay for more public sector workers when more than 23 million Americans are either unemployed or underemployed? Mr. Weisenthal and Mr. Obama seem to think that more State and Local government hiring will solve our unemployment problem. What they really mean is that the Federal government should take more money from a shrunken private sector labor force to pay others. What planet have they been living on? Apparently neither one of them received the memo issued in November of 2010.

  7. ‘Why is employment going down? Because state and local government spending growth has hit its lowest level ever.’ – The first part of this statement is false; the second part is true. To say that the decline in State and Local government spending is causing the decline in employment may fire the emotions of a few State and Local government workers, but it’s simply untrue. State governments employed a record 5,198,000 workers in January of 2009, versus 5,073,000 today. Local governments employed a record 14,588,000 in January of 2009, versus 14,077,000 today. So State and Local government employment is only off the mark by 636,000 from an all time high in January of 2009. If all 636,000 workers were rehired tomorrow, how would that solve the problem for the 23 million Americans who are either unemployed or underemployed?

    Although it’s true that State and Local government spending has declined, the reason is that revenues have plummeted. Unlike the Federal government, State and Local governments can’t spend money they don’t have. Nor should they borrow what they can’t repay. The decline in revenues is due to the downturn in real estate values, high unemployment, and the need to cover unfunded pension liabilities. With legal requirements to balance their budgets and an inability to print their own currencies, State and Local governments are prohibited from implementing the disastrous borrow-and-spend policies of Washington, DC.

  8. During the crisis, the state & local pain was mitigated by aid from the Federal Government, but that has since dropped off dramatically. – He’s referring to the part of Obama’s $831 billion Stimulus Program that went to State and Local governments in 2009/2010. Remember that? The problem is that it didn’t work then, and it won’t work now. The reason it didn’t work the first time is because it’s not the Federal government’s job to tell State and Local governments what to do. The Federal government is not in charge of State and Local budgets and thus cannot mandate more hiring.

    State and Local governments legislate according to the desire of their residents; they don’t take orders from Washington. State and Local government officials actually have to live under the policies they implement. They are in-touch with their constituents, while Mr. Obama seems to be completely out-of-touch with most of America. Even if the Federal government handed State and Local governments another $1.0 trillion to hire more workers, how would they pay those same workers in subsequent years? And if they have to pay the money back as well, how will they be able to pay the additional workers while repaying the loans? Ideas that make sense to a desperate reelection campaign are not always practical in the real world, or in the best interests of anyone other than the candidate. Think about it.

Monetizing the Debt

Mr. Obama presides over the Federal government, whose $16 trillion national debt imposes a drag on the Private Sector. For example, in 2011 the Federal Reserve monetized 77% of the Federal deficit (see chart below). By the way, that’s the opposite of what it said it would do. Eventually the Fed will have to reduce its Treasury holdings, and as you can see, the last time it did so the economy went straight into recession. Maybe the Fed can afford to sit on piles and piles of low interest Federal debt forever, but that doesn’t mean everyone else can, or will. The question Mr. Weisenthal ought to be asking himself is where will the Federal government get the money to repurchase this debt? It will ultimately come out of the Private Sector, through higher taxes, fees, and fines. The prospects for additional Federal borrowing are growing slim.

Private Sector Employment Benchmarks

Mr. Weisenthal’s charts don’t provide any benchmarks, so I will. Assuming that Private Sector Employment should grow at the same rate as the working age population, approximately 1.0% annually, the chart below compares actual Private Sector jobs growth to a 1.0% benchmark, beginning with the terms of the last 5 presidents.

  • By the end of Ronald Reagan’s first term, Private Sector Employment beat the benchmark by 2,088,000 jobs. He was reelected based on his pro-business policies.

  • By the end of Reagan’s second term, Private Sector Employment had topped the benchmark by 8,248,000 jobs.

  • By the end of George H.W. Bush’s only term, Private Sector Employment fell behind the benchmark by 2,466,000 jobs.

  • By the end of Bill Clinton’s first term, Private Sector Employment beat the benchmark by 6,901,000 jobs. He was reelected based on small government, pro-business policies.

  • By the end of Clinton’s second term, Private Sector Employment had topped the benchmark by 13,291,000 jobs.

  • By the end of George W. Bush’s first term, Private Sector Employment had fallen behind the benchmark by 5,562,000 jobs. He was reelected based upon his strong defense and anti-terrorism policies, not for his economic record. Were it not for the War on Terror, Mr. Bush would have lost his reelection bid.

  • By the end of W’s second term, Private Sector Employment had fallen behind the benchmark by 9,100,000 jobs.

  • After three years and five month’s of Barack Obama, Private Sector Employment has fallen behind the benchmark by 3,801,000 jobs. Short of finding another reason, such as convincing Americans that the killing of thousands of innocent civilians in drone attacks is important to their security, Obama’s anti-business policies should make this his final term.

Federal Government Employment Benchmarks

Who wants more Federal workers? Instead of telling State and Local governments what to do, Barack Obama should spend some time figuring out how to shed the 29,000 Federal positions added under his administration. Assuming that Federal Government Employment should grow at 0.0% or less, the chart below compares actual Federal government jobs growth to a 0.0% benchmark, beginning with the terms of the last 5 presidents.

  • By the end of Ronald Reagan’s first term, Federal Employment exceeded the benchmark by 3,000 jobs.

  • By the end of Reagan’s second term, Federal Employment exceeded the benchmark by 195,000 jobs.

  • By the end of George H.W. Bush’s only term, Federal Employment dropped below the benchmark by 57,000 jobs.

  • By the end of Bill Clinton’s first term, Federal Employment dropped below the benchmark by 253,000 jobs.

  • By the end of Clinton’s second term, Federal Employment was below the benchmark by 347,000 jobs.

  • By the end of George W. Bush’s first term, Federal Employment dropped below the benchmark by 25,000 jobs.

  • By the end of W’s second term, Federal Employment exceeded the benchmark by 24,000 jobs.

  • After three years and five month’s of Barack Obama, Federal Employment has exceeded the benchmark by 29,000 jobs.

State Government Employment Benchmarks

Not that the Federal government has any control, but assuming that State Government Employment should grow at the same rate as the working age population, approximately 1.0% annually, the chart below compares actual State government jobs growth to a 1.0% benchmark, beginning with the terms of the last 5 presidents.

  • By the end of Ronald Reagan’s first term, State Government Employment dropped below the benchmark by 5,000 jobs.

  • By the end of Reagan’s second term, State Government Employment exceeded the benchmark by 183,000 jobs.

  • By the end of George H.W. Bush’s only term, State Government Employment exceeded the benchmark by 149,000 jobs.

  • By the end of Bill Clinton’s first term, State Government Employment dropped below the benchmark by 56,000 jobs.

  • By the end of Clinton’s second term, State Government Employment was below the benchmark by 9,000 jobs.

  • By the end of George W. Bush’s first term, State Government Employment dropped below the benchmark by 6,000 jobs.

  • By the end of W’s second term, State Government Employment was below the benchmark by 16,000 jobs.

  • After three years and five month’s of Barack Obama, State Government Employment has fallen behind the benchmark by 306,000 jobs.

Local Government Employment Benchmarks

The Federal government has no jurisdiction over Local governments, but assuming that Local Government Employment should grow at the same rate as the working age population, approximately 1.0% annually, the chart below compares actual Local government jobs growth to a 1.0% benchmark, beginning with the terms of the last 5 presidents.

  • By the end of Ronald Reagan’s first term, Local Government Employment dropped below the benchmark by 622,000 jobs.

  • By the end of Reagan’s second term, Local Government Employment was below the benchmark by 118,000 jobs.

  • By the end of George H.W. Bush’s only term, Local Government Employment exceeded the benchmark by 416,000 jobs.

  • By the end of Bill Clinton’s first term, Local Government Employment exceeded the benchmark by 334,000 jobs

  • By the end of Clinton’s second term, Local Government Employment was above the benchmark by 943,000 jobs.

  • By the end of George W. Bush’s first term, Local Government Employment exceeded the benchmark by 151,000 jobs.

  • By the end of W’s second term, Local Government Employment was above the benchmark by 207,000 jobs.

  • After three years and five month’s of Barack Obama, Local Government Employment has fallen behind the benchmark by 1,018,000 jobs. This is certainly not due to any lack of Federal spending.

The bottom line:

If the creation of 55,000 net Private Sector jobs, over 40 months, for 23 million unemployed or underemployed Americans, is considered “doing fine”, then Mr. Obama’s prospects for a second term, one in which another 8.0 million plus will reach working-age, should be nipped in the bud right now. Mr. Obama had a fair shot and his policies failed. If he is so concerned about State and Local government employment now, then why didn’t he focus his stimulus plan on this sector back in 2009? Instead he placed the emphasis on extending unemployment benefits, which actually exacerbated the problem. And why did he focus so much of his time on passing Obamacare, instead of worrying about how 23 million unemployed and underemployed Americans would be able to afford it? This isn’t Little League. When you’re batting .00015 in the Major’s, the chances of keeping your job are pretty much nonexistent.

If Barack Obama wants to control State and Local government budgets, then perhaps he should be running for Governor, Mayor, State Senator, County Commissioner, or City Councilman. If he wants to take credit for improvements in the Private Sector, then perhaps he should take a shot at running a corporation, in his next career. But if he wanted to continue as President of the United States, he should have paid more attention to the Federal budget while he had the job. There’s an old saying, “If you want a different result, try something different.” So make up your mind today, do you want more insanity, or something different?

References:

Here’s What’s Really Happened To the Private Sector Under Obama

U.S. Government Spending

Data: Spreadsheets

Adventures in Politicking II : No Shot

Repetitious Rhetoric vs. Genuine Policies

* By: Larry Walker, Jr. *

According to Barack Obama, “the President’s job is to make sure everyone has a fair shot.” But as I explained in Part I, the United States Constitution declares that a President’s real job is, “to the best of his/her Ability, to preserve, protect and defend the Constitution of the United States.” Whether or not Mr. Obama has abided by the true standard will soon be revealed, with the Supreme Court’s ruling on Obamacare. However, when judged according to his self-contrived measure, based upon his job performance to-date, Mr. Obama’s policies actually ensure that future generations of Americans will have ‘no shot’.

In my post entitled, “Stimulus: How China Created 22.0 Million Jobs While Obama Squandered 3.3 Million,” I compared the goals of the Chinese government to those of the Obama Administration. The reason Mr. Obama’s stimulus plan fell short wasn’t because the federal government didn’t spend enough; China’s two-year stimulus package cost an estimated $595.4 billion, while the Obama Administration spent more than $830 billion. The main reason the Obama-Plan faltered was because it didn’t raise the bar high enough. You see, the Chinese government set a goal of reaching full employment, while the Obama Administration merely sought to create 3.5 million jobs, by January of 2011. The fact that Mr. Obama set a goal of creating just 3.5 million jobs, at a time when more than 15 million Americans were unemployed, is telling.

Mr. Obama’s employment policies haven’t lived up to his self-contrived ideal of what a President should do. If a President’s job is to “make sure everyone has a fair shot”, then why didn’t Mr. Obama make full employment his objective? Wouldn’t this have been more consistent with a ‘fair shot’, than squandering better than $830 billion to salvage a mere 3.5 million jobs, while leaving 11.5 million people on the sidelines, to make due on unemployment benefits, welfare and food stamps? Although his repeated use of the catchwords “fair shot” may play well in politicking, if he means that everyone should have an opportunity to participate in the economy, then Mr. Obama has failed.

According the U.S. Bureau of Labor Statistics, since December of 2008, a month before his inauguration, the Civilian Labor Force has declined by 261,000 (from 154,626,000 in December of 2008, to 154,365,000 by April of 2012). See chart below.

During the same time-frame, the Working Age Population (Civilian Noninstitutional Population) grew by 7,749,000 (from 235,035,000 in December of 2008, to 242,784,000 by April of 2012). See chart below.

So while the Working Age Population has grown by nearly 8 million, during Mr. Obama’s term, the Labor Force has contracted by 261,000. Is the fact that nearly 8 million newly added Working Age Americans haven’t gotten a shot at participating in the economy, since Mr. Obama took the oath, consistent with his rhetoric? That depends on your definition of the catchphrase, “to make sure everyone has a fair shot”. Is ‘no shot’ synonymous with a ‘fair shot’?

To top it off, the Number of Working Americans (Employment Level) has declined by 1,463,000 during Mr. Obama’s term (from 143,328,000 in December of 2008, to 141,865,000 by April of 2012). See chart below.

Has Mr. Obama learned the lesson and since shifted his policies towards a goal of full employment? Not as far as we know. All we hear from him lately is that everyone should have a fair shot, pay their fair share of taxes, and play by the same rules, as if this hasn’t always been the case.

Aside from repetitious rhetoric, what grand policy is Mr. Obama now promoting to advance his goal of fairness? Will the act of raising taxes on millionaires, and everyone else for that matter, open up new opportunities for the next generation? If so, how does that work? Will offering tax credits to small business owners that hire more workers and pay them higher wages, while simultaneously raising their tax rates, do the trick? Not in my opinion (see Obama’s Economic Fallacy: The Not-To-Do List).

The Bottom Line: Since Mr. Obama believes that his job has been to “make sure everyone has a fair shot”, and since the Labor Force has declined by 261,000, while the Working Age Population has expanded by 7,749,000, and the number of Working Americans has fallen by 1,463,000, all since the beginning of his four-year reign, and since he has taken a pass on making full employment his goal, it may be concluded that what Mr. Obama really means by the expression, a fair shot, is “no shot”. However you slice it, Mr. Obama had his shot, and failed. He has no shot at reelection.

Related:

To Give Americans a “Fair Shot,” Obama Should Stop Violating Our Rights

Adventures in Politicking I : A President’s Job

* By: Larry Walker, Jr. *

“In America the President reigns for four years, and Journalism governs forever and ever.” ~ Oscar Wilde *

According to Barack Obama, the job of the President of the United States is to “make sure everyone has a fair shot.” However, according to Article II (Sections 1 – 3) of the United States Constitution, in which the job of the President is officially and clearly outlined, nowhere do we find such ‘verbage’. Therefore, it is unnecessary to try to figure out who’s included or excluded in ‘everyone’, and how fair a shot must be – before it becomes unfair. What a relief! So what’s the President’s real job?

According to the United States Constitution, a President’s main job is, to the best of his Ability, to preserve, protect and defend the Constitution of the United States. The Executive Power is vested in a President of the United States primarily to act as Commander in Chief of the Military, to Read the opinions of the Principal Officers of each Executive Department, and to Grant Reprieves and Pardons for Offenses against the United States, except in Cases of Impeachment.

The Constitution also grants a President the power, with the Advice and Consent of the Senate, to make Treaties, to appoint Ambassadors, other public Ministers and Consuls, Judges of the Supreme Court, and all Officers of the United States, although the Congress may by law vest the appointment of such inferior Officers in the President alone, or in the Courts, or the Heads of Departments.

The President also has the power to fill up all Vacancies that may happen during the Recess of the Senate, by granting Commissions which shall expire at the End of their next Session.

Thus far, there’s no mention of making sure everyone has a fair shot. Has the current POTUS made enough nominations to to fill the growing number of judicial vacancies? No.

Other than the duties mentioned above, a President is commissioned by the Constitution to, from time to time, give to the Congress information on the State of the Union, and recommend to their Consideration such Measures as he may judge necessary and expedient.

I believe our forefathers meant that a President should give Congress the actual state of the Union, not just the part that improves his chances for reelection. And by making recommendations to Congress, I don’t think they meant publicly browbeating and demonizing those who might disagree.

The President may also, on extraordinary Occasions, convene both or either Houses of Congress, and in Case of Disagreement between them, with Respect to the Time of Adjournment, he may adjourn them to such Time as he shall think proper. The President is further directed to receive Ambassadors and other public Ministers. Finally, a President must take care that the Law is faithfully executed, and to Commission all the Officers of the United States.

Well, that’s it. Nothing here about making sure everyone has a fair shot.

Although Article II (Section 3) states that the President shall from time to time recommend for Congressional consideration, such measures as he shall judge necessary and expedient, that’s not the same thing as roaming around the countryside espousing radical, partisan ideals about what he feels is fair and unfair. In fact, some would call Mr. Obama’s attempts to indoctrinate the most radical elements of the public to his personal philosophy, through making repetitious statements regarding his own notion of fairness, instead of listening to the Principal Officers of each Executive Department, and instead of making his recommendations directly to our elected Representatives, as outlined in the Constitution, many of whom express genuine concern over whether such ideals may lead our Nation to the brink of bankruptcy, akin to Treason.

In other words, instead of egging on the most radical members of the public, inciting many to violence, Mr. Obama should be talking with our Congressional Representatives and Senators. The act of advocating to the general public, a policy of raising taxes in the midst of a weak Global economy, based upon nothing more than his own personal beliefs, after having been warned of, and in spite of, the dire consequences which will surely follow, instead of doing his job as clearly outlined in the Constitution, should be treated as a Crime against the United States. This is precisely why Article II (Section 4) adds that the President, Vice President and all civil Officers of the United States, may be removed from Office upon Impeachment for, and Conviction of, Treason, Bribery, or other high Crimes and Misdemeanors.

Conclusion:

The job of the President of the United States is outlined in Article II of the U.S. Constitution. The President’s job is not to lecture the public as Professor in Chief, nor to make sure everyone has a fair shot, whatever that means. And to take it a step further, it really doesn’t matter whether a presidential candidate used to be a college professor, a community organizer, a State senator or Governor, or the Chief Executive Officer of a Private Equity Firm, what matters is whether he or she is capable of comprehending the duties of the Office, as outlined in the Constitution, and has the willingness and ability to carry them out.

The qualifications for being President of the United States are also found in Article II (Section 1). “No person except a natural born Citizen, or a Citizen of the United States, at the time of the Adoption of this Constitution, shall be eligible to the Office of President; neither shall any Person be eligible to that Office who shall not have attained to the Age of thirty-five Years, and been fourteen Years a Resident within the United States.” That’s it.

Is Obama qualified to be President? Is Mitt Romney qualified? Are Ron Paul, Gary Johnson, and Tom Hoefling qualified? Your guess is as good as mine, however, this Election isn’t about qualifications any more than it’s about some eccentric job description pulled out of thin air. This Election is about whether or not Mr. Obama has fulfilled the official job of President, not his make-believe ideal, to the satisfaction of the majority of the American people. It’s about whether we the people want real change, or perhaps just a freaking break. The fact that Mr. Obama has no idea what his job is, after nearly three-and-a-half years of on-the-job training, says a lot.

Related:

Hope and Change on Ice

Reference:

The United States Constitution

Obama’s Economic Fallacy: The Not-To-Do List

Small Business Goals, Rewards and Incentives

* By: Larry Walker, Jr. *

“Contrariwise, if it was so, it might be; and if it were so, it would be; but as it isn’t, it ain’t. That’s logic.” ~ Lewis Carroll *

In his latest weekly address, Mr. Obama outlined a mirage of goals, rewards and incentives which he says Congress ‘must’ act upon immediately. But for the most part, what he proffered are just more of the same tried and failed policies, conjured from the same line of illogical reasoning we’ve heard, time and time again, over the last four years. Therefore, what Mr. Obama coined as a “Congressional To-Do List” should rather be endorsed as the official “Not-To-Do List”. Why? Well, let’s test the logic of just one item on the, so called, ‘To-Do List’.

Mr. Obama said, “Third, Congress should help small business owners by giving them a tax break for hiring more workers and paying them higher wages. Small businesses are the engine of economic growth in this country. We shouldn’t be holding them back – we should be making it easier for them to succeed.”

In order to understand why Mr. Obama’s argument is fallacious, one must understand what an argument is. Very briefly, an argument is an attempt to persuade someone of something, by giving reasons or evidence for accepting a particular conclusion. It consists of one or more premises followed by a conclusion. In a logical argument, the premises support the conclusion. When we place Mr. Obama’s argument in its proper order we arrive at the following:

Premise 1 – Small businesses are the engine of economic growth in this country.

Premise 2 – We (the government) shouldn’t be holding them back – we should be making it easier for them to succeed.

Conclusion – Congress should help small business owners by giving them a tax break for hiring more workers and paying them higher wages.

No one in their right mind would disagree with either premise. Yes, small businesses are the engine of economic growth in the USA. And no, the government shouldn’t be holding us back, but should rather get out of our way, and off of our backs, so that we may succeed. However, the premises Mr. Obama presented do not support his conclusion.

Will the act of offering or failing to offer the reward of tax breaks to small businesses, that hire more workers and pay higher wages, make them any more, or less, the engine of economic growth in America? Will the act of passing additional governmental laws, rules, regulations and loopholes make it any easier for small businesses to succeed?

As a small business owner myself, I can state first hand, that offering my company a reward for hiring more workers and paying them higher wages won’t help my company in the least. That’s because nowhere in my mission statement will you find the stated goals of hiring more workers and paying them higher wages.

How many small business owners do you know that are in business for the purpose of hiring more workers and paying them higher wages? I’m in business to provide a top quality, affordable service, and to hopefully make a profit in the process, not to hire more workers and pay higher wages.

In my world, hiring more workers and paying higher wages are by-products of increased demand. But since demand is still a far cry from where it was in 2007, why would I suddenly alter my goals toward hiring more workers and paying them higher wages? If demand were to suddenly increase, I might be forced to hire more workers and/or offer higher wages, but I would not do so to receive a deficit-financed government reward.

If, and when, I decide to hire another employee, the decision will be solely based on demand. But as long as the economy remains in its present lackadaisical state, if enacted, Mr. Obama’s proposed reward will wind up just like the 17 other so called tax cuts he has offered to small businesses over his failed term – another waste of paper and ink. If anything, what small business owners lack is an incentive to succeed, not more rewards for jumping through narrowly defined governmental hoops.

Goals, Rewards and Incentives

In order to understand how illogical Mr. Obama’s proposal is, one must have an understanding of goals, rewards and incentives. A goal is simply the purpose toward which an endeavor is directed. And while a reward is a positive reinforcement granted after the performance of a desired behavior, an incentive is an expectation of reward, offered in advance, in order to induce action or motivate effort.

Goal: The purpose toward which an endeavor is directed; an objective.

Reward: The return for performance of a desired behavior; positive reinforcement.

Incentive: An expectation of reward that induces action or motivates effort.

In the matter at hand, an incentive would be something offered upfront to motivate small business owners to reach their own goals. But what Mr. Obama has proposed is to reward small business owners after they achieve a government-imposed goal.

According to Mr. Obama, the measure of success for a small business lies in the number of persons it employs. What’s wrong with this theory? The main problem is that it fails to align with the realistic goals of most small businesses. Following is a list of goals for my small business. As you can see, hiring more workers and paying them higher wages isn’t on the list.

  1. Offer top quality services at affordable prices.

  2. Make a profit.

  3. Control costs.

  4. Maintain sufficient demand to remain viable.

  5. Meet all current obligations with current revenue.

  6. Payoff existing debt without incurring more.

  7. Build and maintain a prudent reserve.

  8. Achieve moderate growth, in-line with current resources.

Hiring more workers and paying them higher wages might be Obama’s goal for business owners, but what business has he ever run? Common sense dictates that hiring more workers and paying higher wages are by-products of successful business practices, not primary objectives. It is only when small business owners meet their goals that business activity, hiring and wages increase. So instead of offering a reward for something low on the priority list of small business owners (not even on my list), Congress could do better by offering an incentive to help small businesses reach their true goals. Number one on that list is, indisputably, a reduction of individual income tax rates.

Lower Individual Income Tax Rates

Like me, since most small business owners are taxed at the individual level, lowering individual income tax rates will support small businesses in the following ways:

  1. Helps small businesses keep prices level by not forcing them to raise prices to meet higher income tax obligations.

  2. Enables small companies to maintain the same effective profit margin, in the present unstable economy, without raising prices or slashing expenses.

  3. Makes it easier to control costs without raising prices, or laying-off existing workers.

  4. Helps small companies stay in business in the face of lower demand, which is the by-product of oppressive government taxing and regulatory policies.

  5. Allows small businesses to meet current obligations without incurring additional debt.

  6. Enables small companies to pay down existing debt without incurring more.

  7. Allows small companies to build prudent reserve accounts to meet obligations in the face of future business cycle downturns.

  8. Helps small companies achieve moderate growth in-line with existing resources.

In addition, lowering individual income tax rates will enable increased consumer demand for the products and services offered by small businesses, since a rate cut would apply to everyone across-the-board. Lower income tax rates are therefore a win-win for the economy.

Who asked you anyway?

The only one asking for tax breaks for small businesses that hire more workers and pay them higher wages is Barack Obama. No small business owner that I know has requested any such nonsense. But on the other hand, everyone that I know would benefit from the incentive of lower individual income tax rates. If we can’t agree on this, can we at least agree not to raise individual income tax rates?

Raising tax rates on small business owners on January 1, 2013, which is what’s really on the table, will not help them reach their goals, nor will it achieve Mr. Obama’s fallacious goal. Raising taxes will rather have the opposite effect. Even if the proposed carrot on a stick, tax breaks for those who hire more workers and pay higher wages, is offered, the pending tax hikes will negate that reward, leaving both those who take the bait, and those who don’t in jeopardy.

Arbitrarily hiring more workers and paying higher wages, in a stagnant economy, will force small businesses to raise prices on existing customers, and raising prices, without regard to demand, will have the effect of reducing demand, as customers seek lower cost alternatives. The resulting drop in demand, in the face of higher costs, will lead to further price hikes, in order to meet current obligations. In effect, pursuing the third item on Mr. Obama’s ‘To-Do List’ would land most small businesses – out-of-business – in double-time.

I am frankly sick and tired of all the special interest gimmicks conjured from the illogical mind of an amateur. What Mr. Obama ought to do at this point is simply surrender the keys, and let someone who knows what they’re talking about manage the economy. That’s what I call a logical conclusion.

“Companies are not charitable enterprises: They hire workers to make profits. In the United States, this logic still works. In Europe, it hardly does.” ~ Paul Samuelson

Related:

Picture via: Christ, My Redeemer


Manipulation 401 : U-3 vs Real Unemployment


Another 522,000 left the labor force in April 2012.

April’s Bogus Unemployment Rate

* By: Larry Walker, Jr. *

Now that economists, media pundits, and the Obama administration have weighed in with half-hearted and inaccurate theories respecting April’s decline in the U.S. unemployment rate, it’s time to set the record straight. We learned yesterday, that the official rate declined from 8.2% in March to 8.1% in April, but what’s really beneath the decline? To know, one must have an understanding of how the unemployment rate is calculated, and how to access the appropriate reports. From there it’s just a matter of simple mathematics. After poring through the numbers, I have concluded that the official unemployment rate actually rose to 8.3% in April, while the real unemployment rate ticked up to 11.1%.

According to the U.S. Bureau of Labor Statistics (BLS), as of May 4, 2012, “Nonfarm payroll employment rose by 115,000 in April, and the unemployment rate was little changed at 8.1 percent.” What’s wrong with this pronouncement? The quandary is that nonfarm payroll employment comes from Establishment Data, reported in Table B-1, and has nothing to do with the official unemployment rate. The official unemployment rate is completely derived from Household Data, which is found in Table A-1.

Nonfarm payroll employment and the official unemployment rate are inapposite (one has nothing to do with the other). In fact, if you take a gander at Table A-1, from which the unemployment rate is officially derived, you will notice that the number of employed persons actually declined by 169,000 from March to April of 2012. Does it make sense that establishments reported the creation of 115,000 jobs, while households reported losing 169,000 jobs? Which data set are we to trust? Well, since most of the hoopla surrounds the decline in the unemployment rate, we shall focus on Household Data.

As I outlined in Manipulation 101: The Real Unemployment Rate, the Labor Force is comprised of those who are either Employed or Unemployed, and the Unemployment Rate is calculated by dividing the number of unemployed persons by the size of the labor force, as follows:

[ (A) Total Unemployed / (B) Labor Force = (C) Unemployment Rate ]

Thus, the official unemployment rate of 8.2% in March, as reported by the Bureau of Labor Statistics on April 6, 2012, was calculated as follows:

[ 12,673,000 / 154,707,000 = 8.2% ]

As shown in the table below, at the end of March 2012, 12,673,000 persons were officially unemployed, out of a labor force totaling 154,707,000, equaling an unemployment rate of 8.2%. Got it?

To take it a step further, if 12,673,000 persons were unemployed, out of a labor force of 154,707,000, then it should follow that the remaining 142,034,000 were employed. I found this to be consistent with BLS data and labeled the number of employed as item (D) in the table above. Next, in order to determine whether or not the decline in the unemployment rate is completely bogus, we must take into account some additional statistics from Table A-1, so I included the number of persons “Not in the Labor Force” (E), and the “Civilian Noninstitutional Population” (F). Now we will compare the March statistics to April’s calculation.

The April Employment Situation Summary concluded that a total of 12,500,000 persons were unemployed, out of a labor force totaling 154,365,000, equaling a decline in the official unemployment rate to 8.1%, from 8.2% in March. So what changed?

Comparing the monthly changes in the table below, you will note that from March to April, the number of unemployed persons (A) declined by 173,000. This would be a good thing, if they were all able to find jobs, right? So how many found jobs? Well, none. As you can see, according to Table A-1, the number of employed persons (D) also fell by 169,000. Since the number of employed and unemployed persons both declined, where did they go? As you can see the entire labor force declined by 342,000. Is it a coincidence that 173,000 plus 169,000 equals 342,000? No, it’s not.

The number of unemployed persons declined by 173,000, not because they were able to find work, the BLS merely removed them from the labor force. The BLS also removed an additional 169,000 persons from the labor force, who were considered employed just a month prior. Thus, 169,000 persons were ushered directly from a status of employed in March, to completely out of the labor force by the end of April. Does this raise any eyebrows? Also noteworthy are changes in the number of persons “Not in the Labor Forcewhich increased by 522,000, and the “Civilian Noninstitutional Population” which increased by 180,000. How de we reconcile this?

Reconciliation

The table below summarizes the truth behind the decline in the official unemployment rate.

Here’s what happened.

  1. The number of unemployed persons declined by 173,000 in April.

  2. The number of employed persons declined by 169,000 in April.

  3. The labor force declined by 342,000 in April, which is the sum of #1 plus #2.

  4. The 342,000 persons in #3, who officially dropped out of the labor force in April, were added to those considered “Not in the Labor Force”.

  5. The Civilian Noninstitutional Population (working age population) increased by 180,000 in April, but none entered the labor force.

  6. The number of persons counted as ”Not in Labor Force” increased by 522,000 in April, which is the sum of the 342,000 persons who were previously counted as unemployed (173,000) and employed (169,000), plus the 180,000 new working age persons who were swept under the rug.

Sequitur

To sum it up, in April, 342,000 persons dropped out of the labor force, while another 180,000 new entrants fell by the wayside. In effect, a total of 522,000 persons were removed from the labor force. So what would the official unemployment rate have been had the 342,000 April dropouts been instead left in the labor force and counted as unemployed? The answer is 8.3%, as shown below. Thus, the true unemployment rate ticked up by 1 basis point, from 8.2% in March to 8.3% in April, rather than down by 1 basis point as the BLS reported.

The labor force has historically grown at an annual rate of 1.0% (mirroring population growth), but looking back to December of 2008, it is safe to state that the labor force stopped growing altogether since Obama’s inauguration (see chart below). [Note: The labor force participation rate has likewise declined from 65.8% to 63.6% over the same period, or by 220 basis points.]

Final question: What would the unemployment rate be if the 1.0% per annum shortfall in the labor force, since January of 2009, was restored? Well, since 40 month’s have passed, the labor force should have grown by 3.33% ((1.0% / 12) * 40). And since the labor force stood at 154,626,000 in December of 2008, it should have grown to 159,775,000 by April of 2012, a difference of 5,149,000. Thus, the real unemployment rate is 11.1%, not 8.1%, as shown below.

Are we really moving the right direction? That depends on ones definition of the word “right”. Is manipulating the truth right?

“Anyone who doesn’t take truth seriously in small matters cannot be trusted in large ones either.” ~ Albert Einstein

Data:

Spreadsheets

Fair Shot, Fair Share and a Glass of Algae

* By: Larry Walker, Jr. *

“Lake Erie is facing its worst toxic algae bloom since the 60’s and somehow it is going unnoticed…” ~ JoeOH111 *

According to Mr. Obama, you don’t have a fair shot right now, and it’s all because millionaires aren’t paying enough income tax. If millionaires would just give the federal government its fair share, then you, I, and everyone else would have a fair shot…, and a glass of algae.

What, pray tell, is a fair shot?

The best definition I can surmise is “a lawful chance at odds.” But don’t we all have this already? For example, the odds of winning the recent $640 million Mega Millions jackpot were 1 in 176 million. In order to guarantee a win, one would have had to spend $176 million buying up every combination. So if some nefarious millionaire had purchased all 176 million combinations, would he or she have had an unfair advantage?

Well, perhaps, but what millionaire would be dumb enough to blow $176 million on lottery tickets? What are the odds of that ever happening? The odds of one person buying all 176 million winning combinations, across multiple States, would probably be 1 in (infinity). In other words, a guaranteed win is impossible, at least when it comes to the Mega Millions lottery. But a fair shot is open to anyone who plays the game. “You gotta be in it to win it.”

According to CBS News, one person purchased $2,600 worth of lotto tickets, and another threw down $55, while the more frugal played their usual dollar or two. Did the one who blew $2,600 have an unfair advantage over $55 and $1 players? I will concede that the $2,600 player had an advantage, but I would hesitate to call it unfair. The poor sap simply had more to lose, yet not a dime more to gain. Not one dime. Now let’s flip over to the Mega Trillions Federal Debt Lotto.

Mega Trillions Federal Debt Lotto

If a taxpayer earns $176 million in taxable income and pays $29.9 million in federal taxes (a rate of 17%), while another earns $50,000 and pays $8,500 in taxes (also a rate of 17%), and yet another earns $25,000 and pays $0, does either have an unfair advantage? Since both the millionaire and the $50,000 wage earner pay the exact same tax rate (17%), the non-taxpayer has an advantage. But is it an unfair advantage? I would say so, especially since in the recent past we all pitched in at every level of income. Yet the one paying $29.9 million in taxes has a lot more to lose than both the $8,500 payer, and the non-taxpayer.

But who wins in this crapshoot? With the federal government borrowing and spending hundreds of billions of dollars, in advance, and squandering it to produce test-tube sewage-fed algae biomass for fuel, while Lake Erie and other U.S. lakes are full of “free” blue-green scum, the answer is no one. You’d have to be an idiot to waste hundreds of billions of dollars manufacturing something that’s sitting right in front of your face, wouldn’t you? Hindsight is 20/20, foresight is priceless.

When it comes to the national debt, those who don’t pay federal income taxes make out like bandits, they have nothing to lose. And those who already pay more than their “fair share” (i.e. taxed enough already) have nothing to gain. It’s not the 2% of top earners that worry me, they generally pay their bills on time, but rather the federal government which has already borrowed more than 100% of our entire economy, an amount estimated to reach $16.3 Trillion by September 30th of this year.

Only a depraved leader would have his nose in other peoples finances while ignoring his own debt laden, broken, overspent, and soon to be bankrupt enterprise. The federal government is not the solution to our problems; it’s the $16.3 Trillion in the hole, deadbeat, money squandering, largest debtor-nation in the Universe, leach, which is forever in the way and constantly on our collective back.

The moral of this story: Never confuse motion with action.

In other words, quit giving speeches and fix the problem. No one is going to vote for a tax increase in the middle of an election cycle, no matter how many speeches are enounced and dribbled. Especially not the one proffered, which in the end will barely cover one day’s worth of current deficit spending. No not a one! We don’t have a revenue problem; no, no, no, what we have is a deadbeat, money squandering, and largest debtor-nation in the Universe, ass-backwards, leach of a federal government problem. Get a clue!

Rather than paying more taxes, or spending multi-millions on lottery tickets to become multi-millionaires all over again, our well-to-do brethren would do better by investing in their own casinos, creating jobs and fair shot opportunities for others. And that leads us back to square one all over again: cut taxes, cut spending, and get out of our way and off our backs.

Photo Credit: Lake Erie, Stirred Up | Via: NASA Earth Observatory (March 21, 2012)