The Fiscal Responsibility Cliff

Talk About Crazy Bastards…

– By: Larry Walker, II –

Hiking tax rates now, in advance of the pending 2013 Medicare Tax Increase from 2.9% to 3.8% on those making $200K ($250K if married), the new 3.8% Medicare Tax on Investment Income including capital gains, the 2014 health insurance tax on individuals of $695 to $2,085 (plus inflation) depending on family size, and the 2014 shared responsibility penalty of $2,000 per employee on companies with 50 or more part-time employees (working 30 hours or more), probably isn’t wise. Legislator’s must pare any further tax increases with the hikes already baked in the cake.

Many of the provisions commonly referred to as the Bush Tax Cuts were phased in gradually between 2003 and 2010 culminating in maximum favorability in 2010. Since Congress has already extended these temporary provisions for two years, I would have no problem with returning to the pre-2008 tax law right now (i.e. the laws in effect prior to the Stimulus package which only added to the current morass). I would hesitate to call removing the 2010 concessions and Stimulus subsidies a tax hike, because each were designed to be temporary in nature, not extended ad infinitum. However, if Congress insists on raising income tax rates, then any such increases should be gradual (i.e. phased in over a 7 to 10-year period), not jammed in all at once.

Lawmakers should be careful not to turn a blind eye to what’s already beneath the icing while cooking up the next barrage of tax law changes. In my opinion, the Obama Administration is not qualified to address income tax matters; it lacks mathematical fortitude. Its words are mere noise, good for little more than forefinger exercise in locating the mute button, at least for me. You crazy bastards have already screwed up everything for three years in a row. We really don’t have the time or patience for anymore of this nonsense. You’ve talked enough. It’s time to get off the T.V. shows and do some work. Step one should be a mandatory crash course in income tax law for all legislators and the White House. You really should take a timeout to contemplate the monstrosity you’ve already created before making another move.

References:

Under Obamacare, Medicare Double Taxation Begins in 2013

Obamacare’s Effect on Small Business

Get ready to fill out Obamacare’s individual mandate tax form

IRS issues proposed regs. on 3.8% net investment income tax

Proposed regulations – Net investment tax

Related: #TAXES

From AAA to AA- in Four Years

The New National Curse

– By: Larry Walker, Jr. –

In the year 2009 double-dealing returned to Washington, DC. Shortly after his inauguration, President Barack Obama pledged to cut the nation’s annual budget deficit in half by the end of his first term. At the time, he identified exploding health-care costs as the chief culprit behind rising federal deficits. He warned that the country could not continue its current rate of deficit spending without facing dire economic consequences. He said, “I refuse to leave our children with a debt they cannot repay. … We cannot and will not sustain deficits like these without end. … We cannot simply spend as we please.” Yet within four short years, the USA’s sovereign credit rating has been downgraded three times, from AAA to AA(+) on August 5, 2011, to AA on April 15, 2012, and again to AA(-) on September 14, 2012.

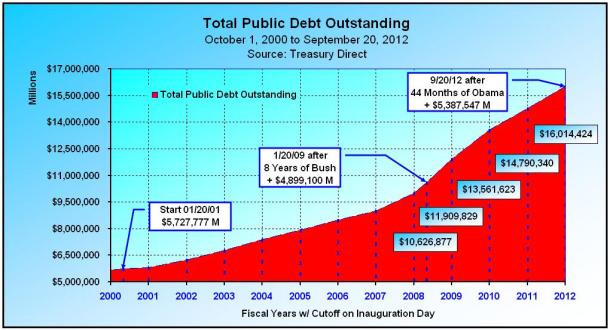
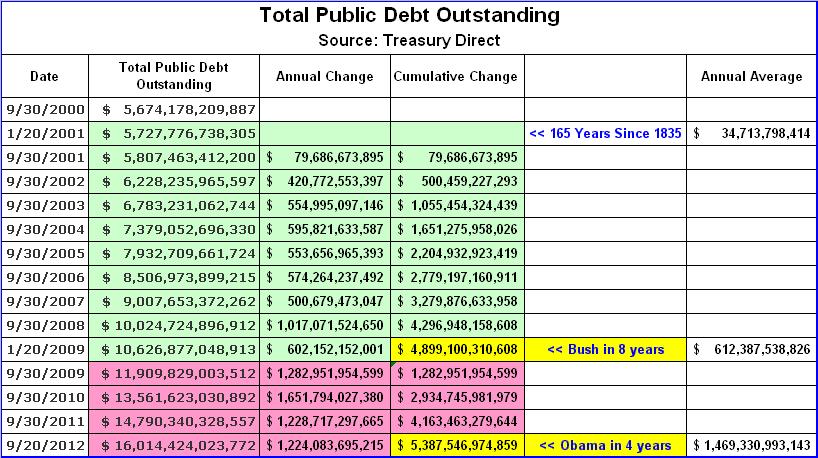
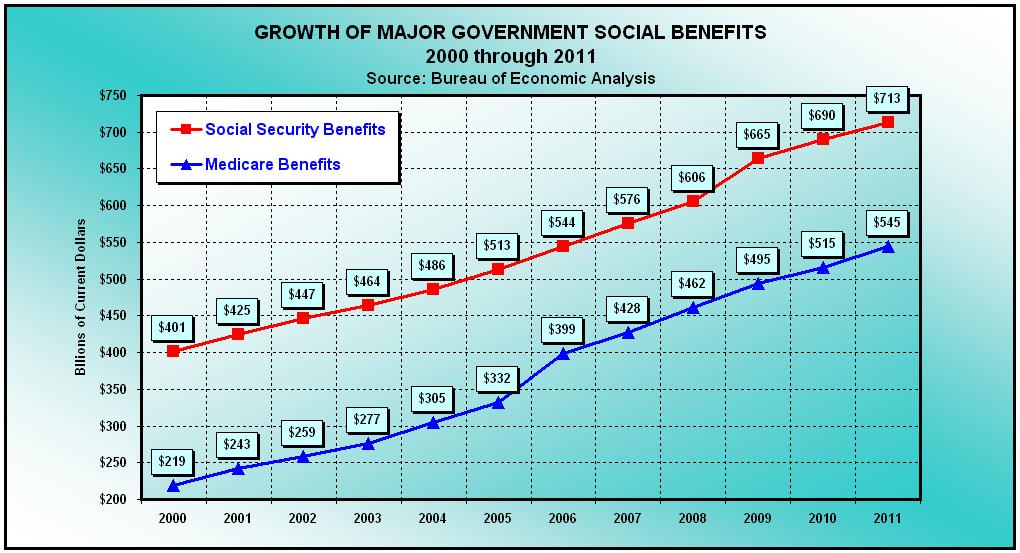
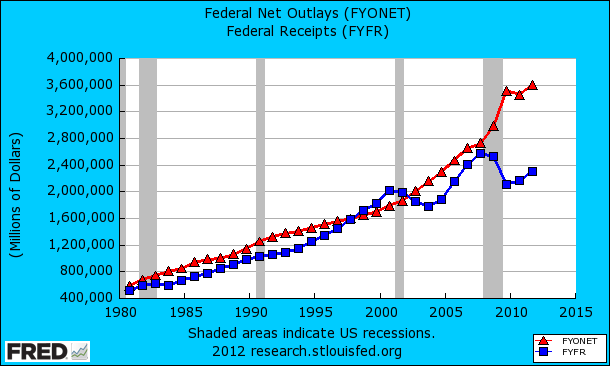
Talk is cheap. By September 20, 2012, after 44 month’s of empty words, health care costs have continued to rise. Having risen by 3.9% in 2010, health care costs are expected to rise by another 7.5% in 2013, or more than three times the projected rates for inflation and economic growth. As if this wasn’t bad enough, the national debt has exploded by $5,387,546,974,859 in the last 44 months, resulting in an average annual increase of $1.5 trillion, versus an average of $612.4 billion during the presidency of George W. Bush (see chart below). And there are still four month’s to count until inauguration day.

National Debt: The National Curse

“I am one of those who do not believe that a national debt is a national blessing, but rather a curse to a republic; inasmuch as it is calculated to raise around the administration a moneyed aristocracy dangerous to the liberties of the country.”Andrew Jackson

On Jan. 8, 1835, all the big political names in Washington gathered to celebrate what Democratic President Andrew Jackson had just accomplished. The national debt had been paid. It was the only time in history when the U.S. was debt free, and it lasted exactly one year. Back then like today, it wasn’t easy for politicians to slash spending — that is until Andrew Jackson came along.

During the election of 1828, Jackson’s opponents referred to him as a “jackass”. Jackson liked the name and used the jackass as a symbol for a while, but it died out. However, it later became the symbol for the Democratic Party when cartoonist Thomas Nast popularized it. But based upon the growth of the national debt over the past 44 months, the symbol no longer fits, or does it?

“For Andrew Jackson, politics was very personal,” says H.W. Brands, an Andrew Jackson biographer at the University of Texas. “He hated not just the federal debt. He hated debt at all.” Before he was president, Jackson was a land speculator in Tennessee. He learned to hate debt when a land deal went bad and left him with massive debt and some worthless paper notes. Ah, so unlike Barack Obama, Andrew Jackson brought some practical business experience to the White House, just like Mitt Romney will.

When Jackson ran for president, he knew his enemy: banks and the national debt. He called it the national curse. People ate it up. In Jackson’s mind, debt was “a moral failing,” Brands says. “And the idea you could somehow acquire stuff through debt almost seemed like black magic.” Yet if you listen closely to today’s Democratic Party, the national debt is no longer its enemy, but rather the anti-debt, fiscally responsible Tea Party.

Andrew Jackson pledged to pay off the debt. In order to do so, he took advantage of a huge real-estate bubble that was raging in the Western U.S. The federal government owned a lot of Western land — so Jackson started selling it off. He was also ruthless on the budget. He blocked every spending bill he could. “He vetoed, for example, programs to build national highways,” Brands says. “He considered these to be unconstitutional in the first place, but bad policy in the second place.” But nowadays, we hear repeatedly from Barack Obama stuff like, “The House should put aside partisan posturing and pass the measure authorizing $109 billion in spending over two years. So much of America needs to be rebuilt right now. We’ve got crumbling roads and bridges…” In other words, forget about the credit downgrade, borrow and spend now, pay later.

When Jackson took office in 1829, the national debt was about $58 million. Six years later, it was paid in full, and the government was running a surplus. This created a new problem: What to do with all that surplus money? So Jackson decided to divide it among the states. By the way, the phrase “the government was running a surplus” doesn’t mean the same thing as Bill Clinton’s four consecutive annual budget surpluses. Although that was a step in the right direction, the national debt was still over $5.7 trillion when he left office.

Andrew Jackson was a stand up guy, he fulfilled his pledge. But unfortunately, the debt would only remain at zero for one year. By January 20, 2001, the national debt had grown to $5,727,776,738,305. From the time Andrew “Jackass” Jackson paid it off, until the inauguration of Republican President George W. Bush, the national debt grew at an annual average of $34.7 billion over the ensuing 165 years.

Forward: To Insolvency

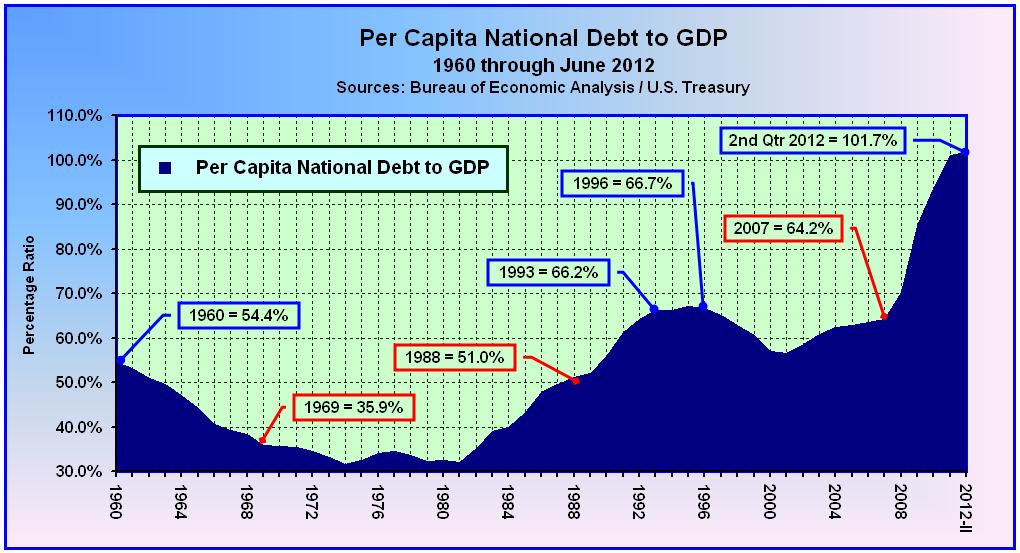
In the year 2000, George W. Bush was elected on a pledge to cut income taxes. By the end of his term, the national debt had grown by another $4.9 trillion — to $10.6 trillion or at an annual average of $612.4 billion over 8 years. Although in retrospect, most of the Republican Party finds his fiscal record detestable, it is notable that Bush never once pledged to pay down the national debt or cut the federal deficit. In fact the federal government was running at a slight surplus at the time of his election, so the federal budget wasn’t an election year issue. Nevertheless, the USA’s sovereign credit rating remained intact at AAA throughout both of his terms, and its debt-to-GDP ratio averaged around 62.4%.

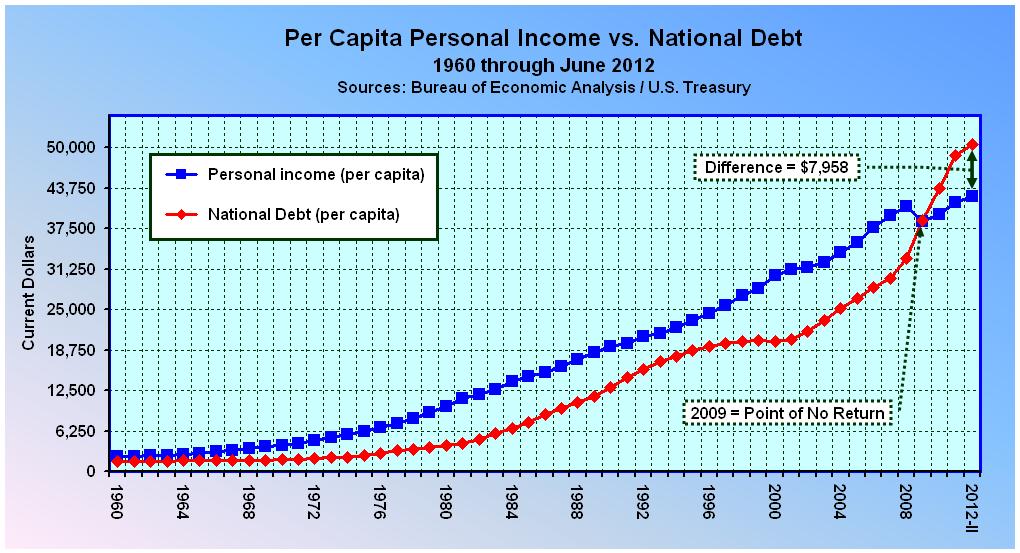
Finally in the year 2008, under the banner of Hope and Change, along came Barack H. Obama, portending to be all things to everybody. After making a solemn promise to cut the federal deficit in half by the end of his first term, many thought he represented the second coming of old Jackass himself. But instead, from the time of his inauguration the national debt has grown by an additional $5.4 trillion, not only exceeding the Bush presidency, but in double-time. That’s a fact! The national debt now stands at just over $16.0 trillion, having grown at an annual average of $1.5 trillion over the last 4 years. To top it off, the U.S. sovereign credit rating has been downgraded three times on his watch, from AAA to AA(+) on August 5, 2011, to AA on April 15, 2012, and again to AA(-) on September 14, 2012. Meanwhile, the U.S. debt-to-GDP ratio has risen to 104% and is projected to reach 110% a year from today.

Conclusion

As Andrew Jackson put it, the national debt is “the national curse.” In the first 165 years after the debt was paid off in 1835, it rose by an average of $34.7 billion per year. And although it would increase by an average of $612.4 billion over the next eight years, during President Bush’s term, that doesn’t excuse President Obama. Besides, how can we hold Bush accountable for something he never pledged to do? Nonetheless, Barack Obama is on the ballot this year, not Bush. And he pledged to cut the deficit in half during his first term, but it has instead doubled. Your word is your bond.

You might be thinking, “So what? We can’t afford to go back to the failed policies of George W. Bush, because that’s what caused health care costs to spiral out of control, and that’s the reason the debt was so high to begin with.” Yeah, like that makes sense. Stop listening to far-left lies and think for yourself. As a consequence of Barack Obama’s shortsightedness, the USA’s sovereign credit rating has been downgraded three times, from AAA to AA(+) on August 5, 2011, to AA on April 15, 2012, and again to AA(-) on September 14, 2012. Another downgrade or two and U.S. backed securities will no longer be suitable for many bond investors. And what happens when there are more sellers of U.S. backed debt than buyers? Interest rates will skyrocket. And what happens when interest rates rise? Everyone’s borrowing costs will increase, as will the USA’s annual budget deficits.

Now it’s election time, and thus time to decide. Who’s to blame for Obama’s improvidence, Bush, the Republican Party, the Tea Party, or perhaps simply Obama himself? Well, allow me to spell out the American way. If you make a pledge and fail to deliver, there’s no one to blame but yourself. Not only did Obama fail to cut the deficit in half by the end of his first term, but the USA’s annual deficits have more than doubled, and its credit reputation has been trashed. Barack Obama has cursed the nation, and now is the time to cut his career short. And here’s my pledge, if we elect Mitt Romney and he screws up, I will personally help to expel the bum four years from now. But just for today, the ‘jackass’ in chief has got to go.

_____________________________________________________________

Addendum: Ratings History

Egan-Jones rating history for United States Government:

  • 9/14/2012 AA to AA(-)

  • 4/15/2012 AA(+) to AA (Negative outlook)

  • 7/16/2011 AAA to AA(+)

Standard & Poor’s rating history for the United States Government:

  • 08/05/2011 AAA to AA(+) (Negative outlook)

_____________________________________________________________

Photo Credit Via: Greetings Jackass

Obama Has Fun With Medicare

Fun with Numbers

Less than 24 hours after Barack Obama’s big convention speech in which he assured us that the American economy has come roaring back and his plans are working perfectly, a new jobs report came out which suggests, ever so subtly, that the president is having Shinola recognition difficulties…

Read the rest at: Hope n’ Change Cartoons

FAIR USE NOTICE: “Hope n’ Change” Cartoons may be freely reposted for non-profit use without additional permission, but must contain the full header, author’s name, and copyright information. Material from this site may not be collected, printed, or sold in any form without specific permission from the author – who may be, for all you know, a bloodsucking parasitic lawyer just aching to file a lawsuit, take your life savings, and leave nothing more than your dried and dessicated carcass like a dead mayfly on a windowsill.

Has Obama’s Loot-and-Plunder Theory Worked?

A 50-Year Retrospective

– By: Larry Walker, Jr. –

“Socialism is a philosophy of failure, the creed of ignorance, and the gospel of envy, its inherent virtue is the equal sharing of misery.” ~ Winston Churchill ::

Discussing his economic policies at a fundraiser in Oakland, California on July 23rd, Barack Obama, told supporters that, “We tried our plan, and it worked.” Yet, by the end of his first year in office, he had only managed to drag America, kicking and screaming, beyond the point of no return, as our National Debt, on a per capita (per person) basis, surpassed per capita Personal Income for the first time in more than 50 years (see chart above). As of June 30, 2012, after nearly four years of disservice to the nation, under the leadership of Barack Obama, every American now owes $7,958 more in federal government debt, on a per capita basis, than their personal income.

Per Capita National Debt to GDP

Equally alarming, as of June 30, 2012, the U.S. National Debt per capita reached a stunning 101.7% of Gross Domestic Product, an increase of 45.1% since the end of 2008. Looking back over the last half-century, no other President of the United States has done more to destroy our standard of living than Barack Obama. Now if that was his goal, then yes – it worked like a charm. However, this temporary condition will soon meet its demise.

Gross Domestic Product (GDP) is the market value of all officially recognized final goods and services produced within the United States. GDP per capita is considered an indicator of our nation’s standard of living. As of June 30, 2012, U.S. GDP per capita was equal to $49,672. The National Debt is the sum of all previously incurred annual federal deficits. Since deficits are financed by government borrowing, either from the public or from itself, the national debt is equal to all government debt outstanding. As of June 30, 2012, the U.S. National Debt per capita was equal to $50,502.

Thus, it may be stated that, as of June 30, 2012, the standard of living of the United States is negative. In other words, when taken as a whole, on a per capita basis, for the first time in more than a half-century, Americans now owe more in federal government debt than we produce. In effect, there isn’t anything left to address the growing mountain of state and local government, personal and business arrearages.

Granted that Barack Obama and a tiny remnant of gullible far-left loyalists have devised numerous excuses as justification for this atrocity, one way of accurately measuring the validity of such subterfuge is to simply compare the ratio of per capita National Debt to GDP over the last half-century. After all, it was Barack Obama who said of supply-side economics, a theory which has been deployed during most of the 1960’s through 2007, “We tried this trickle-down fairy dust before, and guess what — it didn’t work then, it won’t work now… It’s not a plan to lower the deficit…” Well, let us test this hypothesis on a relative basis, and see just how well his loot-and-plunder theory stacks up.

A quick study of the chart above, Per Capita National Debt to GDP: 1960 through June 2012, tells the whole story.

Testing Obama’s Theory

  1. At the end of 1960 per capita National Debt to GDP was equal to 54.4%.

  2. John F. Kennedy’s Tax Reduction Act of 1964 was signed into Law by his successor Lyndon B. Johnson. Under the ensuing era of lower tax rates, by the end of 1981, per capita National Debt to GDP declined all the way to 31.9%.

  3. Ronald W. Reagan’s Economic Recovery Tax Act went into effect in 1982, and even though government spending was higher than he would have liked, by the end of his term in 1988, per capita National Debt to GDP stood at just 51.0%.

  4. In 1993, Bill Clinton signed the Deficit Reduction Act, which turned out to be nothing more than a tax hike. By the end of 1996, per capita National Debt to GDP had increased to 66.7%.

  5. Then in 1997 the Republican-led Congress passed a tax-relief and deficit-reduction bill that was resisted but ultimately signed by President Clinton. One of the things the 1997 bill did was lower the capital gains tax. It was actually the 1997 tax cut, not the 1993 Clinton tax hike, which produced the boom of the 1990’s. By the end of the year 2000, per capita National Debt to GDP declined to 57.0%.

  6. In 2001, George W. Bush signed the Economic Growth and Tax Relief Reconciliation Act. By the end of 2001, per capita National Debt to GDP decreased to 56.5%, and later increased slightly to 58.5% in 2002.

  7. The following year, George W. Bush signed the Jobs and Growth Tax Relief Reconciliation Act of 2003, which provided the tax rates in effect today. By the end of 2007, per capita National Debt to GDP held at just 64.2%.

  8. In 2009, Barack H. Obama signed the American Recovery and Reinvestment Act (ARRA). The primary objective for ARRA was to save and create jobs almost immediately. Secondary objectives were to provide temporary relief programs for those most impacted by the recession and invest in infrastructure, education, health, and ‘green’ energy. The cost of the economic stimulus package was estimated to be $787 billion at the time of passage, but was later revised to $831 billion. By the end of 2009, per capita National Debt to GDP increased to 85.2%.

  9. The following year, Barack H. Obama signed the Tax Relief, Unemployment Insurance Reauthorization, and Job Creation Act of 2010, which extended long-term unemployment benefits and cut the employee’s portion of the Social Security payroll taxes by 2.0%. By the end of 2010, per capita National Debt to GDP increased to 93.5%. By the end of 2011 the ratio had increased to 101.0%, and by June 30, 2012, per capita National Debt to GDP notched up by another seven tenths of a percent to 101.7%.

Ever since Barack Obama implemented his plan, America’s standard of living has gone straight down the tubes. And since he said, “We tried our plan, and it worked…,” we are forced to conclude that his goal was to destroy America’s standard of living. If for some reason this wasn’t his goal, then a more honest assessment would have been, ‘We tried our plan, and it failed.’

When Barack Obama said, “We tried this trickle-down fairy dust before. And guess what — it didn’t work then, it won’t work now… It’s not a plan to lower the deficit..,” whose policies could he possibly have been referring to? A quick study of U.S. per capita National Debt to GDP ratios and per capita Personal Income to National Debt over the last 50 years leads to only one possible conclusion – his own.

Conclusion

Since per capita National Debt to GDP is at the highest ratio since the unsustainable heights attained during the second World War, and higher than at any time in the last half-century, and since Barack Obama has clocked the highest annual budget deficits in American history ($1,412.7 billion in 2009, $1,293.5 billion in 2010, $1,299.6 billion in 2011, and $1,326.9 billion in 2012), we can only conclude that his loot-and-plunder economic theory has achieved the worst results of any set of economic policies deployed by any American president, ever. The facts speak for themselves.

We tried Barack Obama’s loot-and-plunder theory, and it failed. And not only have Obama’s policies failed, but American’s are now worse off than at any time since the 1940’s. No one has managed our economy more recklessly than Barack H. Obama. Are you still a believer? Isn’t it high time we go back to what we know works, make some improvements, and implement some of the reforms proposed over the years, which were errantly pushed aside? Yes it’s time. And since Barack Obama has proved himself unwilling to bend to the will of the American people, it’s time we gave someone else the opportunity. It’s time to switch teams. It’s time to follow real leadership. It’s time to elect a true Conservative.

References:

Table 7.1 Selected Per Capita Product and Income Series in Current and Chained Dollars | Bureau of Economic Analysis

Debt to the Penny | Treasury Direct

Chart Data | Google Drive

Talk about Fairy Dust and Snake Oil!

:: Obama’s Loot-and-Plunder Theory on Social Benefits

– By: Larry Walker, Jr.-

Under Barack Obama’s economic theory, better known as Loot-and-Plunder Economics, income tax rates will necessarily skyrocket, perhaps by as much as 50% across-the-board. If you don’t believe it, just look at the facts and figures. For example, as of FY 2011, annual outlays on Social Security Benefits were 77.7% greater than they were in 2001, while outlays on Medicare were 148.8% greater (shown in current dollars in the chart above). Has Obama solved the problem through entitlement reform? Has he raised Social Security and Medicare taxes by 77.7% and 148.8% respectively? No, so what do you think is coming?

While Obama talks the talk, regarding taxing the rich and fairness, surely even he knows that his plan is not sustainable. It doesn’t balance the budget or grow the economy. The truth is that Obama has no plans for lowering income tax rates on the middle-class, but instead he created Obamacare, which is a nifty way of imposing a whole new set of taxes on those who can least afford health insurance, namely the middle-class. Got it? There will be no middle-class tax relief in a second Obama term, just new health care taxes (i.e. more pain).

So other than leading us all to the edge of a Fiscal Cliff, what else has Obama done for the middle-class? Well, he delivered a two-year Make Work Pay Credit (MWPC), which represented a $400 to $800 reduction in Social Security Taxes in 2009 and 2010, and followed this up with a two-year 2.0% Social Security Tax Cut. In other words, he gave us four years of temporary measures in an effort to stimulate the economy. But what did this really accomplish?

Two Things

#1 – The jobs deficit has grown to 11,760,000 under Obama’s watch, from 5,165,000 when Bush turned over the keys. So we can state without ambiguity that his attempts to stimulate the economy have failed. Sure, things might not be as bad as they could have been, but at the same time, things might not be as good as they could have been either.

The “jobs deficit” increases every month that employers create fewer than 127,000 jobs, the number needed to keep pace with population growth. As you can see in the chart below, the jobs deficit has increased under Obama’s watch, and has remained virtually unchanged since December of 2009. Aside from the jobs deficit, we are still 4,648,000 jobs short of where we were in December of 2007, partially due to the Great Recession, which ended in June of 2009, but namely due to Barack Obama’s loot-and-plunder economic policies, which were designed to prolong the crisis.

#2 – Not only has the unemployment rate remained above 8.0% for his entire term, but Obama’s ingeniously designed Social Security tax cuts have since created a $500 billion per year shortfall in the Social Insurance Fund accounts. Per the chart below, derived from the Bureau of Economic Analysis, Table 3.14 – Government Social Insurance Funds Current Receipts and Expenditures, the gap between Social Insurance receipts and expenditures is now worse than ever, thanks to Obama. I guess we’ll find out whether or not work pays (i.e. the MWPC), a few years from now, when we discover that our Social Security and Medicare guarantees were squandered away during the Obama years. His looting of an additional $716 billion out of Medicare to fund Obamacare should be le coup de grâce (the final blow).

As you can see in the chart above, the point of no return was actually breached in FY 2001, when Outlays for Social Benefits equaled Insurance Contributions. This was primarily due to an escalation in the number of baby-boomers reaching retirement age. But instead of addressing the obvious dilemma, the federal government allowed it to fester into larger and larger annual deficits. Thus, the “Social Benefits Deficit” eventually reached $177 billion by Fiscal Year 2008. Then along came Obama, who instead of addressing the problem has handed out four consecutive years of Social Security Tax cuts (i.e. loot-and-plunder fairy dust).

In just three years Obama turned a $177 billion annual Social Benefits Deficit into a $500 billion per year morass. Free money! Obamabucks! What were the results? As you can see in the chart above, and in the related table, in Fiscal Year 2009 the gap between Government Social Benefit Expenditures and Contributions swelled to $376 billion, from $177 billion in 2008, or by 112.4%. Those were the consequences of giving both taxpayers and non-taxpayers a reduction in their Social Insurance responsibilities via the MWPC. In Fiscal Year 2010, with the extension of MWPC, the Social Benefits Deficit widened to $411 billion, or by another 9.3%.

As if that wasn’t enough, Obama devised an even more cunning way of plundering America’s future retirement security. Replacing MWPC with his 2.0% Payroll Tax Cut, in 2011, caused the Social Benefits Deficit to widen by an additional 21.4%, to $499 billion. That’s a half-a-trillion dollar shortfall. And it’s not over yet. Since the 2.0% Payroll Tax Cut was extended into 2012, we will find out where Social Insurance Benefits stand, at the close of the fiscal year, on September 30th. But so far, when added together, $376 billion in 2009, $411 billion in 2010, and $499 billion in 2011, equals a total Social Benefits Deficit of $1.3 trillion. That’s the amount Obama has added to the national debt by tampering with our future retirement security, and that’s just a fraction of the $5.3 trillion he’s added to the overall debt.

Summary:

Between FY 2001 and 2008, Contributions for Government Social Insurance grew by 39.3%, while Social Benefit Expenditures grew by 73.6%. But instead of raising a red flag and solving the problem, Barack Obama proceeded to loot-and-plunder contributions, at a time when the demand for benefits was soaring. This was an amateurish move. Between FY 2009 and 2011, Contributions for Government Social Insurance actually shrank by -6.9%, while Social Benefit Expenditures rose by 22.1%, creating a $1.3 trillion shortfall.

So while gullible far-left loyalists continue to fall for Obama’s pretense, that the Romney-Ryan Ticket and Supply-Side economics would gut Social Security and Medicare, if they took five minutes to look up the facts, they would discover that Obama, through his own brand of loot-and-plunder fairy dust, has already beat them to it. The snake oil Obama is pushing is the same stuff that prolonged the Great Depression. Everyone knows that the federal government didn’t end the Depression, World War II did. That is everyone except for Obama, the unlearned and a few far-left loons.

What folks should be engaged in is bipartisan criticism of the manner in which Barack Obama is destroying our future economic security. We should at least be able to agree that there has to be a more viable alternative. Supply-side economics worked in the Roaring 20’s under Coolidge, in the 1960’s under JFK, in the 1980’s under Reagan, and in the 1990’s through 2007 under Clinton and Bush. That’s right! But according to Barack Obama, “It never worked.” Don’t believe that lie. A quick glance at the following chart, Net Federal Outlays and Receipts since 1980, says it all. Trillion dollar annual deficits are a phenomenon which began with Obama.

Lest we forget, Bill Clinton’s famed tax plan was a package which included tax rates ranging from 15% to 39.6% (i.e. rates were higher at all levels across-the-board), in addition to the Republican-led Tax-Relief and Deficit-Reduction Bill of 1997 (i.e. what actually created the boom of the 90’s). But if you think Obama can cherry-pick just one smidgen of Clinton’s tax policies, apply it to only a fraction of taxpayers, those making more than $250,000 (the equivalent of $157,197 in 1993), and achieve the same results, then you’re not using your brain.

Loot-and-Plunder economics ends when everyone sees their taxes rise by 50% or more across-the-board. That’s the only way the federal government can continue to spend at current levels, and move even halfway towards balancing its budget. When you see the symptoms of a failed economic policy (above), and your candidate boasts, “My plan worked,” that’s when you run!

—————————–

Notes:

The third chart (above) purposefully excludes interest contributed towards Social Insurance, since such interest is paid from general government funds. The federal government long ago raided the Social Security Trust Fund spending every dime, and now owes the Social Security Trust Fund $2.5 trillion, per Note 24 of the United States Government’s Notes to the Financial Statements, for the year ended September 30, 2011. From time to time, the federal government pays the Trust Fund interest on its debt, but with trillion dollar deficits for the last four years, it is reasonable to conclude that every dime of the interest paid is borrowed, thus it makes no sense to double count. The chart also excludes administrative expenses.

References:

U.S. GAO | Fiscal Year 2011 Financial Report of the United States Government

Bureau of Economic Analysis | Table 3.14 Government Social Insurance Funds Current Receipts and Expenditures

Chart Data | Google Drive

Social Security and Medicare’s Missing Link

I’m sure that everyone is aware of, or should be aware of the problems facing the Social Security Administration. For example, here’s an excerpt of the bleak outlook from the 2009 Report issued by the Social Security and Medicare Boards of Trustees. The report points out the obvious problems that have been debated for decades. You may skip this part if you want to get straight to my point below.

A MESSAGE TO THE PUBLIC:

Each year the Trustees of the Social Security and Medicare trust funds report on the current and projected financial status of the two programs. This message summarizes our 2009 Annual Reports.

The financial condition of the Social Security and Medicare programs remains challenging. Projected long run program costs are not sustainable under current program parameters. Social Security’s annual surpluses of tax income over expenditures are expected to fall sharply this year and to stay about constant in 2010 because of the economic recession, and to rise only briefly before declining and turning to cash flow deficits beginning in 2016 that grow as the baby boom generation retires. The deficits will be made up by redeeming trust fund assets until reserves are exhausted in 2037, at which point tax income would be sufficient to pay about three fourths of scheduled benefits through 2083. Medicare’s financial status is much worse. As was true in 2008, Medicare’s Hospital Insurance (HI) Trust Fund is expected to pay out more in hospital benefits and other expenditures this year than it receives in taxes and other dedicated revenues. The difference will be made up by redeeming trust fund assets. Growing annual deficits are projected to exhaust HI reserves in 2017, after which the percentage of scheduled benefits payable from tax income would decline from 81 percent in 2017 to about 50 percent in 2035 and 30 percent in 2080. In addition, the Medicare Supplementary Medical Insurance (SMI) Trust Fund that pays for physician services and the prescription drug benefit will continue to require general revenue financing and charges on beneficiaries that grow substantially faster than the economy and beneficiary incomes over time.

The drawdown of Social Security and HI Trust Fund reserves and the general revenue transfers into SMI will result in mounting pressure on the Federal budget. In fact, pressure is already evident. For the third consecutive year, a “Medicare funding warning” is being triggered, signaling that non-dedicated sources of revenues—primarily general revenues—will soon account for more than 45 percent of Medicare’s outlays. A Presidential proposal will be needed in response to the latest warning.

The financial challenges facing Social Security and especially Medicare need to be addressed soon. If action is taken sooner rather than later, more options will be available, with more time to phase in changes and for those affected to plan for changes.

http://www.ssa.gov/OACT/TRSUM/index.html

The Missing Link

My dilemma may be found in the title of the report itself. To be more specific it is found in the words ‘Social Security and Medicare Boards of Trustees’. Of course my first question is who’s on the board(s)? And my second is who’s supposed to be on the board(s)? Following is another excerpt from the 2009 Report.

Who Are the Trustees? There are six Trustees, four of whom serve by virtue of their positions in the Federal Government: the Secretary of the Treasury, the Secretary of Labor, the Secretary of Health and Human Services, and the commissioner of Social Security. The other two Trustees are public representatives appointed by the President, subject to confirmation by the Senate. The two Public Trustee positions are currently vacant.

So if I am reading this correctly, ‘the other two Trustees are public representatives appointed by the President, and subject to confirmation by the Senate’. And to date, please correct me if I’m wrong, ‘the two Public Trustee positions are currently vacant’. The Board of Trustees is composed of the following four individuals:

  1. Timothy F. Geithner, Secretary of the Treasury, and Managing Trustee
  2. Hilda L. Solis, Secretary of Labor, and Trustee
  3. Kathleen Sebelius, Secretary of Health and Human Services, and Trustee
  4. Michael J. Astrue, Commissioner of Social Security, and Trustee

One has to go back to the 2007 Report to find the last time that the two public trustee positions were functional. Here’s an excerpt from the 2007 Report:

The other two members, John L. Palmer and Thomas R. Saving, are public representatives initially appointed by President William J. Clinton on October 28, 2000, and reappointed by President George W. Bush on April 18, 2006.

http://www.socialsecurity.gov/OACT/TR/TR07/I_intro.html – wp1000302

The only other lapse I can find is in 1990. George H. W. Bush was sworn into office on January 20, 1989. The public trustee positions became vacant at the end of 1989, and they were vacant for all of 1990. In 1991, President Bush appointed Stanford G. Ross, and David M. Walker.

Here is a link to a historical listing of the Boards of Trustees:

http://www.segurosocial.gov/OACT/TR/trustees.html

So what’s my beef?

There is no public oversight over Social Security and Medicare. There has not been any public oversight for the last two years and I don’t see any on the horizon. A public corporation can’t even function properly without outside board members. Without independent, external oversight there’s no telling whether we are on the right path, or whether we are even getting the truth.

So 2008 passed without public trustees. Then 2009. Now it’s 2010 and no one is even talking about this? With major issues looming for both Social Security and Medicare, my beef is that the American people deserve to have competent, non-governmental, outside, public trustees on the Social Security and Medicare Boards of Trustees in order to monitor, verify, and criticize the information that is being disseminated. Granted this may not be the most desirable job, both positions need to be filled. That’s my beef.

A Free Market Solution to Universal Health Care, Part III

by: Raymond L. Richman

Link: Trade & Taxes

In the preceding blog on this subject (11-27-09), we wrote:

“The average household can afford to be self-insured with regard to health care costs that are not cataclysmic. We can expect falls and fractures, expect to catch cold, expect to need eyeglasses and hearing aids, expect to have children, expect cavities in one’s teeth, and to need dentures, and so on. Setting aside part of their income in a health savings account at regular intervals would enable the vast majority of our citizens to pay for these “normal” expenditures out of past savings and current income.”

“What we need is insurance against catastrophic illnesses not against the easily affordable costs of relatively minor medical episodes. Were the hundreds of millions of health-care consumers to pay the full cost of their own minor health care expenditures, they would have an incentive to economize and seek-out more economical treatments. And providers would soon compete for their patronage. Competition is the force that makes a private market economy innovate and achieve constantly growing productivity.”

Critics of health savings accounts argue that this could possibly work for the rich but not for the poor. What about those in poverty? Their past savings and current income are very likely to be inadequate to pay for all ordinary non-cataclysmic health care expenditures. Some special arrangement needs to be made for them. The current solution is Medicaid which like Medicare pays for all the expenses of getting treatment subject to a small co-payment which varies from state to state. Medicaid is a state administered program and each state sets its own guidelines regarding eligibility and services.

And these costs have been exploding. As we pointed out, expenditures in the United States on health care surpassed $2.2 trillion in 2007 or about $7,400 for every man, woman, and child, and has tripled since 1990. Neither the House or the Senate Bill creates any incentives to prevent or control rising health costs. They continue to insure the consumers of Medicare and Medicaid against all medical services. The problem is how to create incentives among Medicaid participants to economize on health expenditures. How can we create HSAs for those who have little or no income?

Medicaid is administered by the states. Philip Klein, the Washington correspondent of the American Spectator, wrote recently that the Congressional Budget Office (CBO) estimated that the proposed Obama health care bills

“would add 15 million to 20 million more people to the Medicaid rolls. The cost of such an expansion ‘could vary in a broad range around $500 billion over 10 years.’ But the catch is that such an estimate is of the anticipated federal cost of the Medicaid expansion. In actuality, the federal government typically pays around 57 percent of the cost of Medicaid, while the remaining 43 percent is picked up by the states. So what’s the full cost of a Medicaid expansion at both the federal and state level?”

According to these numbers, expenditures would increase $943 billion, not counting any rise in prices resulting from increased demand for medical services and prescriptions.

Currently, many of the poor uninsured use emergency room facilities, which are alleged to be very expensive. The National Institute of Health (NIH) estimated the average cost of such a visit to be $274 compared to $88 at community clinics. It attributed the difference principally to “the higher levels of fixed cost and indirect cost seen in the emergency department.” As we wrote in the first of this series, that it is alleged that the uninsured go to hospital emergency rooms for illnesses that could be attended to by a qualified nurse, paramedic, or intern. It is asserted that this imposes huge costs on the hospitals.

If the alleged illness can be diagnosed and treated without hospitalization and expensive tests, it imposes no greater costs on the hospitals than an ordinary clinic does. The costs of maintaining and staffing emergency facilities — having specialists, and testing and operating facilities on call to diagnose and treat really serious illnesses and injuries — is expensive. But such costs are not applicable to patients who are diagnosed and treated in a fifteen-minute visit and sent home. The allocation of such expensive overhead to such patients is not justified. The marginal cost of treating minor illnesses in emergency facilities is often zero. The personnel are there on a stand-by basis and often have little or nothing to do. Those who use emergency rooms as a clinic create a costly problem only when the staff and facilities are operating at capacity. In that case, the cost of treating patients with minor health problems in the emergency room is not zero but it is not infinity either. Having a general practitioner on call – MD or nurse or paramedic – is not expensive.

And there are many general practitioners and residents on duty in every hospital in the country. Still there is a need to reimburse the hospitals. Is there a way for every user of such facilities to pay for some if not all of the hospital’s reasonable charges, thus creating an incentive to restrain exorbitant cost increases. Many states require a Medicaid co-payment if the enrollee has any regular wage income. But this does not create a sufficient incentive for the consumer of health care or the provider to economize.

What we propose is assigning each enrollee to a primary private physician, clinic, or hospital-sponsored clinic of his choice. We expect there will be competition among providers to be his primary care provider. Some pharmacies have a clinic in their stores and they may qualify as primary providers. If treatment beyond primary provider’s abilities is required, the patient will be referred to an appropriate qualified co-operating provider of such required services.

An HSA account could be created in a local bank in the name of the enrollee and a fixed amount deposited in it by HHS, perhaps, $100 per month per enrollee or by depositing a single lump sum. A family of four would have $4800 paid into the savings account in a year. The account will be charged for each care provider’s services to the household. The bank will be reimbursed by HHS for withdrawals that exceed the balance in the account. Banks can be expected to compete for such accounts. An incentive to economize on the enrollee’s part would be a provision that half of any balance in the account that remains at the end of the fiscal year will be paid to him.

We need to think anew about providing or subsidizing health care. The above is a start.

Health Insurance Co-Ops vs. Government-Run Health Insurance

* More Honest Debate *

By: Larry Walker, Jr. –

What is a Cooperative (Co-Op)? *

A Cooperative is a business organization owned and operated by a group of individuals for their mutual benefit. A cooperative may also be defined as a business owned and controlled equally by the people who use its services or who work at it.

There are many types of Co-Ops in the United States. I will attempt to address some of the most common cooperatives. If you belong to a credit union, you are already a member of a Co-Op. My electric and natural gas utility company is an EMC, another word for Co-Op. In the insurance industry, Co-Ops are called Mutual Companies, or Mutual Legal Reserves.

Credit Unions are owned by their members. When you join, you must establish a share account and maintain a minimum balance. Your share account is your capital investment in the company. You are paid ‘dividends’ on your savings and checking accounts. Dividends are your share of the Credit Union’s profits. A Credit Union offers benefits for its members such as preference on home and automobile loans.

An Electric Membership Corporation (EMC) is a service cooperative owned by those who receive its services. There are nearly 1,000 electric cooperatives in the United States. When the EMC makes a profit, those profits are shared with customers through credits to their electric bills, or lower rates.

Health Insurance Co-Ops

Health Care Services Corporation (HCSC) is the largest customer owned health insurer in the United States.

  • HCSC operates the Blue Cross and Blue Shield plans in Illinois, New Mexico, Oklahoma and Texas, employing 17,000 people and serving more than 12.4 million members – 38% in national employer plans, 32% in large local employer plans, 10% in small employer plans, 10% in individual plans and 10% in government plans.

  • HCSC is the fourth largest health insurance company in the United States and the largest customer-owned health insurer. In 2008, the company’s gross revenue totaled $39.9 billion (considering all subsidiaries which are not included in the chart below in accordance with GAAP).

  • HCSC is the most financially secure health insurer in the United States, with a rating of AA- (Very Strong) from Standard and Poor’s, Aa3 (Excellent) from Moody’s and A+ (Superior) from A.M. Best Co.

  • HCSC retains full or joint ownership of a number of subsidiary companies, including Fort Dearborn Life Insurance Co., Dental Network of America, MEDecision, Availity, Prime Therapeutics and RealMed.

If the HCSC model is the type of Health Insurance Co-Op being discussed in Congress, then I am a fan. Yes. Here is an idea that would have strong bi-partisan support. We can agree on Health Insurance Co-Ops. In my opinion Co-Ops are in line with the purest sense of Capitalism. On the other hand, if Congress is talking about some kind of partially Government owned, or Government controlled entity, then I am not in favor.

In fact, I would like to join HCSC, or a similar Co-Op, but unfortunately it only operates in 4 states, and none of the health insurers in my state are co-ops. Fostering increased competition by allowing insurers to operate in all states would be an improvement.

The Plan

So if America wants to convert its health insurance industry to Co-Ops, the question is how? Obviously, it would be unfair, and foolish, to force the existing insurers out of business, so how do you get them to convert?

I am a proponent of Binary Economics. Under Binary Economics, the only role of Government in private enterprise is to offer interest-free loans through its central bank. Existing publicly traded insurers will need to buy back all of their stock in order to make the conversion to mutual companies. Interest free loans from the Government will facilitate this conversion. The loans will be paid back over the long-term out of the profits of the insurers. Once the loans have been paid, the insured will be able to participate in a larger share of company profits. Profits will be shared with policy holders either in the form of dividends, or lower insurance rates.

Interest free loans are not hand-outs, or bailouts. The money gets paid back. Granting interest free loans would be a much better use of taxpayers money than the current foolishness being promoted by certain ‘linear’ thinkers (right and left). The World is not flat. In fact, most good ideas come from outside of the box.

Reforms I can believe in:

  1. Conversion of the Health Insurance Industry to Co-Ops

  2. Tort Reform

  3. Fostering Interstate Commerce for increased competition

  4. No denial for preexisting conditions

  5. Tax Incentives for those paying higher premiums due to preexisting conditions

  6. Tax incentives for purchasing health insurance

  7. Portability of policies

Reforms I don’t believe in:

  1. Making health insurance mandatory

  2. Taxing employers who don’t offer insurance

  3. Expanding Government-Run health care

  4. Excessive Government Regulation

  5. Triggers

click images to enlarge

Sources:

http://www.hcsc.com/about-hcsc/overview.html

http://www.investopedia.com/terms/m/mutualcompany.asp

http://en.wikipedia.org/wiki/Co-op

http://www.waltonemc.com/mycoop/

https://blackandcenter.blog/2009/09/02/government-run-vs-private-health-insurance/

Government-Run vs. Private Health Insurance

The table above was revised on 08/30/09.

click image to enlarge

Government-Run vs. Private Health Insurance

More Honest Debate

First of all, 60% of private sector health insurance providers are non-profits who must by law disclose their records to the public. You can find their tax returns online including information about programs, and compensation.

Most of the remaining companies are publicly traded and by law must file 10K and 10Q reports with the SEC. Their financial information and compensation information is also available online on various websites.

Information on government-run health insurance programs (i.e. The Public Option) may also be found online. The Social Security Administration issues an annual Trust Fund report. (Note: Both public trustee positions are still vacant.)

In comparing the three types, it is clear that something is wrong with the federal government. I have to disclose that I did not include the funds that Medicare obtains from general government revenues, above, because this money comes directly from income taxes.

Medicare Part A is funded primarily by payroll taxes assessed on an individual’s total wages. Medicare B and D is funded primarily by premiums charged to Social Security recipients (which I might add is kind of redundant).

To be brief: For-profits are by necessity in the black. On the other hand, government-run insurance is in the tank. In fact, Medicare is projected to exhaust it’s assets by 2017 according to the 2009 Annual Trustees Report.

So I ask this question. Who is better qualified to manage health insurance: ‘government workers’ in Washington, DC or the Private Sector? I think you know the answer.

Solution: With proper regulation and oversight, turn over Medicare, and Social Security to the Private Sector. Bigger government is not the solution, it’s the problem.

[Update: Expanded table and updated sources on 08/30/09]

Sources:

  1. http://www.bcbsm.com/home/bcbsm/annual_report.shtml

  2. http://www.redorbit.com/news/health/1639322/kaiser_foundation_health_plan_inc_and_kaiser_foundation_hospitals_report/

  3. http://www.hcsc.com/about-hcsc/finance.htm

  4. http://www.marketwatch.com/investing/stock/unh/financials

  5. http://www.marketwatch.com/investing/stock/ci/financials

  6. http://www.marketwatch.com/investing/stock/wlp/financials

  7. http://www.marketwatch.com/investing/stock/hum/financials

  8. http://www.marketwatch.com/investing/stock/aet/financials

  9. http://www.ssa.gov/OACT/TRSUM/index.html

  10. http://www.ssa.gov/OACT/TRSUM/index.html

Getting Honest About Social Security – Part 3

We begin with the Congressional Budget Office’s Estimate of the President’s Budget (above). Why wait until tomorrow? It’s on the CBO’s website at http://cbo.gov/?

You will recall from Part 2, that entitlement spending (aka mandatory spending) is comprised of the following:

Entitlement Spending, at $1.595 trillion in FY 2008, is over half of the U.S. Federal Budget. The largest entitlement spending programs based on FY 2006 were Social Security and Medicare, as follows:
  • Social Security – $544 billion
  • Medicare – $325 billion
  • Medicaid – $186 billion
  • All other mandatory programs – $357 billion. These programs include Food Stamps, Unemployment Compensation, Child Nutrition, Child Tax Credits, Supplemental Security for the blind and disabled, Student Loans, and Retirement / Disability programs for Civil Servants, the Coast Guard and the Military
In FY 2009 and 2010 alone, entitlement spending is projected to exceed government revenue by some $290 billion. So the United States is facing a budget deficit, in just two years, before spending one dime on our defense, education, veterans pensions, and other vital programs. And this wasn’t supposed to happen for another 31 years?

Is anyone still seriously considering dumping another $1 trillion dollars into this government-run ponzi scheme?

Obama said he wanted an ‘honest debate’ on his health care proposal. Well, here’s the problem. We can’t afford to waste another dollar on some misguided government program, no matter how noble. Social Security is little more than a government-run Ponzi Scheme. Medicare is only 1/2 funded by premiums. Isn’t Medicare an example of government-run health care?

What kind of health insurance company would only collect 1/2 of what it spends on claims year-after-year, after year? I’ll tell you. A government-run health insurance company. Like that commercial says Mr. president, “You Need A Plan!”

Solutions abound, but what Obama is proposing isn’t one of them.

To even begin an ‘honest’ discussion on Social Security, Medicare, Government Option Health Care, or any other ‘reform’ proposed by ‘government workers’, you first need to get honest with the public, and then your proposals had better include the following:

  • Reductions in government spending
  • Reductions in government programs
  • Privatization of government entitlement programs
  • Budget balancing initiatives
  • Incentives for private investment
  • Incentives for private business growth
  • Incentives for private job creation
  • and, Policies that promote individual liberty