The Real Employment Situation – January 2009 through March 2012

* By: Larry Walker, Jr. *

“Our economy’s now created more than 4 million private sector jobs over the past 2 years. And more than 600,000 in the past 3 months alone,” Mr. Obama boasted to a forum at the White House on women and the economy, on Friday (CBS News).

And in related news, on the previous evening, Egan-Jones Ratings Co. cut the U.S.A.’s credit rating one step to AA, the second downgrade in nine months and two levels below its highest grade, with a negative outlook citing the nation’s increasing debt burden (Bloomberg).

Most of us are well aware of the nation’s impending debt implosion, but the real employment situation has been distorted beyond reason. I understand how badly Mr. Obama is fighting against returning to the obscure existence he led prior to 2008, but if he was at all capable, he would at least tell us the truth about where we stand. I’m frankly weary from all the sugarcoating and distortion of facts. So what’s the real employment situation?

The Truth Shall Set You Free!

In order to know the truth, we must examine not so much monthly trends in employment, but rather changes which have occurred from the end of January 2009 through March 2012. When we examine the entire record, we find that our economy hasn’t created any jobs at all over the past 3 ¼ years, on a seasonally adjusted basis. Instead the unemployment rate has risen from 7.8% to 8.2%, the number of nonfarm jobs has declined by 740,000, the number of unemployed persons has increased by 624,000, and total employment has declined by 153,000. Meanwhile, the working age population has grown by 7,865,000, while the civilian labor force has only managed an increase of 471,000, causing the number of persons no longer counted in the labor force to balloon by 7,395,000.

The truth is that our economy hasn’t created any new jobs since Obama’s policies took effect. The total number of jobs peaked at an all time high of 146,595,000 in November of 2007, and through March of 2012 the number stands at 142,034,000, more than 4.5 million off the mark. If we had more jobs than existed in November of 2007, then Obama would have something to brag about, although not much. But since the truth is somewhat inconvenient, we are supposed to ignore the fact that we are more than 4 million jobs in the hole, and submit to repeated media brainwashing and succumb to the belief that we have somehow moved ahead by over 4 million. Phooey! Here are the facts.

Unemployment Rate

The unemployment rate rose from 7.8 percent in January of 2009 to 8.2 percent as of March 2012, according to the U.S. Bureau of Labor Statistics (Employment Situation 4/6/2012). (See table A-1 / Seasonally Adjusted)

Nonfarm Employment

Nonfarm payroll employment declined by 740,000 through March of 2012, from 133,561,000 in January of 2009 to 132,821,000. (See table B-1 / Seasonally Adjusted)

Unemployed Persons

The number of unemployed persons increased by 624,000 through March of 2012, from 12,049,000 in January of 2009 to 12,673,000. (See table A-1 / Seasonally Adjusted)

Total Employment

The number of persons employed declined by 153,000 through March of 2012, from 142,187,000 in January of 2009 to 142,034,000. (See table A-1 / Seasonally Adjusted)

Civilian Noninstitutional Population

The Civilian Noninstitutional Population (working age population) increased by 7,865,000 through March of 2012, from 234,739,000 in January of 2009 to 242,604,000. (See table A-1 / Seasonally Adjusted)

Civilian Labor Force

The labor force increased by 471,000 through March of 2012, from 154,236,000 in January of 2009 to 154,707,000. The labor force hasn’t grown at all since October of 2008. (See table A-1 / Seasonally Adjusted)

Not in Labor Force

The number of persons not in the labor force increased by 7,395,000 through March of 2012, from 80,502,000 in January of 2009 to 87,897,000. (See table A-1 / Seasonally Adjusted)

To make the claim of having created more jobs than Mr. Bush, which we all know was Mr. Obama’s insinuation; he must first match Mr. Bush’s all-time-high of 146,595,000. If the number of persons who involuntarily dropped out of the labor force (7.3 million), since Mr. Obama’s policies took effect, had instead been jobs created, Mr. Obama might go down in history as the all-time greatest. However, since we presently have 4.5 million fewer jobs than existed at Mr. Bush’s peak, and since, under the direction of Mr. Obama, 7.3 million new working age persons have been pushed straight into joblessness and generational dependency, Mr. Obama’s policies should perhaps be branded as the most ineffective in U.S. history.

Since employment is a lagging economic indicator, and because economists are calling for recession in 2012, and since the statistics above represent the sum total of Obama’s economic accomplishments, we’re in for serious troubles ahead. To reiterate, Mr. Obama’s policies of Inordinate Stimulus, Undue Debt and Global Warming Foolishness caused the Looming Recession.

Photo Credit: A swarm of Western Toad tadpoles eating algae. Photo: Kristiina Ovaska

Reference: Bureau of Labor Statistics, Employment Situation Summary

Data: Worksheets

The Malaise of 2012 | Part IV

* Inordinate Stimulus, Undue Debt and Global Warming Foolishness Caused the Recession

* By: Larry Walker, Jr. *

“With few exceptions no educated person in the history of Western Civilization from the 3rd Century B.C. onward believed that the earth was flat… No one before the 1830’s believed that medieval people thought that the earth was flat.” ~ Jeffrey Burton Russell (The Myth of the Flat Earth)

Global Warming Foolishness

In an article entitled, “Algae for Waste Water Treatment and BioFuel Production: A Double Winner,” Dr. John Kyndt and Dr. Aecio D’Silva discuss the process known as phycoremediation, which is short for treating waste water with micro algae, for the purpose of producing low cost algae biofuels and other biomass products.

Biofuel is a type of fuel whose energy is derived from biological carbon fixation. The advantage of algae is that it will supposedly consume more CO2 than is released in the process. Unfortunately, and unbeknownst to many, this has not been the case with previous generations of biomass. So how did scientists arrive at the recent pronouncement that algae-biomass is the answer to our future fueling needs?

In 2008, two groups of US researchers independently concluded that most biofuels commonly thought of as solutions for reducing greenhouse gases, turned out instead to increase greenhouse gas emissions. Clearing grassland or forests to plant them released more carbon dioxide than could be saved in the process. The analyses proved that large amounts of trapped carbon are released into the atmosphere when vegetation burns or decays as land is cleared. This up-front ‘carbon debt’ could take centuries to break even with emissions gradually avoided by substituting biofuels in place of fossil fuels. Many studies subsequently arrived at the same conclusion.

For example, sugarcane ethanol grown on the converted Brazilian savannah would need to replace petrol emissions for 17 years just to repay the carbon released when the savannah was converted. Other examples, such as soybean biodiesel from cleared Amazonian rainforest, took centuries to break even. The studies concluded that, only biofuels made from waste products, or grown on abandoned lands would do less harm than good. Thus the algae boom was born. The same line of reasoning eventually lead to the latest craze: treating waste water with algae for biofuel production. A double winner loser!

Ironically, fossil fuels have their origin in ancient carbon fixation, a similar process to that realized through detoxifying sewer water with algae. However, green scientists don’t recognize fossil fuel as a biofuel because it contains carbon that has been out of the carbon cycle for a very long time (which might actually be a good thing). Thus, we have green fuel, manufactured through synthetic carbon fixation, versus black gold, created through naturally aged carbon fixation.

Here’s how the algae fad works. Instead of waiting on Mother Nature to naturally form fossil fuels, mankind is now capable of producing the same effect in a fraction of the time. We have arrived. The idea is that as you flush your toilet, instead of the waste flowing to costly, energy consuming, waste water treatment facilities; it will instead be treated with algae before returning to your tap. In turn, the algae will be converted into biodiesel, green diesel, bio-jet and chemicals. The residual biomass, which is high in proteins and carbohydrates, will be used in aquaculture, animal feed, and food ingredients. Did I say food ingredients? Yes. And that makes algae a triple loser!

In fact, one particular algae biofuel manufacturer, Solazyme, boasts of its ability to create renewable oil – for fuel, and for food. Among its primary inputs are waste streams. When I recently learned that one of my favorite frozen food companies, which I won’t name here, was using the residual biomass from Solazyme in its food-line, I immediately discontinued its use. The thought of diesel fuel, and food coming from the same sewage fed algae-brew was more than I could take, as I alluded to in, Ends of the Green Agenda – Costs of Algae Biofuel.

The U.S. Navy has announced the objective of operating at least 50% of its fleet on clean, renewable fuel by 2020. According to Marine Corps Times, in 2009 the Navy paid $424.00 per gallon for 20,055 gallons of biodiesel made from algae, which set a world record at the time for the cost of fuel. Solazyme was the recipient of this lucrative contract. In the midst of the worst recession since the Great Depression, the U.S. Navy presumed that paying $424.00 per gallon for algae biodiesel (while petroleum based diesel was selling for an average of $2.50 per gallon) was somehow not a foolish waste of taxpayer’s money.

How has the company fared since the stimulus well ran dry? Solazyme (symbol: SZYM) opened on the NASDAQ Exchange at $20.71 in May of 2011, peaked at $27.03 in July of 2011, then tanked to $8.29 by October of 2011. Although it recently closed at $15.05 on March 21, 2012, and its total revenue for the fiscal year ended December 31, 2011 was $39.0 million compared with $38.0 million in the prior year, its fiscal year 2011 GAAP net loss attributable to its common stockholders was $(54.0) million, compared with $(16.4) million in the prior year.

So since Solazyme had $39 million in revenue but wound up losing $54 million in 2011, it appears to be a huge boondoggle. It’s quite a feat for a company to lose more than 100% of its total revenues. Were it not for the government’s inordinate stimulus coupled with undue debt, this foolish endeavor, along with a myriad of others, wouldn’t exist.

Yes, it’s true, global warming foolishness is a major cause of the looming recession. Instead of focusing on root causes of the previous recession, the Obama Administration has gone awhoring after science fiction myths and bowed itself to strange gods. And because of this we must all pay a price.

Economist Raymond Richman of Ideal Taxes sums it up:

The growth of state-subsidized bio-fuels, windmills and solar panels, hybrid vehicles, electric cars, and lithium battery manufacturers has highly negative effects on employment and regressive effects on the distribution of income.

We estimate that about $100 billion in grants and tax credits have been extended by the federal and state governments to the proprietors of those establishments, making many of them rich and eager to take advantage of the free capital and guaranteed loans.

Tax rebates and tax credits do not appear in our federal budget.

American economists are at a loss to explain the continuing high level of unemployment in the face of the $800 billion Recovery Act expenditures, the $1.5 and $1.8 trillion budget deficits in 2010 and 2011, and “green” energy subsidies, federal and state.

Moreover, none of the “global warming” could compete with fossil fuels without huge government subsidies. The states and federal government provided about 60 percent of the capital of the green enterprises and got nothing in return. The government made sure that wind and solar plants got a high enough price for the electricity they produced by requiring electric utilities to buy their electricity output regardless of price. The subsidies are so costly that Spain had to end the wind and solar subsidies to avoid bankruptcy and we shall have to as well.

Recently, while attempting to defend his global warming panic policies, Barack Obama made the following humorous remark, “If some of these folks were around when Columbus set sail, they probably must have been founding members of the flat earth society. They would not believe that the world was round.” Apparently everyone but Obama knows that, with few exceptions, no educated person in the history of Western Civilization from the 3rd Century B.C. onward believed that the earth was flat.

Am I supposed to trust a man who is roaming around the countryside proclaiming that the world will turn into a giant incinerator within a couple of years, unless we start making our food and fuel out of our own feces?

I simply refuse to believe that the World will turn into a ball of fire through our continued, prudent use of natural, God-given, carbon based fossil fuels. However, I do believe that the U.S.A. is headed for a cliff. If this nation keeps on borrowing and spending like it is today, we might be forced into bankruptcy within a couple of years, a concept which is apparently beyond Mr. Obama’s grasp.

The U.S. is sitting on a 200-year supply of oil. If the idea is to break free from our dependence on foreign oil, I’m game, and we can start doing that right now, with our God-given natural resources. But if the idea is some foolish Doomsday notion, based on panic and fear, then Obama should be removed from the White House, and returned to the nearest urban street corner, cardboard sign and all. Global warming foolishness is the third and final element contributing to the Malaise of 2012.

Continued from: The Malaise of 2012 | Part I | Part II | Part III

——————————————————————————————————

Other references:

http://en.wikipedia.org/wiki/Biofuel#cite_note-Science2-51

Unilever’s new Durban plant a model of sustainable savoury dry food production – Well alrighty then!

11 Great Things to Do With Sewage

Algae Meal Performs as Dairy Cattle Feed

The Malaise of 2012 | Part III

* Inordinate Stimulus, Undue Debt and Global Warming Foolishness Caused the Recession

* By: Larry Walker, Jr. *

It is impossible to calculate the effect of deficit-financed government spending on demand without specifying how people expect the deficit to be paid off in the future. ~ The Theory of Rational Expectations

Undue Debt

Obama’s three-point plan for deficit reduction can be summed up in three words, “Spend Baby Spend.” In fact, Obama will have borrowed more than $6.3 trillion during his four-year term, which is more than the first 42 and 1/4 presidents combined. And what do we have to show for it? Nothing! The only thing that his profligate spending has accomplished is to effectively stifle any chance of recovery from the December 2007 recession.

The total debt outstanding, from the inception of the United States through George W. Bush’s second year in office was $6.2 trillion. Since Obama has borrowed $6.3 trillion in four years, that’s more than the total debt incurred in the first 226 years of American history. Now that this is clear, there is really only one question:

Have we recovered yet?

To answer this, all one has to do is look at employment. The number of jobs reached an all-time high of 138,023,000 in January of 2008, but today, we are still 5.3 million jobs short of this mark.

As of the February 2012 Employment Situation Report, employers logged in a total of 132,697,000 jobs. Well great, but that’s only 170,000 more jobs than there were in February of 2001. In fact over the same 11-year period, the civilian non-institutional population grew by 29,692,000 persons. So since the working age population has grown by over 29 million, while the number of jobs has grown by a mere 170,000, the answer to that question is negative. The handwriting is on the wall.

So what was Obama’s three-point deficit plan, again? Step one was to borrow, step two to spend, and step three to repeat step one. As you may recall, “We have to spend more to keep from going broke.” It’s Endless Stimulus! Spend baby spend! As far as when principal repayments will begin, well, even with a second term, that would be never, since Obama failed to produce a budget during his first term.

As we discussed in War on Wealth III | National Debt Review, since the gross public debt as a percentage of GDP has skyrocketed from 69.9% in 2008, to 104.8% in 2012, and is projected to reach 107.8% by 2014, our ability to repeat the mistakes of the Obama administration is over. This means there won’t be a second term. The Era of Obamanomics is over.

Obama prematurely increased spending to DEFCON 1 levels, yet World War III isn’t here yet. And in spite of this undue debt, we are now heading directly into another recession, this year, in 2012. The Economic Cycle Research Institute (ECRI) reiterated its recession call on March 15, 2012, in a detailed report entitled, Why Our Recession Call Stands.

Honey baby, when the federal government borrows and spends $6.3 trillion dollars, as it has done between fiscal years 2009 and 2012, that’s 6.3 trillion fewer dollars the private sector has had access to. Having trouble qualifying for a loan? Did your local bank go belly up while you waited for approval? Small wonder; for even lenders are rational beings.

Shall we lend more money to homeowner’s who are already upside down on their mortgages, to small businesses owners who lack guarantees, or shall we instead lend to the federal government which has a guaranteed ability to repay? A printing press, that is. Undue Debt is the biggest factor contributing to the Malaise of 2012.

“When people do not accept divine guidance, they run wild. But whoever obeys the law is joyful.” ~ Proverbs 29:18

To be continued …

Continued from: The Malaise of 2012 | Part I and Part II

The Malaise of 2012 | Part II

* Inordinate Stimulus, Undue Debt and Global Warming Foolishness Caused the Recession

* By: Larry Walker, Jr. *

“… an unprecedented degree of federal government spending and intervention vis-à-vis the $787 billion dollar economic stimulus package, the $81 billion dollar bailouts of GM and Chrysler, and the enactment of health care and financial regulatory and reform bills have done nothing to stimulate our anemic recovery and have fundamentally failed at creating private sector jobs, or generating economic growth necessary for a sustainable, healthy recovery.” ~ Douglas Schoen via: The Daily Beast

Inordinate Stimulus

According to Economist Raymond Richman of Ideal Taxes Association, “The recession of 1937-38 indicated that there was no Keynesian multiplier.” That is to say, as soon as the stimulus of the preceding four years was reduced, the economy tanked. Nevertheless, Keynesians believe that the Roosevelt administration reduced stimulus spending too soon. The same argument has been made by Nobel Prize winner Prof. Paul Krugman and former Chairman of the Council of Economic Advisers, Prof. Christina Romer, and many others, after the failure of the $787 billion Recovery Act of 2009.

If four years of government stimulus isn’t enough, how long should it take, until the nation declares bankruptcy? The truth is it really doesn’t matter how long a stimulus program lasts, whether it endures for a day, a week, a month or a century; as soon as the program ends, so does all of the propped up economic growth. Is there any proof to the contrary? No, not unless hot air can be likened to proof. Let’s us ponder the stimulus theory.

For example, if the government were to give each citizen a $40 per month advance out of their future Social Security retirement entitlement, such stimulus may provide a small boost to personal consumption, or private savings. Why a family of four might even be able to purchase an extra half-tank of gasoline, at today’s prices. But will the ability to buy an extra half-tank of gas lead to a permanent $40 per month pay raise?

Not unless the extra mileage is used to obtain either a second, or higher paying job. Short of that, once the stimulus ends, so will the temporary boost to disposable monthly income. The point is that unless a stimulus program results in a permanent increase to future income, when the program ends, the recipient is demoted back to square one, or in the current economy, square zero.

With inflation soaring as it is today, an extra $40 per month will, if one is lucky, afford the same amount of gasoline that could have been purchased three years ago, at half the cost. And what’s the trade off? Well, one can either look forward to a smaller retirement annuity in the future or a tax hike in the near-term in order to make up the difference.

Green wasn’t as green as we thought!

To further drive home the point, if the government were to identify certain promising green energy companies, and to grant them billions of dollars in loan guarantees; would this represent the kind of stimulus capable of permanent growth? Well, that would depend on whether such companies produced marketable products. We know the U.S. Department of Energy has already engaged in precisely such activity. And what were the results?

As soon as the funds were disbursed, the companies purchased buildings, equipment, hired workers, and began to manufacture. But in most cases, the products in question have turned out to be overpriced and unmarketable. Since there was no unsubsidized present day demand for imaginary 22nd Century products, once the stimulus well ran dry, most of these grand endeavors collapsed. The remainder will soon follow suit.

Dr. Valerie Ramey, Professor of Economics at the University of California, San Diego recently published a Working Paper Series in the National Bureau of Economic Research (NBER) entitled, “Government Spending and Private Activity,” in which she drew the following conclusions:

  • Private spending falls significantly in response to an increase in government spending.

  • Increases in government spending lower unemployment, but in most cases virtually all of the effect is through an increase in government employment, not private employment.

  • And that on balance, government spending does not appear to stimulate private activity.

Although in early 2010 the economy received a jolt, the bump in the road we all felt was nothing but a speed bump on the way to another recession. The sheer size of the injection propelled us upward for a fleeting moment, but in the aftermath, GDP declined from a year-over-year growth rate of 3.0% in 2010, to a year-over-year growth rate of just 1.7% in 2011. Alas, once the stimulus subsided, economic growth was cut nearly in half. Inordinate stimulus is a major contributor to the Malaise of 2012.

No matter how you slice it, deficit-financed government stimulus doesn’t provide the requisite spark essential to permanent economic growth, it never has, and it never will. There is no Keynesian multiplier. So what else is new?

To be continued …

Continued from Part I

Related:

Tax Simplification, Part II – Saving $1,756 Billion, Overnight

Why Our Recession Call Stands – Economic Cycle Research Institute (3/15/12)

The Malaise of 2012 | Part I

* Inordinate Stimulus, Undue Debt and Global Warming Foolishness Caused the Recession

* By: Larry Walker, Jr. *

Despite Obama’s optimism, the Economic Cycle Research Institute (ECRI), the same organization which successfully predicted the last recession, and which over the last 15 years has gotten all of its recession calls right while issuing no false alarms, has recently opined that a 2012 recession is now inevitable.

According to ECRI, the four basic metrics that define an economy are gross domestic product (GDP), personal income, broad sales and employment. GDP peaked in the 2nd quarter of 2010, and has since been cut in half. Personal income and broad sales have closely tracked GDP. And although there has been a firming in jobs growth, when the four are taken together, the data confirm that the economy is slowing. We are heading into recession.

Employment is a lagging indicator.

Many mistakenly believe that if jobs growth gets a little better, then consumption, production and income will all improve; but in the real world jobs follow consumption, production and income. In other words, as consumption, production and income improve higher levels of employment follow. But since consumption, production and income are all on the decline, the jobs market will soon follow.

Case in point: During the recession of 2001, which lasted from March until November of 2001, employment peaked at an all-time high of 132,529,000 jobs in February, a month ahead of the recession. Six years later, during the recession of 2007, which lasted from December of 2007 through June of 2009, the number of jobs hit a new all-time high of 138,023,000 in January of 2008, the month following the start of the recession.

At the other ends of the spectrum, during the former recession (March 2001 – November 2001), the number of jobs didn’t reach a bottom of 129,840,000, until June of 2003, some 19 month’s after the recession ended. While during the latter malaise (December 2007 – June 2009), the jobs market hit a bottom of 129,244,000, but not until February of 2010, a full 8 month’s after the recession ended.

So which came first, the chicken or the egg? In other words, does a slow down in hiring lead to a slow down in hiring? Or does the tanking of GDP, personal income and broad sales lead to recession, and recession to the loss of jobs? I think we know the answer.

What’s sad is that the U.S. never fully recovered from the recession of December 2007, yet here we go again. Just look at employment. As of the February 2012 Employment Situation Report, employers logged in a total of 132,697,000 jobs, which is just 170,000 more than we had in February of 2001. Yet over the same period of time, the civilian non-institutional population has grown by some 29,692,000 persons. So as the working age population has grown by over 29 million, the number of jobs has grown by a mere 170,000. The handwriting is on the wall.

The point is that any improvement we are seeing in today’s employment situation isn’t necessarily cause for celebration, at least not for Mr. Obama, as it is likely the end of his (temporary) stimulus based, debt laced, global warming panic induced, anemic recovery. If you still don’t get it, go back to the top and re-read paragraphs 1 through 3, and it might help if you follow the links.

To be continued…

U.S. Economic Growth at 21-Month Low

* Recession Due by November of 2012 *

* By: Larry Walker, Jr. *

“Are you cut out to live a lie? If you don’t mind skulking around, leading a double life and constantly having to look over your shoulder to make sure you don’t get found out, you may have just what it takes.” ~ How to Live a Lie (eHow.com)

As I pointed out in War on Wealth, Part II | Keeping Our Foot on the Gas, Barack Obama, the unopposed Democrat presidential nominee, has been out on the campaign trail spreading the following wildly inaccurate cliff-hangers. He says, “Manufacturing is coming back. Companies are starting to bring jobs back. The economy is getting stronger. The recovery is speeding up. We’re moving in the right direction. And now we have to do everything in our power to keep our foot on the gas.”

But according to the Economic Cycle Research Institute (ECRI), the same crew that predicted the last recession, U.S. economic growth is at a 21-month low, and we are heading straight into another recession, this year, in 2012.

ECRI is a private forecasting firm based in Manhattan which was founded by Geoffrey H. Moore, the economist who helped originate the practice of using leading indicators to predict business cycles. Over the last 15 years, ECRI has gotten all of its recession calls right, while issuing no false alarms.

In the institute’s view, the United States, which under the leadership of Barack Obama has failed to recover from the last downturn, is currently plummeting into a new one. On September 30, 2011, Lakshman Achuthan, the institute’s chief operations officer, said,” If the United States isn’t already in a recession now it’s about to enter one.” Mr. Achuthan maintains this position to this day. Here he is in a February 24, 2012 interview on CNBC:

http://plus.cnbc.com/rssvideosearch/action/player/id/3000075118/code/cnbcplayershare

In fact, if you carefully study the table below, courtesy of the National Bureau of Economic Research, what should stand out is the fact that, ever since 1945, the United States has averaged an economic recession once every 59-month’s. Therefore, it is logical to infer that since the last recession began in December of 2007, the next recession should be arriving by November of 2012.

After the way Mr. Obama has divided and driven the federal government and our nation into the ground over the last 37 month’s, can you imagine how he would act under the duress of a self-imposed recession? More bailouts, never-ending stimulus, trillions more in crushing debt, bigger deficits, numberless regulations, higher taxes, continued covering of his tracks with a vast array of alibis and excuses, and more lies. Oops! Did I say lies?

It’s been real though, I mean the loss of almost a million manufacturing jobs since 2008; the decline in economic growth from a peak annual rate of 3.0% in 2010, to just 1.7% in 2011; the national debt as a percentage of GDP skyrocketing from 69.9% in 2008 to 104.8% in 2012, and projected to reach 107.8% by 2014; and lest we forget, gasoline prices rising from an average price of $1.61 in the week ending December 29, 2008, to $3.79 as of the week ending March 5, 2012. However, anyone who’s still considering Mr. Obama’s re-election should take the time to study not only ECRI’s economic indices, but also the eHow.com article, “How to Live a Lie” – because if you still believe in Obama there’s no sense in beating around the Bush.

War on Wealth III | National Debt Review

* Great Debt Spikes in American History: 1792 to 2014 *

By: Larry Walker, Jr. –

By the end of 2012, the national debt per citizen will reach $52,222 for every man, woman, and child in the United States of America. But even more sobering and significant is the fact that the national debt per U.S. taxpayer will reach $144,539 for each and every American taxpayer. So while Mr. Obama portends to be fighting wealth disparity, what he has accomplished in all his efforts has only made every American citizen poorer.

The public debt of the United States can be traced back as far as the American Revolution. In 1776, a committee of ten founders took charge of what would become the U.S. Treasury, and they helped secure funding for the war through “loan certificates” (equivalent to bonds) with which they borrowed money from France and the Netherlands. This committee morphed over the next decade into the Department of Finance. Robert Morris, a wealthy merchant and Congressman was chosen to lead the new Department of Finance in 1782. On January 1, 1783, the public debt of the new United States totaled $43 million.

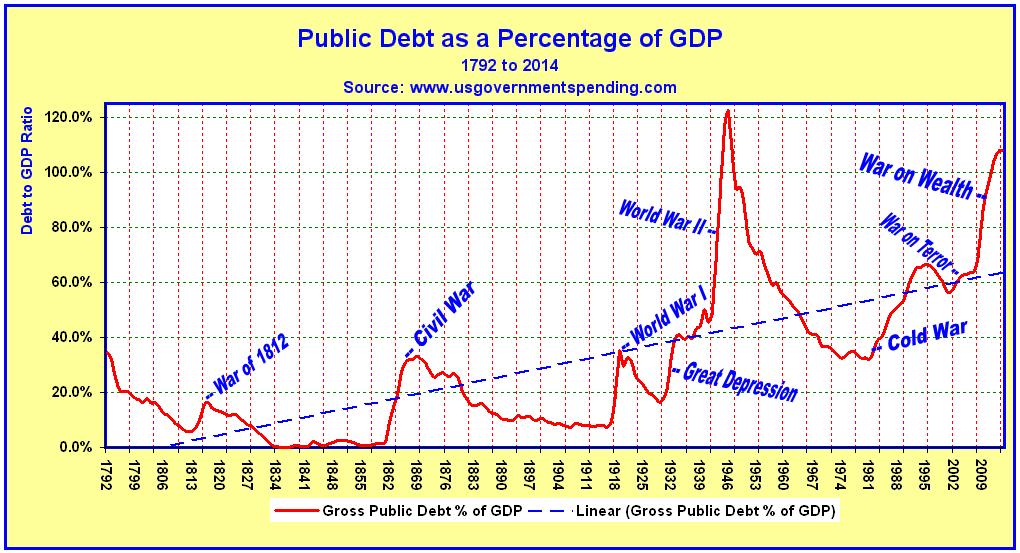
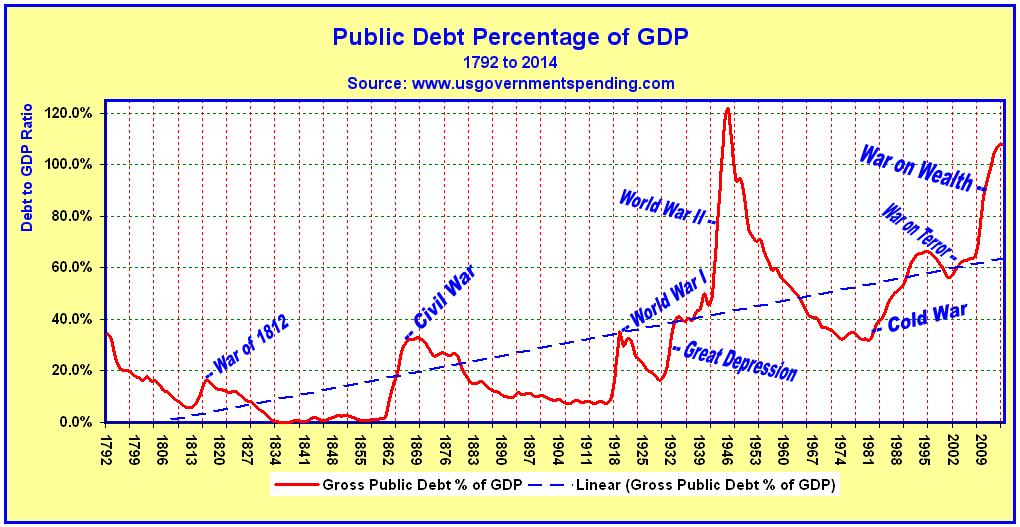
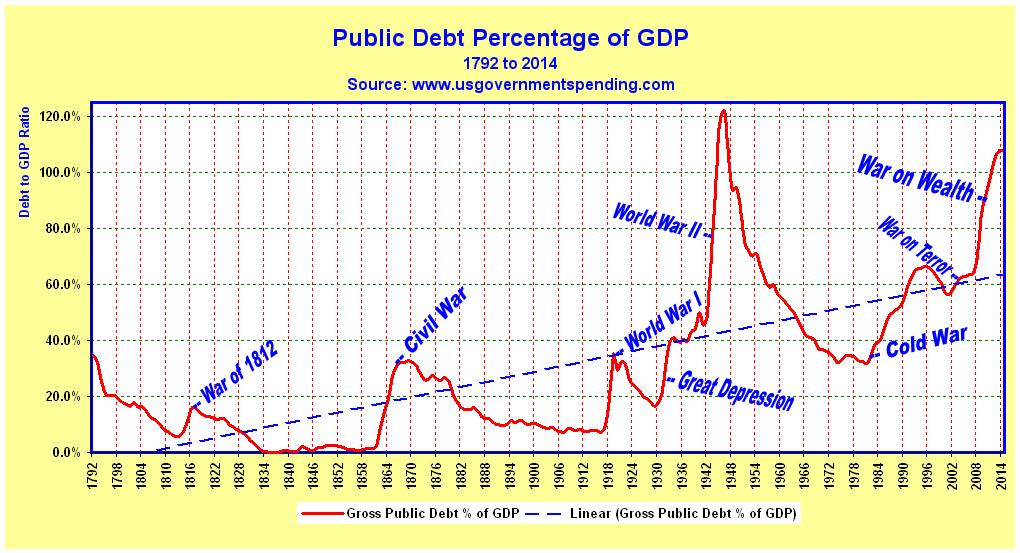
By 1792 the public debt had climbed to $80 million. The debt ratio, as a percentage of Gross Domestic Product (Debt-to-GDP), stood at just 34.6% in 1792. However, as of February 26, 2012, the gross public debt of the United States now totals $15.4 trillion, and the Debt-to-GDP ratio equals more than 100%. Of all the wars America has fought, none has been more costly than Obama’s War on Wealth. So what is the War on Wealth? How costly is this campaign compared to other wars? And when will it end?

The War on Wealth

The War on Wealth (2009 – Present) is a political, philosophical, and mostly rhetorical war launched within the United States in 2009, by the Progressive Party leader, and part-time President of the United States, Barack Obama. The war is in essence a Second Civil War, except this time there are no slaves to free, and no States to Unite. The war was instead launched to pit poor Americans against middle class Americans, and both groups against wealthy Americans, its main theme being “fairness”. Some of its top tenets include the following:

  1. The rich must pay the same effective income tax rate as the poor and middle class. Another way of stating this would be simply, “There should be a flat tax levied on everyone based on gross income.” But in the War on Wealth, this is not the goal. What Obama really means is that the rich should pay a higher percentage of taxes, while 50% of working Americans pay none.

  2. The unemployed must be paid government benefits for up to three years or longer, at the expense of the federal government. The main problem with this theory is that it’s not the federal government that pays, but instead small business employers and working taxpayers have to pick up the tab. For example, under the 2011 Federal Unemployment Credit Reduction Rule, a $21 per employee tax was levied on employers in most states, while Michigan employers paid the highest rate at $63 per employee, the funds being used to pay for the last unemployment extension. I didn’t at all appreciate having to pay $21 for each active employee, to cover the unemployed who never worked for my company, especially since Georgia had already chosen to charge my company the maximum rate for State unemployment taxes. Of course, an even bigger problem with this theory is that every extension of unemployment benefits directly increases the duration of unemployment.

  3. The federal government must provide health insurance benefits for everyone. Once again, the main problem with this is that it’s not the federal government that pays, but rather it’s those who (if they are lucky) are barely able to afford to take care of their own health care needs, who are now being asked to pay even more to help those who can’t afford to pay for their own care. I can’t afford health insurance right now, because it costs too much. But I don’t want you to pay for my care; I want the government to get out of the market and increase free-market competition so that I will be able to afford it. For the time being, I am paying the cost of my own health care needs without insurance.

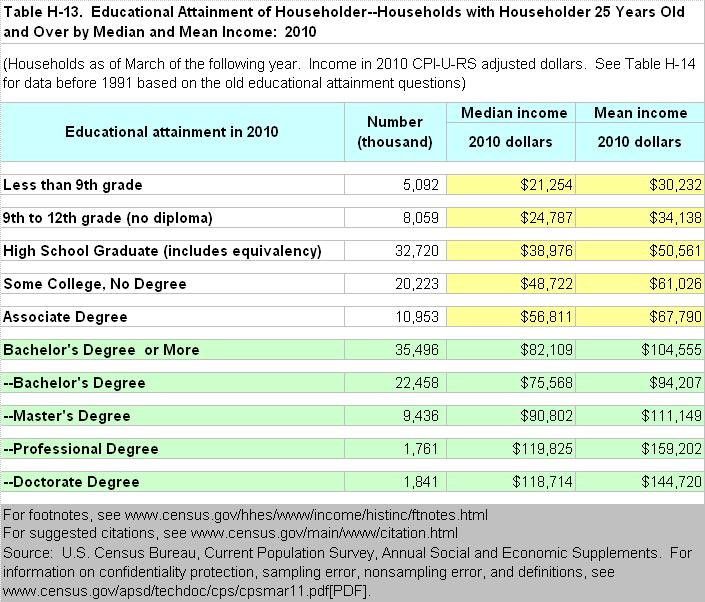
  4. The government must ensure that everyone who works hard should do well enough to raise a family, own a home, send their kids to college and put a little away for retirement. What’s wrong with this tenet? Well, first of all, how does one define the term “hard work”? Did a high school drop-out who works at McDonald’s work as hard to reach his or her goal as a PhD? Is everyone who has a job considered a “hard worker”? Based on my own work experience, I know that not everyone who works does so at the same level of responsibility, complexity or productivity. If all work were created equal, then when I was a low level accounting manager, I should have been paid just as much as the Comptroller and CFO, right? And when I was a mail clerk at a top accounting firm back in the 1980’s, I should have been paid just as much as the senior accountants and all the partners, right? Nonsense.

    And then, who’s to say that everyone wants to raise a family, own a home, or even has kids to send to college? I chose to get married and raise a step-son and three children of my own, but my next door neighbor has never been married and doesn’t have children. I later got divorced from my first wife and then chose to remarry and to help raise another three step-children in addition to my three kids. And I’m sorry to tell you this, but I’m afraid there are no shortcuts. Every individual is responsible for figuring out such matters on their own, just like my family, and our forefathers before us.

    My suggestion for anyone who wants to raise a family, own a home, and send their kids off to college, is that you take all of this into consideration while planning your future. And if you fail to plan, or if your plan fails, then don’t look to me or anyone else to bail you out, because we have our own lives to contend with. Our lives haven’t exactly been a piece of cake, but rather about making choices and then taking personal responsibility for our actions, the good, the bad, and the ugly.

How much has the War on Wealth cost?

Thus far, the War on Wealth has added another $6.4 Trillion (USD) to the national debt, which is more than any other debt spike in U.S. history. Yet this record level of borrowing and spending has delivered next to nothing in terms of results. Thus far, the war has sent our nation’s Debt-to-GDP ratio soaring from 69.9% at the end of 2008, to 104.8% in 2012. In fact, the last (and only) time that the United States’ debt-to-GDP ratio exceeded 100% was during World War II. But it only took 4 years to win the Second World War, while the War on Wealth has no end in sight.

The War on Wealth won’t end until the government runs out of other people’s money. But once that happens, it will also spell the end of the United States of America. However, thankfully the War on Wealth appears to be backfiring. Recently, the focus has shifted from a feeling of guilt for failing to help the poor and needy, to most Americans, even many on the left, now inquiring as to where the $6.4 trillion, which Mr. Obama has borrowed, was spent. Where’s the money? That’s what Americans want to know.

What Obama’s grand achievement has amounted to is a $20,329 increase in the per capita share of the national debt for every man woman and child in America, and even worse, an increase of $56,266 for every U.S. taxpayer. Has your personal income increased by $20,329, over the last four years (for each person in your household)? Probably not, but irrespective of whether it did, as a U.S. taxpayer, your share of future income taxes just went up by $56,266 courtesy of Obama’s War on Wealth.

Barack Obama will have borrowed and spent $6.4 trillion during his 4 year presidency, which is more than any other president in U.S. History. He has borrowed and spent more than was required to fight any war America has fought in her great history, and many times more than was spent even during the Great Depression. Yet nothing has changed, no victory has been won, and no American is better off than they were 4 years ago. So just how bad is Obama’s deficit spending from a historical perspective? Let’s go back in time and compare.

The War of 1812

The War of 1812, also known as the Anglo-American War (1812 – 1815), was a military conflict fought between the forces of the United States of America and those of the British Empire. America declared war in 1812 for several reasons, including trade restrictions due to Britain’s ongoing war with France, the impressment of American merchant sailors into the Royal Navy, British support of American Indian tribes against American expansion, and outrage over insults to national honor after humiliations on the high seas.

From a Debt-to-GDP Ratio of 5.8% in 1812, the ratio peaked at 16.2% in 1817 before subsiding, ultimately reaching a trough of 0.0% in 1835. During this period, the national debt increased from $50 million in 1812, to $120 million by 1817, but was subsequently wiped out entirely by 1835. In fact, the national debt was negligible from 1834 through1842, totaling between $0 to less than $10.0 million, an amazing feat considering that there was no income tax during the era.

The Civil War

The American Civil War (1861–1865) was a civil war fought in the United States of America. In response to the election of Abraham Lincoln as President of the United States, 11 southern slave states declared their secession from the United States and formed the Confederate States of America (“the Confederacy”); the other 25 states supported the federal government (“the Union”). After four years of warfare, mostly within the Southern states, the Confederacy surrendered and slavery was outlawed everywhere in the nation.

From 1.9% in 1861, the Debt-to-GDP ratio peaked at 32.9% in 1869 before subsiding. It would ultimately reach a trough of 7.3% in 1916. During the era, the national debt increased from $90 million in 1861, to $2.6 billion in 1869, and would ultimately reach $3.6 billion by 1916. Although the national debt had increased by 1916, the Debt-to-GDP ratio was lower due to a surge in GDP following the war. What’s interesting to note is that although a temporary income tax was imposed to pay for the war, it only existed between the years of 1862 and 1872. In fact, no income tax was imposed on American citizens from the founding of the nation until 1862, and no income tax existed between the years 1873 and 1912.

World War I

World War I (1914 – 1918) was a major war centered in Europe that began on July 28, 1914 and lasted until November 11, 1918. It involved all the world’s great powers, which were assembled in two opposing alliances: the Allies (based on the Triple Entente of the United Kingdom, France and Russia) and the Central Powers (originally centered around the Triple Alliance of Germany, Austria-Hungary and Italy). These alliances both reorganized (Italy fought for the Allies), and expanded as more nations entered the war. Ultimately more than 70 million military personnel, including 60 million Europeans, were mobilized in one of the largest wars in history. More than 9 million combatants were killed, largely because of great technological advances in firepower without corresponding advances in mobility. It was the sixth deadliest conflict in world history, subsequently paving the way for various political changes such as revolutions in the nations involved.

In January 1917, Germany resumed unrestricted submarine warfare. The German Foreign Minister, in the Zimmermann Telegram, told Mexico that U.S. entry was likely once unrestricted submarine warfare began, and invited Mexico to join the war as Germany’s ally against the United States. In return, the Germans would send Mexico money and help it recover the territories of Texas, New Mexico, and Arizona that Mexico had lost during the Mexican-American War 70 years earlier. Wilson released the Zimmerman note to the public, and Americans saw it as a cause for war.

President Wilson spoke before Congress, announcing the break in official relations with Germany on February 3, 1917. After the sinking of seven U.S. merchant ships by submarines and the publication of the Zimmerman telegram, Wilson called for war on Germany, which the U.S. Congress declared on April 6, 1917.

From 7.2% in 1916, our Debt-to-GDP ratio peaked at 32.6% in 1921 before subsiding. The debt would ultimately reach a trough of 16.3% of GDP in 1929. During the era, the national debt increased from $3.6 billion in 1916 to $23.9 billion by 1921, before resting at $16.9 billion in 1929. The national debt actually declined between 1921 and 1929 along with the debt ratio. The primary reason for this phenomenon was that GDP soared after implementation of the Mellon Tax Bill, which lowered the top personal income tax rate from 73% in 1919 to just 25.0% from 1925 through 1931.

The Great Depression

The Great Depression, although not a war, was a severe worldwide economic depression in the decade preceding World War II. The timing of the Great Depression varied across nations, but in most countries it started in about 1929 and lasted until the late 1930’s or early 1940’s. It was the longest, most widespread, and deepest depression of the 20th century.

The Great Depression is commonly used as an example of how far the world’s economy can decline. The depression originated in the U.S., starting with the fall in stock prices that began around September 4, 1929 and became worldwide news with the stock market crash of October 29, 1929 (known as Black Tuesday). From there, it quickly spread to almost every country in the world.

The Great Depression had devastating effects in virtually every country, rich and poor. Personal income, tax revenue, profits and prices dropped, while international trade plunged by more than 50%. Unemployment in the U.S. rose to 25% and in some countries rose as high as 33%. Some economies started to recover by the mid-1930’s. But in many countries, the negative effects of the Great Depression lasted until the start of World War II.

From 16.3% in 1929, the Debt-to-GDP ratio peaked at 50.0% in 1940 before subsiding. The debt would ultimately reach a trough of 45.4% of GDP in 1941. During the era, the national debt increased from $16.9 billion in 1929 to $50.7 billion by 1940, before resting at $57.5 billion in 1941. Although the national debt continued to increase from 1940 to 1941, Debt-to-GDP declined from 50.0% to 45.4% due to an increase in GDP related to the pre-war buildup.

World War II

World War II was a global conflict that was underway by 1939 and ended in 1945. It involved most of the world’s nations—including all of the great powers—eventually forming two opposing military alliances: the Allies and the Axis. It was the most widespread war in history, with more than 100 million military personnel mobilized. In a state of “total war”, the major participants placed their entire economic, industrial, and scientific capabilities at the service of the war effort, erasing the distinction between civilian and military resources.

Marked by significant events involving the mass death of civilians, including the Holocaust and the only use of nuclear weapons in warfare, it is the deadliest conflict in human history, resulting in 50 million to over 70 million fatalities. The United States didn’t formally enter the war until the Japanese bombing of Pearl Harbor on December 7, 1941.

From 45.4% in 1941, the Debt-to-GDP ratio peaked at 121.9% in 1946 before subsiding. The debt would ultimately reach a trough of 31.8% of GDP in 1981. During the era, the national debt increased from $57.5 billion in 1941 to $270.9 billion by 1946, before resting at $994.8 billion in 1981. Although the national debt increased almost 4-fold from 1946 to 1981, growing from $270.9 billion to $994.8 billion, the Debt-to-GDP ratio declined from 121.9% to 31.8%. The decline in the debt ratio was due to an increase in GDP following the war. In fact, over this period, GDP increased 14-fold – growing from $222.2 billion in 1946 to $3.1 trillion by 1981.

[It’s notable that top personal income tax rates were increased from 25% in 1931 to as high as 94% in 1944 -1945, but were later reduced to just 70% from 1965 through 1981 by John F. Kennedy’s, Tax Reduction Act of 1964. Thus it was the post-war boom coupled with tax cuts which caused GDP to surge, leading to a decline in the Debt-to-GDP ratio.]

The Cold War

The Cold War (approx. 1945-1991) was a continuing state of political and military tension between the powers of the Western world, led by the United States and its NATO allies, and the communist world, led by the Soviet Union, its satellite states and allies. This began after the success of their temporary wartime alliance against Nazi Germany, leaving the USSR and the US as two superpowers with profound economic and political differences.

The Soviet Union created the Eastern Bloc with the eastern European countries it occupied, maintaining these as satellite states. The post-war recovery of Western Europe was facilitated by the United States’ Marshall Plan, while the Soviet Union, wary of the conditions attached, declined and set up COMECON with its Eastern allies. The United States forged NATO, a military alliance using containment of communism as a main strategy through the Truman Doctrine, in 1949, while the Soviet bloc formed the Warsaw Pact in 1955. Some countries aligned with either of the two powers, whilst others chose to remain neutral with the Non-Aligned Movement.

In the 1980s, the United States increased diplomatic, military, and economic pressures on the Soviet Union, at a time when the nation was already suffering economic stagnation. In the late 1980s, Soviet President Mikhail Gorbachev introduced the liberalizing reforms of perestroika (“reconstruction”, “reorganization”, 1987) and glasnost (“openness”, ca. 1985). This opened the country and its satellite states to a mostly peaceful wave of revolutions which culminated in the collapse of the Soviet Union in 1991, leaving the United States as the dominant military power.

From 32.8% in 1981, the Debt-to-GDP ratio peaked at 66.1% in 1996 before subsiding. The debt would ultimately reach a trough of 56.4% of GDP in 2001. During the era, the national debt increased from $994.8 billion in 1981 to $5.2 trillion by 1996, before resting at $5.8 trillion in 2001. Although the national debt increased from $5.2 trillion in 1996 to $5.8 trillion in 2001, the Debt-to-GDP ratio declined from 66.1% to 56.4%. The decline in the Debt-to-GDP ratio was primarily due to a rise in GDP, which had grown from $3.1 trillion in 1981 to $10.2 trillion by 2001. The growth in GDP was primarily due to Ronald Reagan’s Tax Reform Act of 1986.

The War on Terror

The War on Terror, also known as the Global War on Terror or the War on Terrorism (2002 to January 20, 2009), is a term commonly applied to an international military campaign led by the United States and the United Kingdom with the support of other NATO as well as non-NATO countries. Originally, the campaign was waged against al-Qaeda and other militant organizations with the purpose of eliminating them.

The origins of al-Qaeda as a network inspiring terrorism around the world and training operatives can be traced to the Soviet war in Afghanistan (December 1979 – February 1989). In May 1996 the group World Islamic Front for Jihad Against Jews and Crusaders (WIFJAJC), sponsored by Osama bin Laden and later reformed as al-Qaeda, started forming a large base of operations in Afghanistan, where the Islamist extremist regime of the Taliban had seized power that same year. In February 1998, Osama bin Laden signed a fatwa, as the head of al-Qaeda, declaring war on the West and Israel, later in May of that same year al-Qaeda released a video declaring war on the US and the West.

Following the bombings of US embassies in Kenya and Tanzania, US President Bill Clinton launched Operation Infinite Reach, a bombing campaign in Sudan and Afghanistan against targets the US asserted were associated with WIFJAJC, although others have questioned whether a pharmaceutical plant in Sudan was used as a chemical warfare plant. The plant produced much of the region’s anti-malarial drugs and around 50% of Sudan’s pharmaceutical needs. The strikes failed to kill any leaders of WIFJAJC or the Taliban.

It was the 2000 millennium attack plots, including an attempted bombing of Los Angeles International Airport, the bombing of the USS Cole in October 2000, followed by the September 11, 2001 attacks, which led to a declaration of war. The War on Terror officially ended on January 20, 2009, when it was reduced to an Overseas Contingency Operation, and with commencement of the War on Wealth.

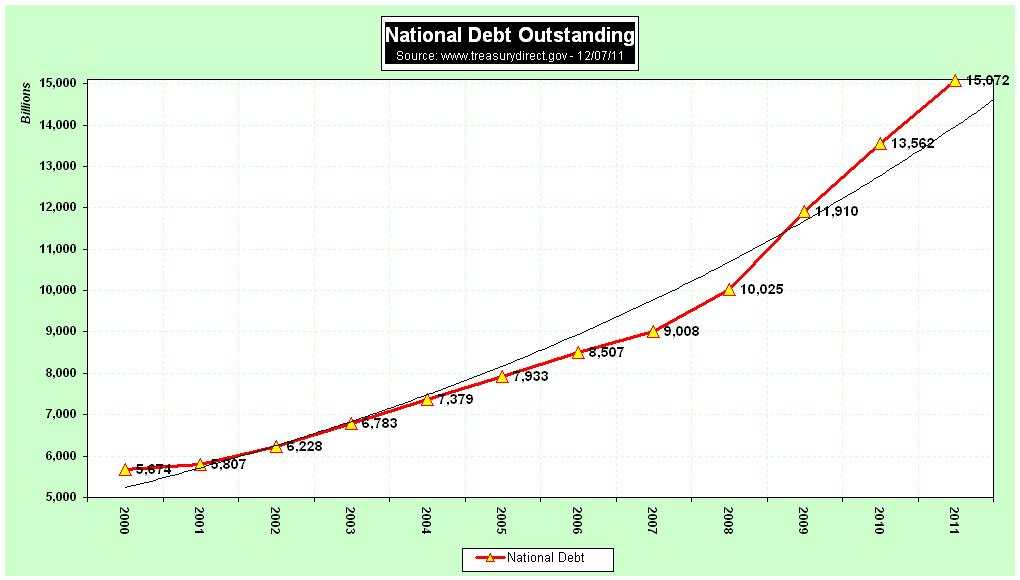
From 56.4% in 2001, the Debt-to-GDP ratio peaked at 69.9% in 2008. During the era, the national debt increased from $5.7 trillion in 2001 to $9.9 trillion by 2008. The debt has since skyrocketed as a result of the new War on Wealth. Although the gross public debt increased by $4.2 trillion, from 2001 through 2008, expanding from $5.7 to $9.9 trillion, it has subsequently burgeoned by another $6.4 trillion in half the time, since the commencement of the War on Wealth. From 2009 through 2012, the federal debt will have ballooned from $9.9 trillion to $16.3 trillion. The debt will ultimately reach a peak of 104.8% of GDP by the end of 2012, and is expected to increase to 107.8% by the year 2014.

Summary of Federal Borrowing

  • War of 1812 – Increase in Federal Debt: $70 million

  • American Civil War of 1861 – Increase in Federal Debt: $2.5 billion

  • World War I – Increase in Federal Debt: $20.3 billion

  • The Great Depression – Increase in Federal Debt: $33.8 billion

  • World War II – Increase in Federal Debt: $213.4 billion

  • Cold War – Increase in Federal Debt: $4.8 trillion

  • War on Terror – Increase in Federal Debt: $4.2 trillion

  • War on Wealth – Increase in Federal Debt (to date): $6.4 trillion

Conclusion

What is significant about all of these great debt spikes in American history is that it took 189 years (1793 to 1981) for the national debt to reach $994.7 billion, an average increase of $5.2 billion per year. From there on it took just 20 years (1982 to 2001) for the debt to rise by another $4.8 trillion, an average increase of $238.7 billion per year. Subsequent to that, it took a mere 7 years (2002 to 2008) for the debt to grow by another $4.2 trillion, an average increase of $602.3 billion per year. Compared with the former eras, the federal debt has surged by another $6.4 trillion just since January of 2009, which amounts to an average increase of $1.6 trillion per year.

With federal borrowing now completely out of control, one can only wonder who’s really benefiting from the War on Wealth, and when it will come to an end. What Obama’s grand achievement has amounted to is a $20,329 increase in the per capita share of the national debt for every man woman and child in America, and even worse, an increase of $56,266 for every U.S. taxpayer. Has your personal income increased by $20,329, over the last four years (for each person in your household)? Probably not, but irrespective of whether it did, as a U.S. taxpayer, your share of future income taxes just went up by $56,266 courtesy of Obama’s War on Wealth.

By the end of 2012, the national debt per citizen will reach $52,222 for every man, woman, and child in the United States. But even more sobering and significant is the fact that the national debt per taxpayer will reach $144,539 for each and every American taxpayer. So while Obama portends to be fighting wealth disparity, what he has accomplished in all his efforts has only made every American citizen poorer.

Well, we have a choice, we can either wait for the next recession, or the next genuine war, either of which will surely bankrupt our nation, or we can end the War on Wealth once and for all, in November of 2012, by simply voting Obama out. It’s time to stop playing games and time to get serious about America’s future.

War on Wealth, Part II | Keeping Our Foot on the Gas

* Pieces of the Keystone XL pipeline await construction in South Dakota. Via: North Platte Post *

By: Larry Walker, Jr. –

When Mr. Obama visited the padlock maker Master Lock in Milwaukee, on February 15, 2012, he drew the following conclusions. He said, “Manufacturing is coming back. Companies are starting to bring jobs back. The economy is getting stronger. The recovery is speeding up. We’re moving in the right direction. And now we have to do everything in our power to keep our foot on the gas.” So in keeping with my fact based approach, I have to ask, Are Mr. Obama’s claims reasonable? Let’s run down the list.

“Manufacturing is coming back. Companies are starting to bring jobs back.”

First of all, in my last post, War on Wealth | Obama Visits Master Lock, I pointed out that the United States has lost more than 6.0 million manufacturing jobs since 1990, and almost 1.0 million of those have been lost since Obama’s inauguration (see chart above). That’s hardly indicative of a manufacturing boom. And since Master Lock only brought back an alleged 100 jobs from China, that’s hardly proof of companies bringing jobs back. It would have been more accurate to state, although less of a reason to re-elect Mr. Obama, that one U.S. company brought back 100 jobs from China.

“The economy is getting stronger. The recovery is speeding up.”

Next, according to the Bureau of Economic Analysis, GDP declined at an annual rate of (3.5%) in 2009, increased at an annual rate of 3.0% in 2010, and then slowed to an annual rate of just 1.7% in 2011 (as of 1/27/2012). So since our economy declined from an annual growth rate of 3.0% in 2010, to an annual growth rate of just 1.7% in 2011, does this mean the economy is getting stronger? Not in my book. So instead of backing Obama’s claim, that the recovery is speeding up, the facts show that the recovery is actually slowing down (see chart above).

“We’re moving in the right direction.”

Are we moving in the right direction? Well, in terms of deficit spending, the government is borrowing at the highest rate of GDP since World War II, as shown in the chart (above). The national debt as a percentage of GDP has skyrocketed from 69.9% in 2008 to 104.8% in 2012, and is projected to reach 107.8% by 2014. The last time our debt-to-GDP ratio surpassed 100% was in 1945, when the federal debt climbed to 116.6% of GDP, peaking at 121.9% in 1946.

We know where the money was spent during the Second World War, but where’s the $5 trillion Obama borrowed and spent? For God’s sake, we could have cured cancer, or built a colony on the Moon with that kind of dough.

In terms of the near record debt-to-GDP ratio, coupled with the continuing loss of manufacturing jobs and the year-over-year decline in GDP, I conclude that the United States is moving in the wrong direction.

“And now we have to do everything in our power to keep our foot on the gas.”

Wait a minute; did Mr. Obama dare mention the word gasoline in his delusional tirade? When I first heard this, I wondered for a minute whether he really meant to say, ‘And now we have to do everything in our power to keep our boot on the neck of U.S. oil and gas producers.’

According to the U.S. Energy Information Administration (EIA), gasoline prices have risen from an average price of $1.61 in the week ending December 29, 2008, to $3.52 through the week ending February 13, 2012 (see chart above).

So since gasoline prices have risen by 118.6% under the Obama Administration, perhaps we should be doing everything in our power to remove the federal government’s dead cold foot from the gas pedal. Gasoline prices are expected to rise further, to $4.50 per gallon by this summer, which may give Mr. Obama a temporary victory in his War on Wealth, but fortunately for America, his chance of re-election will simultaneously run out of gas.

To the contrary, instead of being a time to continue recklessly forward, our foot glued to the accelerator, now is the time for America to pull over to the pits for refuelling, new tires, repairs, mechanical adjustments, and a driver change. The replacement of Mr. Obama with a truly Conservative POTUS is imminent. And just so you don’t get the wrong idea, no, I’m not suggesting as a substitute the severely moderate Mitt Romney. [But I’ll back Mr. Romney in a heartbeat over another four years of Obama.]

References:

A Crude Hit to the Recovery

18 Statistics That Prove That the Economy Has Not Improved Since Barack Obama Became President

Related:

War on Wealth | Obama Visits Master Lock

Manipulation 201: Playing With Unemployment

Drill Here, Drill Now | Facebook Petition

War on Wealth | Obama Visits Master Lock

:: By: Larry Walker, Jr. ::

Mr. Obama visited the padlock maker Master Lock in Milwaukee, Wisconsin on Wednesday, but wasn’t joined by Republican Gov. Scott Walker, who greeted the president upon arrival, but canceled his escort duties. Hey, so he was already sick to his stomach, and hanging out with Obama would have surely made matters worse.

During the event, after taking full credit for the whopping 100 jobs that Master Lock has brought back to Wisconsin from China, one of Obama’s many fabrications for the day, he added, “For the first time since 1990, American manufacturers are creating new jobs.”

However, according to the Bureau of Labor Statistics (BLS), there were 17,881,000 manufacturing jobs in the United States at the beginning of 1990, and only 17,395,000 by the end of that year (as seasonally adjusted). And by the end of the year 2000, the number had declined to 17,178,000 (shown graphically above).

Following the decline through to the end of the year 2008, the number of manufacturing jobs had fallen all the way to 12,849,000. In fact, by January of 2012, the latest statistics available prior to Obama’s speech, the BLS reported that the number of manufacturing jobs had fallen to just 11,862,000, which is almost one million fewer than when Obama first implemented his vision for America. So Obama is still delusional. What else is new?

Obama then continued with his own brand of manufacturing; the truth that is. He said, “It’s time to stop rewarding companies that ship jobs overseas and start rewarding companies that are creating jobs right here in the United States of America.”

So was it a reward that caused Master Lock to bring an entire 100 jobs back from China to Wisconsin? Did the company’s actions have anything remotely to do with Obama’s tax and regulatory policies? Obviously not, since Obama has yet to do anything to encourage such behavior. What has he done other than threaten companies with higher income taxes, Obamacare taxes, and more regulations? Not much to speak of, other than bailing out big banks and the GSE’s, and subsidizing the auto industry and the soon to be bankrupt Green Energy sector.

He rambled on, “Manufacturing is coming back. Companies are starting to bring jobs back. The economy is getting stronger. The recovery is speeding up. We’re moving in the right direction. And now we have to do everything in our power to keep our foot on the gas… And the last thing we can afford to do is go back to the same policies that got us into this mess.” YeeHa!

Man, that’s a lot of hoopla over 100 jobs. Studying the chart above, and considering Obama’s pedal to the metal analogy, if manufacturing is coming back, and if this alleged comeback is attributable to his Administration, then it looks like the government just needs to borrow and spend another $10 trillion (or so) and that should be enough get us back to where we left off in 1989. Keep on dreaming Mr. Obama!

Now as far as the policies that got us into this “mess”, I’m not sure which mess he’s referring to. Does he mean the mess we’re in now (i.e. $16 trillion in debt), or the mess that got us into the mess, that got us into the mess we’re in now? Does he mean that the policies of the relatively high tax era were bad, or the two relatively low tax eras which surrounded it? Or does he mean that the free-trade policies implemented in the 1990’s are the problem? I don’t think Obama even knows what he means. Not that anyone really cares what he says anymore.

Most of us are more focused on the $5 trillion the government has borrowed over the last three years, in this massive effort to get us virtually nowhere. What about that Mr. Obama? I think Congress should appoint an independent auditor to determine exactly where all that money went. I mean Obama has squandered a heck of a lot of money, and we have next to nothing to show for it.

Who knew? Maybe our future lies in padlocks. I suppose we’re going to need lots of locks just to keep our stuff safe from this new breed of fair share politicos. And in the meantime, it wouldn’t hurt to place one of those gigantic Master Locks on the U.S. Treasury.

Obama’s Square Deal and Just Deserts

What? Obama Borrowed $5 Trillion in 3 Years?

– By: Larry Walker, Jr. –

It was back on July 3, 2008 when Barack Obama exclaimed, “The problem is, is that the way Bush has done it over the last eight years is to take out a credit card from the Bank of China in the name of our children, driving up our national debt from $5 trillion for the first 42 presidents – #43 added $4 trillion by his lonesome, so that we now have over $9 trillion of debt that we are going to have to pay back — $30,000 for every man, woman and child. That’s irresponsible. It’s unpatriotic.”

To be fair, it took Bush a full 8 years to run up a $4 trillion dollar tab, yet just three years into his one-term proposition, Obama has already run up another $5 trillion, by his lonesome. So what does that make him, a genius? Today we have a national debt of $15.1 trillion that we are going to have to pay back — $48,254 for every man, woman and child, and $133,993 for every U.S. taxpayer. So it may be said that Obama’s record on the national debt is 333 times more irresponsible, and 333 times more unpatriotic, right? But let’s just call it, “Not Fair”.

To be equitable, all that Obama has accomplished, thus far, is to hand every citizen a $48,254 handicap, and to put every U.S. taxpayer $133,993 in the hole. Since I officially became a grandfather in October of this year, the thought of this lying, hypocrite lecturing my children and grandchildren about fairness, as he hands them each their share of $133,993 of the U.S. debt, because they will surely inure their ‘fair share’, makes me sick. Fair shot, fair share, same rules?

The quotation “All men are created equal” has been called an “immortal declaration“. So can Obama top this?

“We hold these truths to be self-evident, that all men are created equal, that they are endowed by their Creator with certain unalienable Rights, that among these are Life, Liberty, and the Pursuit of Happiness. That to secure these rights, Governments are instituted among Men, deriving their just powers from the consent of the governed….” ~U.S. Declaration of Independence

I didn’t think so. Somebody needs to tell the idiot-in-chief that in America, everybody has a fair shot, everybody pays their fair share, and everyone plays by the same rules; the only exception being perhaps he and his cronies.

According to the U.S. Census Bureau, household income is a product of one’s level of education. It’s a fact that households with a Bachelor’s Degree, or greater, earn higher incomes. So if you want more income, you better finish college, otherwise, be happy with what you get, because it could be a lot worse. After all, this isn’t the 3rd world. American’s know the drill, and we make the choices that we need to make, to get where we want to be. And if we fall short, we push our children forward.

Those with less than a 9th grade education can expect to earn median incomes of $21,254, and mean incomes of $30,232, while those with some college can expect median incomes of $48,722, and mean incomes of $61,026. In contrast, those with professional degrees may expect to earn median incomes of $119,825, and mean incomes of $159,202. So anyone who wants to earn their ‘fair share’ should be prepared to plot their ‘own course’, and complete the necessary work. How high each wants to rise, and how they get there is a matter of free will.

Don’t lecture me about fairness. As far as I’m concerned it would be fair to put debt ridden administrations, like this one, and their political minions away – in the nearest penitentiary. Yeah, 14 years would send a powerful message. You want to overspend and force me, my children and grandchildren into debt; then you should pay the ultimate price. You talk about a fair deal? Is it fair for the federal government to be sitting on its collective butt, borrowing $4 billion per day on “our” behalf? I say not. That’s why you can take your 2% payroll tax cut and shove it! Then you can get off the stump, cancel that vacation, curb government spending and balance our collective budget. Otherwise prepare to be ‘thrown’ out of office, and to inherit your just deserts.

Related:

National Debt Bomb | 1976 to 2011

Four More Trillion | Not Change

National Debt: A National Disgrace

Photo via: http://ibloga.blogspot.com/2009/02/new-one-trillion-dollar-bill.html