National Debt: A National Disgrace

Shovel Ready Debt

Who drove us into this ditch, again?

*By: Larry Walker, Jr.* [updated]

In the United States, the total debt outstanding as of September 30, 2010, stood at $13,561,623,030,891.70. It’s interesting to note that over the past 40 years, 69.1% of this debt is attributable to Democrat led congresses, and only 28.1% to Republicans. If we agree that the National Debt has reached the crisis level, then the question we must ask ourselves is, “Whom do I trust?” And before I go further, let me point out that I am neither a Republican nor a Democrat. I am a member of the Give Me The Damn Keys Back Party. No, actually I am a member of America’s Independent Party (AIP). Now, let’s check the record.

1971 to 1977 [Democrat Debt $249,514,293,050.07]

Carl Bert Albert represented Oklahoma’s 3rd congressional district as a Democrat for 30 years. He served as the 54th Speaker of the United States House of Representatives from 1971 to 1977. During his six-year term as Speaker, Mr. Albert added $249,514,293,050.07 to the national debt, which represented an increase of 67.3%.

1977 to 1987 [Democrat Debt $1,504,869,616,658.42]

Thomas Phillip “Tip” O’Neill, Jr. represented the 8th and 11th congressional districts of Massachusetts as a Democrat for 34 years. He served as the 55th Speaker of the House from 1977 until his retirement in 1987, making him the second longest-serving Speaker in U.S. history. During his ten-year term as Speaker, Mr. O’Neill added $1,504,869,616,658.42 to the national debt, which represented an increase of 242.6%.

1987 to 1989 [Democrat Debt $732,128,343,528.90]

James Claude Wright, Jr., usually known as Jim Wright, represented the 12th congressional district of Texas as a Democrat for 34 years. He served as the 56th Speaker of the House from 1987 to 1989. During his three-year term, he added $732,128,343,528.90 to the national debt, which represented an increase of 34.4%.

1989 to 1995 [Democrat Debt $1,835,318,949,826.00]

Thomas Stephen Foley represented Washington’s 5th congressional district as a Democrat for 30 years. He served as the 57th Speaker of the House from 1989 to 1995. During his five-year term as Speaker, Mr. Foley added $1,835,318,949,826.00 to the national debt, which represented an increase of 64.2%.

1995 to 1999 [Republican Debt $833,443,098,884.30]

Newton Leroy “Newt” Gingrich represented Georgia’s 6th congressional district as a Republican for 20 years. He served as the 58th Speaker of the House from 1995 to 1999, ending 40 years of the Democrat Party being in the majority. During his four-year term as Speaker, Mr. Gingrich added $833,443,098,884.30 to the national debt, which represented an increase of 17.8%.

1999 to 2007 [Republican Debt $2,980,780,890,317.61]

John Dennis “Denny” Hastert represented Illinois’s 14th congressional district as a Republican for 20 years. He served as the 59th Speaker of the House from 1999 to 2007. During his eight-year term as Speaker, Mr. Hastert added $2,980,780,890,317.61 to the national debt, which represented an increase of 53.9%.

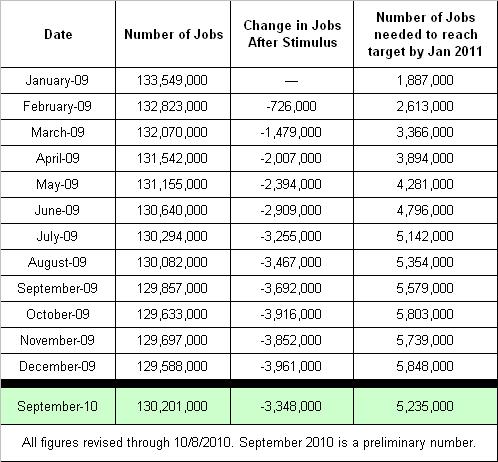
2007 to 2010 [Democrat Debt $5,054,649,131,676.47]

Nancy Patricia D’Alesandro Pelosi has represented California’s 8th congressional as a Democrat for 23 and one-half years. She has served as the 60th Speaker of the House since January 4, 2007. During her four-year term as Speaker, Mrs. Pelosi has added $5,054,649,131,676.47 to the national debt, which represents an increase of 59.4%.

Recap

Democrats have controlled the Congress for 28 of the last 40 years. Over this 40 year span, Democrat led congresses have added $9,376,480,334,739.86 to the national debt, which represents 69.1% of the total debt outstanding (as of 09/30/2010). In comparison, Republican led congresses have added $3,814,223,989,201.91 to the debt, which represents 28.1% of the total outstanding. In contrast, Nancy Pelosi is responsible for adding a grand total of $5,054,649,131,676.47, or 53.9% of the Democrats debt, and 37.3% of the total debt outstanding, in just four years.

During their 12 years of majority control, Republicans, Gingrich and Hastert added an annual average of $317,851,999,100.16 to the national debt. In contrast, in her short four-year term, Nancy Pelosi has added an annual average of $1,263,662,282,919.12. What Nancy Pelosi has done to this country in the last four years is nothing short of a national disgrace.

The question is which party do you trust to put a cap on our debt crisis: Democrat, Republican, or Independent?

Addendum: Harry Reid was sworn in as the 24th Senate Majority Leader at the same time that Pelosi became Speaker of the House, on January 4, 2007.

_______________

U.S. Constitution – Article 1 Section 7: “All bills for raising Revenue shall originate in the House of Representatives; but the Senate may propose or concur with Amendments as on other Bills.”

References:

http://www.treasurydirect.gov/govt/reports/pd/histdebt/histdebt.htm

http://en.wikipedia.org/wiki/Speaker_of_the_United_States_House_of_Representatives

MythBuster II: Has Obama Created More Jobs Than Bush?

Hmmm!

In Search of Private Sector Jobs

By: Larry Walker, Jr.

Without question, the majority of private sector jobs created in 2010 were created in the Service Sector. Understanding precisely where is quite revealing. After my last blog post, I received the following comments, from a blogger known as Patriot01: “Ever notice that they never say what KIND of jobs they’ve allegedly “created”? And I’d like an itemized list of the jobs “saved”………wouldn’t you?” Well, of course I would, wouldn’t you? Are you ready?

Education and Health Services

Drilling down into the numbers, we found that most of those jobs were created in the Education and Health Services sub-sector. Yet when we analyzed this sector, we found that job growth has been fairly constant, even throughout the recession. In fact, you can call this a recession proof sector (graph and table below).

Series Id: CES6500000001
Seasonally Adjusted
Super Sector: Education and health services
Industry: Education and health services
NAICS Code: –
Data Type: ALL EMPLOYEES, THOUSANDS

Education and Health Services

Under President Bush, job growth in this sub-sector averaged 465,000 jobs per year, even during the worst of the recession. So far under Obama, annual job growth in this sub-sector is averaging around 332,000. So although the industry has been virtually recession proof, the number of jobs created under Obama is on the decline.

Under President Bush a total of 3,720,000 jobs were added to this sub-sector during his eight-year term. And so far under Obama a total of 578,000 jobs have been created. In terms of percentages, during the Bush years the sub-sector grew at an average of 2.8% annually, while under Obama average job growth has cooled to 1.7%.

So does this look like anything remotely close to proof of the absurd statement that, “Obama created more jobs in 2010 than Bush did in eight years?” Not hardly. But there’s more.

Employment and Temporary Help Services

The other sub-sectors where we discovered job growth in 2010 were Employment Services, and more specifically Temporary Help Services. So far this year, we have recovered 228,000 jobs in Employment Services, and out of those, 218,000 were under the sub-category of Temporary Help Services (graphs and tables below). Add these to the 261,000 jobs created in the, recession proof, Education and Health Services sector, and together they account for 489,000 jobs “created” in the last nine months, or basically the whole enchilada.

Series Id: CES6056130001
Seasonally Adjusted
Super Sector: Professional and business services
Industry: Employment services
NAICS Code: 5613
Data Type: ALL EMPLOYEES, THOUSANDS

Employment Services

Series Id: CES6056132001
Seasonally Adjusted
Super Sector: Professional and business services
Industry: Temporary help services
NAICS Code: 56132
Data Type: ALL EMPLOYEES, THOUSANDS

Temporary Help Services

Busted Again!

So there it is, Obama’s greatest feat to-date is that he has managed to slow job growth in the Education and Health Services sector, which has always been recession proof; and he has only managed to recover jobs in the Temporary Help Services sub-sector. And this, his cohorts call a great success? Those of us who are rationally-minded beg to differ.

We wonder how long our economy can sustain itself through providing temporary job search services, especially when the type of jobs people want no longer exist. Meanwhile, our non-existent Goods-Producing sector has hemorrhaged 6,524,000 jobs over the last 10 years, and nothing is being done about it. Where are those jobs? In China.

Charts and Tables from the Bureau of Labor Statistics, Establishment Data, Table B-1 (here).

MythBuster: Has Obama Created More Jobs Than Bush?

Hmmm!

Rational or Ridiculous

by: Larry Walker, Jr.

So the latest spin by the left-wing media and the White House is to repeat the following mantra, “Obama created more jobs in 2010 than Bush did in eight years.” However, how much sense does it make to compare an arbitrary nine-month period for Obama to a full eight-year term? Well none, none at all, at least not within the realm of rational human thought. For those of us who are rationally-minded, we will begin with the month that Obama took office, and compare his full term to-date with whomever.

Turning to the Bureau of Labor Statistics (BLS), when we added up the total number of private sector jobs created during Obama’s short twenty one month tenure, we found that a total of 2,991,000 jobs had been lost (110,961,000 – 107,970,000). Oops!

Private Sector Jobs 2009/2010

Total Private Sector Employment (Bureau of Labor Statistics)

Private Sector Job Growth (Loss)

Busted!

Although I too could cherry-pick and find periods where private sector job growth was up by 4 or 5 million under Bush, I choose to remain among the rational. Needless to say, private sector job growth was at least slightly positive over Bush’s eight-year term, while under Obama, the words – worst track record in history – come to mind.

Is there no shame?

Also see: Tracking the 3.5 Million Jobs Obama Saved or Created and Deceptive Claim from Obama & The Democrats or Obama’s New Reality: Black Unemployment

Dismantling Nancy Pelosi

Nancy Pelosi (D-CA)

Common Sense and Opportunity Cost

By: Larry Walker, Jr.

According to the Speaker of the House of Representatives, Democrat, Nancy Pelosi, “For every dollar a person receives in food stamps, $1.79 is put back into the economy. It is the biggest bang for the buck when you do food stamps and unemployment insurance. The biggest bang for the buck.”

It’s the biggest bang for the buck versus what? There is a basic concept in economics known as opportunity cost, which teaches us that for every choice we make, there is a cost which is related to the next-best choice available. In other words, if unemployment and food stamps provide the biggest bang for the buck, does that mean it’s better to be unemployed than employed? Let’s put this under the microscope.

Joe the Salesman generates commission income for his company of 5% of the amount of sales produced. Out of the income generated for the company, Joe receives a cut of 50%. Let’s assume that Joe personally makes gross pre-tax commission income of $50,000 in a year. In order to generate this income Joe’s sales must have been $2,000,000 for the year. The company Joe works for receives commission income of $100,000 and pays Joe his cut of 50%, or $50,000.

What has Joe produced? Joe has contributed a total of $2,000,000 in economic activity in order to earn his pay. This $2,000,000 will multiply throughout the economy vertically and horizontally through related businesses and suppliers. Joe earns his keep and is a productive member of society.

Now let’s look at Joe after he has been laid off and becomes a recipient of unemployment benefits and food stamps:

Joe is now on unemployment and he receives $15,800 per year in unemployment benefits and $5,000 in food stamps. Joe produces nothing to receive this income. Sure, Joe still spends all of his money on rent, food and the basic necessities, but the multiplier effect can only be calculated on the $20,800 that Joe receives and spends. The unemployment checks that Joe receives are generated from unemployment insurance payments made by his former employer, leaving the employer with less money to work with, as well as a smaller amount of sales and productivity. The food stamps he receives are funded by taxpayer dollars, which are currently paid for by money, which is being borrowed by the federal government. [Note: When congress chose to extend unemployment benefits for up to 99 weeks, the added cost was also deficit-financed.]

So if we are talking about the multiplier effect, then which Joe has the greatest impact, the working Joe, or the unemployed Joe?

Assuming that Nancy Pelosi was correct in her statement that, for every dollar spent on unemployment insurance and food stamps $1.79 is added to the economy, and assuming that the same multiple applies to the private sector, which sector will provide the biggest bang for the buck?

Working Joe produced $2,000,000 in gross sales, so he will have added $3,580,000 in economic activity.

Unemployed Joe produced nothing, but did consume $20,800 worth of goods and services. However, out of this, $15,800 was taken from his former employer, and $5,000 from taxpayers, which reduced their consumption dollar-for-dollar. In effect, unemployed Joe took $20,800 from another working Joe and spent the other working Joe’s money. But the other working Joe would have spent or invested the same money anyway. Thus, in my opinion, the multiplier effect of unemployed Joe is zero, since just a different Joe is spending the same money.

To make matters worse, not only is the unemployment and food stamps multiplier zero, it is negative, in my opinion. Why? Because of the fact that unemployed Joe’s food stamps and part of his unemployment benefits were paid for with deficit-financed money. Generations of working Joe’s across the country will be paying interest on this debt, through higher taxes, for years to come and eventually will have paid more than twice the initial amount in principal and interest payments. On top of this, Joe’s former employer is on the hook for higher unemployment insurance premiums, which could have been invested or spent to create additional jobs.

Lesson: All private sector employees produce more than they are paid, that’s the whole point. Unemployed persons produce nothing and merely spend dollars that would have been spent or otherwise invested more productively. The biggest bang for the buck is achieved through implementing government policies, which promote private sector growth, not through unemployment insurance and food stamps.

Who Obama Fears

Yuck!

Sanity – You want a different result? Try something different.

By: Larry Walker, Jr.

I hear that Obama thinks that voters are afraid. Afraid of what? This mug on the left? Ha Ha! Not.

I’m not afraid Mr. Obama. I’m a little bit sick and tired of seeing your face and hearing your disingenuous rhetoric, but I’m not afraid. I’m pissed off that while I’ve been working, starting and growing a business, and trusting that folks in Washington were doing their jobs, I came to find out they were not.

Anyone foolish enough to think that the financial crisis, the entitlement crisis, the national debt crisis, and most of our others problems started ten years ago, must have either been born then, or is under 20 years old (too young to know). Come on, our problems started ten years ago? That’s a straight up lie. A big chunk of the problem lies in the folks below, the ones Obama fears.

The Problem

Guilty!

  1. Barbara Boxer – Congress 10 years, Senate 18 years = 28 years
  2. Harry Reid – Congress 4 years, Senate 24 years = 28 years
  3. Nancy Pelosi – Congress 24 years
  4. Barney Frank – Congress 30 years

It’s naive to say that Bush and the Republicans caused all of our problems, since Bush was only in office for 8 years, while Boxer, Reid, Pelosi, and Frank have all been in Congress for over 20 years. And what have they done? Here’s the short list – They ran up the national debt, exploded entitlement spending, crashed the financial markets, brought on the recession (no Harry Reid didn’t do it alone), left us vulnerable on 9/11/2001, got us into a war – then reneged, and enriched themselves at taxpayers expense.

The Solution

The only way Obama will achieve any semblance of success is for us voters to remove these slackers and replace them with folks who want the same things that Obama wants. And what was it that Obama said he wanted? A balanced budget, real health care reform (not the present disaster), a strong economy, jobs, transparency, and bipartisanship – to name a few. Well, Democrats controlled both houses and couldn’t get the job done. They couldn’t agree among themselves on anything other than blaming Republicans for their own failures. So we’re going to do you a favor. We’re going to remove most of them from power, but especially these four. This is your opportunity to practice true bipartisanship. If you want Obama to succeed you’ll get aboard.

Voters are afraid? Come on. Get honest. Obama is afraid. He’s only been in D.C. for 6 years at best. Obama isn’t running anything, he’s just taking orders from the above. He’s also afraid that people will really start holding him to his promises, and these four have done nothing but stand between him and his true potential.

Sorry but time’s up. It’s up to us. That’s the deal. Voters will be doing Obama a favor by running these bums out of power.

_____________________________________________

U.S. Constitution – Article 1 Section 7 : “All bills for raising Revenue shall originate in the House of Representatives; but the Senate may propose or concur with Amendments as on other Bills.”

Tracking the 3.5 Million Jobs Obama Saved or Created

Abuse

“Tracking the 3.5 million jobs Obama will save or create.”

By: Larry Walker, Jr. [Revised 10/15/10]

That was the title of a blog post, last updated on January 8, 2010, by Understanding The Market – Capire Il Mercato. In a note, the author, Cole Kendall stated, “I will make the calculations in a way that provides a “best case” to the Obama team.” Since Mr. Kendall decided to give up on his tracking operation at the end of 2009, I decided to finish it off.

Using the same criteria as outlined by Obama’s (now former) economic team, jobs are defined by taking the “Establishment Data” figure from Table B-1 [seasonally adjusted] of the Bureau of Labor Statistics – Employment Situation Report. Instead of boring you with the month-by-month data for 2010, I went ahead and cut to the chase, skipping from December of 2009 – where Mr. Kendall left off, to September of 2010 – the latest data from the 10/08/2010 report.

Following is an excerpt from the original blog post:

In an earlier essay I tried to explain President Obama’s notion of saving or creating jobs. The stimulus plan bill was passed by both houses of Congress last night and the final plan was a bit smaller than the earlier version, so the President now asserts that the plan will save or create 3.5 million jobs.

This post will track the 3.5 million jobs. There are a number of ways to measure jobs in the US. Some people work several different jobs at a time while others change employers frequently, so measuring jobs is not as simple as it might seem. There was a cartoon from the Clinton era showing the President speaking at a dinner that he had created 8 million jobs and an overworked waiter thinking that he had three of them. Obama’s economic team define jobs as use the payroll data (see here for their original report).

Just before the stimulus bill passed the Department of Labor issued a report (see here). The number of people working (see Table B1, about 2/3 of the way down, with the heading “Establishment Data”) was 134,580,000 (seasonally adjusted). This is a preliminary measure and will be revised next month and probably revised again in a year. Using the Obama team methodology, without the stimulus bill employment would be expected to fall by around 1,613,000 jobs during the next two years so that without the stimulus bill we would expect employment to be 132,967,000 in January 2011.

With the revised estimate of 3,500,000 jobs “saved or created”, employment should be 136,467,000, creating 1,887,000 in addition to the 1,613,000 jobs saved.

[Note: I have revised the table’s format, to make tracking easier.]

The table below will be updated with every new employment release to see how jobs have changed. The first column is the actual number of payroll jobs starting with the month before the stimulus plan passed; the second column is the total change in employment since the month when the stimulus plan passed and the third column shows the gap remaining of jobs to be “created” in order to reach the target.

[Chart Revised through 10/08/2010]

Revised: Stimulus Jobs Created or Saved - Click to Enlarge

The conclusion is pretty grim, and certainly doesn’t mesh with what Obama has been saying out on the campaign trail. The sad truth is that instead of creating 3.5 million jobs since the stimulus plan was passed, the plan has resulted in the loss of 3.3 million jobs. Since the stimulus plan was supposed to save 1,613,000 jobs in addition to creating 1,887,000 jobs, and since it actually resulted in the loss of 3,348,000 jobs, it would now take the creation of 5,235,000 jobs, by January of 2011, to reach the original target.

I don’t know what you call this, but I call it a failure. It’s so bad that most people simply stopped tracking it. So do we need another stimulus plan, or another Congress, Senate, and ultimately President? I don’t think it helps having Obama roam around the country making false claims in an effort to re-elect the same folks who screwed this up. The thought of $887 billion of deficit-financed spending flushed down the drain doesn’t bode well for those who supported it.

You can fool some of the people all of the time, and all of the people some of the time, but you can not fool all of the people all of the time. ~ Abraham Lincoln (R-Il)

New Table B-1 Data: http://stats.bls.gov/webapps/legacy/cesbtab1.htm

Chart Per BLS 10/8/2010

BLS Table Revised 10/8/2010

Other Sources:

http://stats.bls.gov/news.release/empsit.t17.htm

http://understandingthemarket.com/?p=63

Obama’s New Reality: Black Unemployment

Zilch

Excuse Me. You created how many jobs?

By: Larry Walker, Jr.

Yesterday, while Mr. Obama was shouting at a childish crowd in Philadelphia, which included streakers and book throwers, he mentioned something about he and Joe Biden having created 3 million jobs in the last nine months, or some foolishness. So we decided to visit the Bureau of Labor Statistics (BLS) to see how well he has performed among Black or African Americans.

The charts and tables that follow were produced on the BLS website (here). You may click on each to expand the view.

Number of Unemployed

In January of 2009, 2,278,000 Black Americans were unemployed. By the end of 2009 the number had grown by 565,000 to 2,843,000. By the end of September of 2010, the number stood at 2,860,000. Thus, the number of unemployed Black or African Americans increased by 17,000 over the last nine months, which differs greatly from Obama’s account.

Seasonally Adjusted
Series title: (Seas) Unemployment Level – Black or African American
Labor force status: Unemployed
Type of data: Number in thousands
Age: 16 years and over
Race: Black or African American

Unemployment Rate

The unemployment rate among Black or African Americans was 12.8% at the beginning of 2009, and grew by 3.4% to 16.2% by year-end. From December of 2009 through September of 2010, the rate has decreased by a whole tenth-of-one-percent to 16.1%. That seems hardly worth bragging about.

Seasonally Adjusted
Series title: (Seas) Unemployment Rate – Black or African American
Labor force status: Unemployment rate
Type of data: Percent or rate
Age: 16 years and over
Race: Black or African American

Not In Labor Force

Meanwhile, the number of Black or African Americans who have dropped out of the labor force continues to soar. The number that bailed out increased by 526,000 in 2009, from 10,311,000 in January to 10,837,000 by the end of the year. In 2010, the number has continued to expand by another 203,000, from 10,837,000 in December of 2009 to 11,040,000 by September. And you call this a great achievement?

Seasonally Adjusted
Series title: (Seas) Not in Labor Force Black or African American
Labor force status: Not in labor force
Type of data: Number in thousands
Age: 16 years and over
Race: Black or African American

So the Party of Food Stamps has delivered exactly the opposite of what it said it would: no pay checks, more food stamps, more welfare checks, and a near permanent extension of unemployment benefits. It’s time to end the disinformation and get honest. It’s time to stop shouting and start listening. And folks, it’s time to wake up and stop believing the lies.

Reference: Jobs created during U.S. presidential terms

The Pelosi Effect: Mis-, or Disinformation

Multiplier Effect

Rational Expectations vs. Obamanomics

By: Larry Walker, Jr.

“For every dollar a person receives in food stamps, $1.79 is put back into the economy.” ~ Nancy Pelosi (D – CA)

In Economic theory, the multiplier effect is a measure of how an increase in spending produces an increase in national income and consumption greater than the initial amount spent. For example, if a corporation builds a factory, it will employ construction workers and their suppliers as well as those who work in the factory. Indirectly, the new factory will stimulate employment in laundries, restaurants, and service industries in the factory’s vicinity.

Keynesian economists generally calculate multipliers that measure the effect on aggregate demand only. They blindly ignore the negative effects that their policies create in other parts of the economy, such as the effect that government borrowing has on the private sector, and the psychological effects on the general public.

According to the theory of rational expectations, it is impossible to calculate the effect of deficit-financed government spending on demand without specifying how people expect the deficit to be paid off in the future.

Thus, Nancy Pelosi’s rant, that “For every dollar a person receives in food stamps, $1.79 is put back into the economy”, and that, “It is the biggest bang for the buck when you do food stamps and unemployment insurance,” was nothing but pure disinformation (with a capital “D”). It’s disinformation because she purposefully omits the fact that the money being doled out is all deficit-financed. It is impossible to calculate the effect of deficit-financed government spending on demand without specifying how people expect the deficit to be paid off in the future.

Back in February of 2009, Justin Wolfers, a professor of business and public policy at Wharton, attempted to explain how the multiplier effect would work with Obama’s (failed) Stimulus Plan.

At the time, Mr. Wolfers said that Obama’s economic experts were estimating the multiplier would be 1.6 times the initial amount. He continued, “The administration’s talking about spending almost a trillion dollars. It’s hoping that’ll generate $1.6 trillion throughout the economy.” But Wolfers then cautioned that, “no one’s sure that’ll happen”.

In his conclusion, Mr. Wolfers stated, “In order to fund that bridge the government’s going to have to borrow money. If the government’s borrowing money it may be that there’s less money available for the private sector to borrow. And taking money out of the mouths of the private sector will crimp growth, which isn’t multiplying anything.”

It’s curious that the multiplier effect touted by the Democrats as justification for their failed stimulus plan was only 1.6 (i.e. for every dollar spent, $1.60 would be put back into the economy), and that was to be achieved by repairing roads, and bridges, etcetera. And now here comes Nancy Pelosi making the clueless proclamation that government spending on unemployment insurance and food stamps will have an even greater multiplier of 1.79.

What gives?

Did it work with the Stimulus? Nope.

Will it work with unemployment benefits and food stamps? Nope.

Is this my new reality? Not for long honey.

It appears the Democrats have given up ‘hope’ on job creation; I mean, since they now believe they can get more bang for the buck by simply paying folks not to work. In fact, according to Nancy Pelosi it will yield, “The biggest bang for the buck”.

Misinformation is false or inaccurate information that is spread unintentionally. It is distinguished from disinformation by motive in that misinformation is simply erroneous, while disinformation, in contrast, is intended to mislead. So was this mis-, or disinformation?

The time for change has come. Remember in November.

Addendum: It should also be noted that food, clothing and shelter are not discretionary items, and that discretionary spending is what drives our economy. Thus, the Pelosi Effect fails on all counts.

Obama’s Unfunded Consumption

Print More Money

Federal Budget FY ’08 vs. ’10

By: Larry Walker, Jr.

“Knowledge is an inherent constraint on power.” ~ Thomas Sowell

Between fiscal years 2008 and 2010, federal government revenues have declined by $359 billion (-14.2%), and government spending has increased by $738 billion (+24.7%), thus leaving a 38.9% hole in the federal budget. In fact, in this fiscal year alone, our public masters will spend a total of $3.7 trillion while taking in a mere $2.2 trillion, which means that the Congress is spending 71.8% more than it is bringing in.

Do you think this might be a problem? If not, stop reading, and just vote for the nearest politician promising: more of the same. But if so, then how do we close the gap?

One way would be to raise taxes on the “rich”, which would bring in around $700 billion over the next 10 years, or $70 billion per year. But under this half-baked plan, it will take 10 years just to pay for this years’ increase in spending ($738 billion), and it won’t even put a dent in our future estimated deficits ($1 trillion per year), nor the national debt which is currently $13.5 trillion (tic, toc, tic, toc, tic, toc….). In fact, with the national debt growing at approximately $100 billion per month, the prospect of robbing the most productive citizens (i.e. small business owners) of an additional $70 billion per year doesn’t really amount to a hill of beans.

Common sense ought to tell us that unless either government revenue is raised by more than 71.8%, or federal spending is cut by the same, we will never again see a balanced budget, nor will we ever begin to put a dent in our ever growing national debt. So let’s be real about it, when the economy is growing at 1.9% (i.e. not growing), the federal government has no basis for creating a spending gap of 71.8%.

Is all of this spending necessary? Do you even know where our money is going? Let’s look at some of the key areas of concern, line by line (since Obama won’t). I am not going to go into a lot of detail on each item today, the objective is simply to highlight some key areas of concern.

First, there is the budget function known as ‘undistributed offsetting receipts’. Note that revenues from ‘rents and royalties on the outer continental shelf’ has declined by $14.7 billion, or -80.7%. Overall this area represents $6.5 billion of the current budget deficit. So did we stop charging fees for offshore drilling, stop drilling, or both? How will we make up the shortfall?

Next is the area known as ‘allowances’. Allowances? We are adding $18.7 billion to the budget for ‘Health Reform’, the so called ‘Jobs Bill’, and for ‘future disaster costs’ at a time when there is already a $13.5 trillion national debt, and a $1.5 trillion budget deficit. How are we paying for this?

Next is the area known as ‘general government’. Do we really need to increase the budget for ‘general government’ by 44.1% at a time when government revenues have declined so dramatically. Of note, the amount spent on ‘general property and records management’ has increased by $1.5 billion, or 276.8%? Why are the amounts spent for ‘central personnel management’ being increased by 1566.7%; ‘general purpose fiscal assistance’ by 71.4%; and ‘other general government’ by 267.1%? The unfunded growth of general government adds another $8.9 billion to the deficit.

Moving on to ‘Energy’, we find an increase in the deficit of $18.3 billion, or 2,917.8%. Under ‘energy supply’ we have moved from a $418 million surplus, to an $8.8 billion deficit. Why? Does a change of 2,210.3% raise a red flag? And at the same time, we have increased the amount spent for ‘energy conservation’ by $8.7 billion, or 2,147.4%. Why? Overall, ‘energy’ represents an unfunded budget increase of $18.3 billion.

And then there’s the area of ‘income security’ where spending has increased by $254.5 billion, or 59.0%. I understand that there are certain mandatory items that may be somewhat necessary, but here we see that ‘unemployment compensation’ has increased by $148.9 billion, or 328.5%, and that ‘housing assistance’ has increased by $36.4 billion, or 89.8%. ‘Food and nutrition assistance’ has also increased by $38.5 billion, or 63.6%. Although most Americans are sympathetic, the question is — Where is the extra $254.5 billion coming from?

Then we come to the area of ‘health’ where spending has increased by $91.7 billion, or 32.7%. We see that the amount spent for ‘health care services’ has increased by $87.5 billion, or 35.3%. And the amount spent on ‘consumer and occupational health and safety’ has increased by 47.7%. Also included is ‘Medicare’ spending which has increased by $66.4 billion, or 17.0%. Again, the question is — How are we going to pay for it?

Next, in looking at the area of ‘education, training, employment, and social services’ we notice a dramatic increase in spending of $51.2 billion, or 56.1%. Although there may be a desire to increase spending on ‘elementary, secondary, and vocational education’, a growth rate of 116.1% over 2008 levels is simply reckless. Let’s hope that our children are learning something valuable such as, “do as we say, not as we do”.

Then comes the area of ‘transportation’ which represents an increase in spending of $28.8 billion, or 37.2%. And we will pay for this by _______?

Next is the area of ‘agriculture’. We are pouring an additional $8.2 billion, an increase of 44.7% into ‘farm income stabilization’, and ‘agricultural research’ while at the same time turning the San Joaquin Valley into a dust bowl. Notice the words ‘income stabilization’ (i.e. get paid to do nothing).

Then there’s the area of ‘natural resources and environment’ which represents an increase of $15.2 billion, or 47.8%. Although there’s some important stuff here, namely ‘water resources’, the question worth asking is: Why the big increase now, when we can ill afford it?

And lastly, there’s the area known as ‘international affairs’. We have increased spending overseas by $22.3 billion, or 77.2%. While some politicians falsely accuse other politicians of exporting jobs overseas, the federal government is itself guilty of exporting $51.1 billion of our future earnings overseas. Never mind that we can’t afford it, we have increased funding for ‘international development and humanitarian assistance’ by $12.5 billion, or 88.5%; ‘conduct of foreign affairs’ by $2.9 billion, or 27.5%; and gone from a surplus on ‘international financial programs’ to a budgetary drain of $6.5 billion, or a change of 101.7%. Again, who’s paying for this?

In conclusion, the federal government has created a 71.8% gap in its ‘fiscal year 2010 budget’, by increasing its own spending faster than any other growth rate on the planet. With U.S. economic growth at a mere 1.9%, it doesn’t take a genius to figure out that we have a problem. The problem is out-of-control spending. No viable entity can spend money at a higher rate than it brings it in, and stay in business for very long. But, the U.S. Congress is not a viable entity. This congress is already $13.5 trillion in debt, and is currently on pace to spend 71.8% more money in FY 2010 than it will take in. It’s time for this to end.

Government spending cannot and should not ever increase faster than either revenue growth, or the rate of inflation. Between 2008 and 2010, the annual rate of inflation was only 1.4%, and as stated above, government revenues declined by -14.2%. From a fiscally responsible standpoint, what justification was there for increasing government spending by 24.7%, and for outspending revenues by 71.8%?

Talk is cheap. Step 1: Get Honest. Step 2: Cut Spending.

Sources:

http://www.gpoaccess.gov/usbudget/fy11/sheets/hist03z2.xls

http://www.gpoaccess.gov/usbudget/fy11/sheets/hist02z1.xls

A Conservative Proposal for Economic Recovery

Perfection

Perfected by Addressing Our Enormous Trade Deficits

By: Howard and Raymond Richman

With the U.S. federal budget spiraling out of control due to Keynesian policies that are not even making a dent in unemployment, America is hungry for fiscally responsible economics. Mostly, what we hear from conservatives is the supply-siders’ recommendations of more tax cuts, like the ones that made the budget deficits much worse during the GWBush years. But there is a fiscally-conservative school of economics: the monetarist school founded by Milton Friedman, the dissertation advisor of one of us (Raymond).

Monetarism recommends balanced monetary growth and balanced budgets in order to attain stable economic growth and avoid inflation and big recessions. It keeps long-term growth in mind while taking short-term economic fluctuations in stride.

On September 16, several conservatives with huge Republican-establishment credentials, proposed a monetarist solution to the current malaise in an op ed that nearly took up a full page in the Wall Street Journal. George P. Shultz (former Treasury Sec’y), Michael J. Boskin (Chair Council of Economic Advisors under first Bush), John F. Cogan (former Dep Director of Mgt and budget under Reagan), Allan Meltzer (prof of econ at CMU and reknown expert on Federal Reserve history), and John F. Taylor (prof of econ at Stanford and undersec’y of Treas under GWBush), outlined their “Principles for Economic Survival.” In general, it was an excellent exposition of fiscally conservative policies for economic recovery. Unfortunately, it wouldn’t work.

Shultz et al. are right in their claim that America’s anemic economic recovery has “largely been driven by economic policies that have deviated from proven fact-based principles.” They argue that people respond to incentives and disincentives, citing the work of Nobel-prize-winner, Prof. Edward C. Prescott, who showed that as a result of higher taxes on earnings imposed in Europe from the 1970s to 1990s, (up 28% in Germany, France and Italy), hours worked fell by an average of 22%. And they point out how reckless Congress was and continues to be with huge sums wasted in support of banks and enterprises like GM, Chrysler, Fannie Mae and Freddie Mac. And they correctly point out the waste involved in the rebates of both the GW Bush and Obama administrations.

Unfortunately they say nothing about policies that would correct the enormous trade deficits that have cost the U.S. millions of manufacturing jobs, worsened the distribution of income, and made our current declared enemy, China, strong. American corporations find it very profitable to outsource their production to countries like China and have little incentive to invest at home.

We believe we should make balanced trade our policy, not free trade. We consider ourselves conservatives but it is not necessary to believe in free trade which is not economics but ideology as we have shown in our book, Trading Away Our Future (Ideal Taxes Assn, 2008) and repeatedly since then.

They blame the policy of low interest rates, embraced by the Fed under Greenspan and Bernanke, for stimulating the housing bubble but fail to mention that the low U.S. long-term interest rates were not caused by the Fed, but by the forced inflow of financial savings from the governments practicing currency manipulation as part of their mercantilist policies, designed to perpetuate trade surpluses with the United States. In fact, they completely ignore trade, apparently not realizing that President Obama’s Keynesian policies are failing due to his failure to control the trade deficit.

The fact is that neither Keynesianism, nor supply-side economics, nor monetarism will work in a country whose trade deficit is being manipulated by foreign governments. On the other hand, as we noted in the American Thinker (Keynesian borrowing won’t solve our economic problems), the strategy of monetarism (balanced monetary growth combined with balanced budgets) would produce stable growth if a new balanced trade rule is added, producing what we call balanced trade monetarism. We wrote:

The new balanced trade rule is necessary in order to respond to modern mercantilism, the economic policy that maximizes exports and minimizes imports in order to gain market share from trading partners. The latest evidence is the increase in China’s subsidies to exporters which has not yet evoked a response from the U.S. government even though China exports four times as much as it imports from the United States and promised to forego export subsidies when it joined the WTO.

China and the other mercantilist governments have been perpetuating and increasing the U.S. trade deficits by buying U.S. financial assets with the dollars earned from their trade surpluses with the United States. For over a decade, American banks passed along the flow of foreign savings to American consumers, offering ever-riskier loans in order to get a high return. But when American consumers could no longer afford the payments, banks went bankrupt and the resulting hole in worldwide demand is causing the worldwide recession.

If the U.S. government switched to balanced trade monetarism, the U.S. could quickly recover since there would be plenty of demand for American products if foreigners bought as much from the U.S. as the U.S. buys from them.

Shultz et al. accuse Greenspan and Bernanke of expanding the money supply overly much, causing the overly-low long-term interest rates that caused the house price bubble. This is simply not true. In fact, for much of the 1998-2006 period of the bubble, the monetary base (M1) was declining, and throughout the period, inflation was low. The Fed only controls short-term rates, not long-term rates. And the overly-low long-term rates were directly caused by the inflow of foreign savings that accompanies unbalanced trade.

While it is true that the Fed could have taken leadership to get the federal government to insist upon balanced trade, they could not have counteracted the actions of the mercantilist central banks by themselves. For example, they could not have purchased Chinese RMB, to counteract the People’s Bank of China’s purchase of dollars, because they did not have access to those RMB, and if they had found a way to purchase them, the Chinese central bank would not have let them buy Chinese long-term bonds, which are off-limits to foreigners. The Chinese government is fine with its central bank purchasing American bonds, but does not permit reciprocity.

Other than that, Shultz et al. were quite good in their recommendations. Like us, they opposed the arbitrary bailouts of banks and other financial institutions, the massive purchases of long-term debt by the Fed, the temporary stimuli like the 2008 tax rebate and 2009 Economic Recovery Act, cash for clunkers, credits for first-time home buyers, and the health care bill which imposed taxes on savings and investment. They denounced the complex regulations in the 2010 financial reform bill which were left to administrators to spell out, transferring legislative powers to the executive. They denounced the increased federal spending which grew as a percent of GDP to 24% currently, up sharply from 18% in 2000.

How do they propose to grow the economy?

First, they call for a moratorium on changes to the tax code, although they admit that U.S. economic problems are partly caused by our overly high corporate income tax.

Second, they advocate balancing the federal budget by reducing spending, including rescinding unspent TARP and stimulus funds, canceling the subsidies in the health care bill, restoring the Constitutional role of the states and the Constitutional limits on the powers of the federal government.

Third, they advocate reducing the growth of Social Security and health-care entitlements. They urge more costs by the patient when making health care purchases, more health plan options, and more competition. They would start by repealing the new health care law.

Fourth, they advocate that there be a three year moratorium on new regulations of businesses. They advocate closing down, not bailing out, Fannie Mae and Freddie Mac.

Fifth, they urge that monetary policy should be more rule-like. The Fed should announce and follow its rules, including a new rule for pesting its portfolio of mortgage-related securities.

These proposals are all reasonable. But then they show a woeful misunderstanding of international economics. They advocate a combination of fixed exchange rates and every country agreeing to target for inflation. Do they really think that trade flows are determined by differences in inflation (i.e., purchasing power parity)? Do they not understand that exchange rates are determined by supply and demand in currency markets and that the mercantilist countries manipulate those markets so that they get manufacturing investment while we do not? Do they not understand that when a country gets more investment than its trading partners, its currency should strengthen, whether or not it has inflation? The following graph, shows the low level of U.S. manufacturing investment over the last decade which has caused the U.S. trade deficit to grow despite a falling dollar since 2003 and our low rate of inflation:

Their advocacy of a multilateral agreement to control inflation is more of the internationalism that is killing the American economy. America has the ability to solve its economic problems without requiring a world government. All we have to do is to insist on balanced trade using the scaled tariffs that we recommend, which would be authorized by a special WTO rule for trade deficit countries. Such tariffs are scaled to the size of each of our trade deficits with each mercantilist country and would last only as long as trade with a particular country remains unbalanced.

Shultz et al. are on the right track. Like us, they believe that economic stability is best maintained through a combination of balanced monetary growth and balanced budgets, but, unlike us, they have not yet figured out why the Fed’s balanced monetary growth policy has not worked since 1998. As a result, they have not figured out that a third plank needs to be added in order for monetarism to work in the presence of mercantilism, not just balanced monetary growth and balanced budgets, but also balanced trade.

Source: Richmans’ Trade and Taxes Blog