Real Effective Tax Rates | Romney’s versus Obama’s

Content of Character ::

According to a report released by the Tax Foundation, an effective federal tax rate of 14.0% is higher than what 97 percent of Americans pay.

– By: Larry Walker, Jr. –

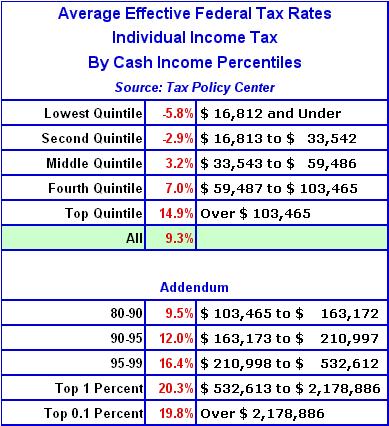
And according to The Tax Policy Center, the average effective federal tax rate for all Americans, as a percentage of cash income, was only 9.3% in 2011. Those in the Top 20 Percent (with incomes over $103,465) paid an average of 14.9%, while those in the Bottom 20 Percent (with incomes below $16,812) received back refundable tax credits averaging 5.8% of their incomes.

Within the Top Quintile, the Top 1 Percent paid an average rate of 20.3%, while the Top 0.1 Percent paid an average of 19.8%. It’s important to note that these are averages, which means that within each quintile some pay more than the average and others less. But overall, since the average effective federal tax rate for all of America is 9.3%, this represents a kind of minimum benchmark. What’s your effective federal tax rate?

Under the traditional model, in 2011, Mitt and Ann Romney paid an effective federal tax rate of around 14.0% (see definitions at the end), while Barack and Michelle Obama paid 17.8% (see table below). So does that mean the Obamas are more patriotic? Before you answer that, consider that the Romneys paid a total of $1,912,529 in federal income taxes, versus the Obamas $150,253. So does this give the Romneys the upper hand?

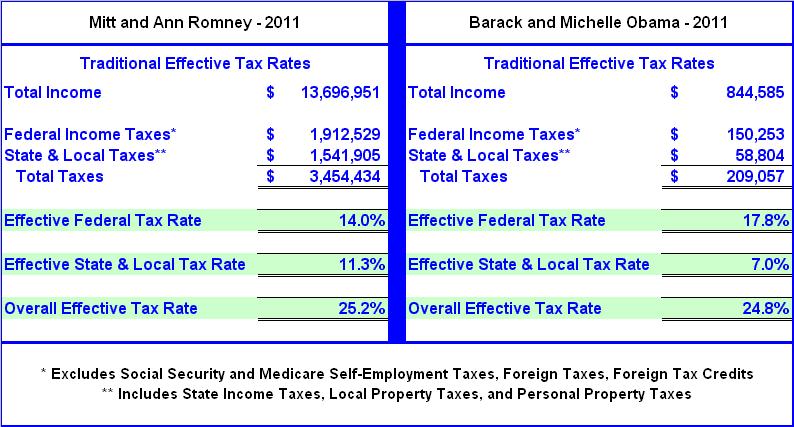
Digging a little deeper, it turns out that the Romneys paid an effective state and local tax rate of 11.3%, compared to the Obamas 7.0%. The Romneys also paid $1,541,905 in state and local taxes, compared to the Obamas $59,804. Shouldn’t state and local taxes be counted as well, since they are, after all, taxes? Yes, of course.

So when all taxes are on the table, the Romneys overall effective tax rate was 25.2%, compared to the Obamas 24.8%. And, the Romneys paid a total of $3,454,434 in federal, state and local taxes, versus the Obamas $209,057. So in light of these facts, is one of the two presidential candidates better suited for the Oval Office than the other? Is one a tax deadbeat and the other a saint? If a presidential candidate’s effective tax rate matters, then this election should be a toss up. But if it doesn’t, then Barack Obama’s entire – fair share monologue – is nothing but rubbish. The question is – what really matters?

Real Effective Tax Rates

Perhaps a more suitable measure of patriotism may be found in one’s real effective tax rate. One way of lowering U.S. tax liabilities is through charitable giving. When gifts are given to charity, the taxpayer no longer controls the assets, and so is granted a deduction against his (or her) taxable income of as much as 50% of adjusted gross income. Depending upon one’s marginal tax bracket, the tax savings may be as high as 35% of the amount given.

What happens to the money once it has been gifted? It gets spent by recipient organizations on salaries and wages, goods and services, real property, or is otherwise invested toward its charitable endeavors. Thus, charity is wealth redistribution, or if you will, a type of voluntary taxation. I would add that charitable giving is a much more efficient means of spreading the wealth than the U.S. government’s wasteful method, which after a certain limit may be summed up as little more than legalized robbery.

In 2011, the Romneys gave away $4,000,000, or about 29.0% of their income, although they only chose to claim a tax deduction of $2,250,772. The Obamas donated $172,130 or about 20.0% of their income. When we add this voluntary taxation to the total amount of taxes paid, we find that the Romneys paid a real effective tax rate of 54.4%, compared to the Obamas 45.1% (see table below).

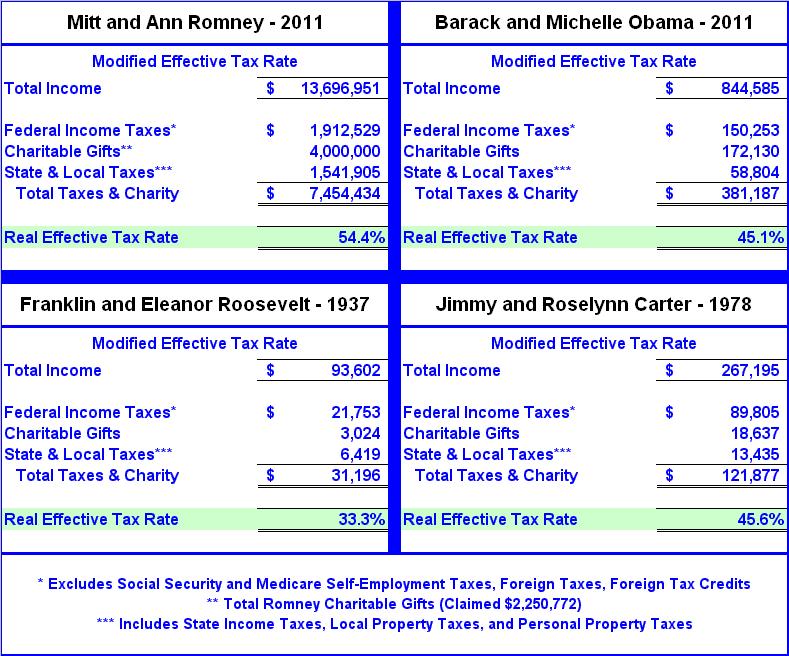
Just to add some perspective I included data from the Roosevelts and the Carters tax returns (above). It’s interesting to note that in 1937, Franklin and Eleanor Roosevelt donated $3,024, or only about 3.2% of their income, while in 1978, Jimmy and Roselynn Carter gave away $18,637, or about 7.0%. When we add the amount of the couples voluntary taxation through charitable gifts, to the total amount of taxes paid, we find that the Roosevelts paid a real effective tax rate of 33.3%, compared to the Carters 45.6%. So was FDR a slacker? Was Jimmy Carter slightly more patriotic than Obama? And isn’t Mitt Romney a better man than them all?

Note: The Roosevelts income of $93,602 in 1937 is equivalent to $1,504,178 today, while the Carters income of $267,195 in 1978 is equivalent to $948,325. A study of historical Presidential tax returns is interesting, informative, and highly recommended for anyone serious about tax reform, as is a study of historical income tax rates.

Tax Return Analysis: Romneys versus Obamas

Following are some other key statistics from the Romneys and Obamas tax returns:

It’s notable that 94.8% of the Romneys income came from investments – interest, dividends and capital gains, versus -12.8% for the Obamas. The Obamas tax return includes a capital loss carryover of $116,151, a consequence of failed investments from the past. That’s interesting, since Barack Obama is the one always harping on the idea of government investment, yet all the while it turns out that successful investing is a trait beyond the scope of his expertise. Small wonder his taxpayer-funded green energy investments have turned out to be dismal failures.

What’s even more notable is the fact that roughly 62.4% of the Romneys income came from capital gains and qualified dividends which, based on current law, are taxed at a maximum rate of 15.0%. In contrast, around 99.0% of the Obamas income came from wages and net book sales which are taxed at ordinary rates of as high as 35.0%. Thus the Romneys effective tax rate should be considerably lower than the Obamas; but it turns out that both couples effectively paid about the same overall effective tax rate, 25.2% versus 24.8%, as explained earlier. So in spite of favorable capital gains rates, overall effective tax rates tend to balance out. One reason for this phenomenon is that most of the States don’t reciprocate (i.e. there is no favorable capital gains rate at the state level).

Next, we find that the Romneys paid $102,790, or 0.8% of their income, in foreign taxes, while the Obamas paid $5,841, or 0.7%. Thus, on a percentage basis, both families earned about an equal amount of their income from foreign sources. So is either candidate more likely to outsource American jobs than the other? I guess Obama could limit sales of his books to the USA, and cut-off the rest of the world, as if that would make any sense. I’ll let you figure that one out.

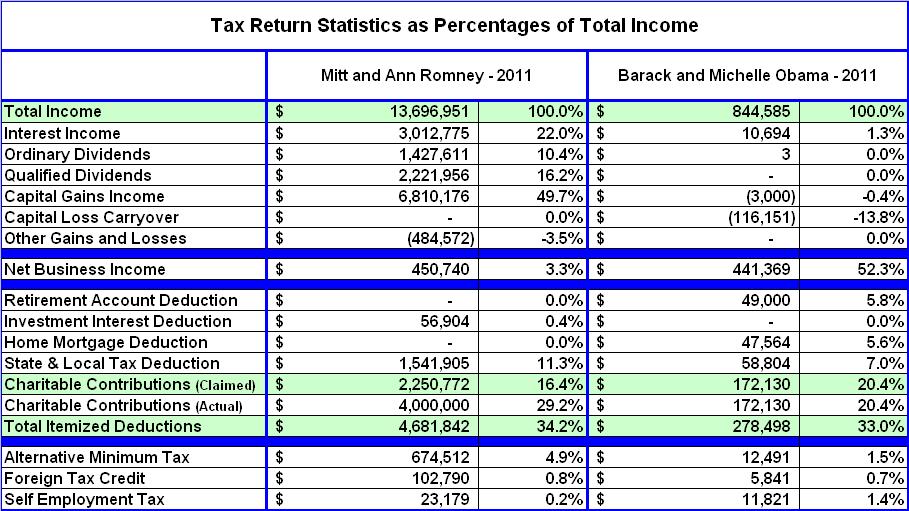
Next, we discover that the Obamas claimed a retirement contribution deduction of $49,000, or 5.8% of their income, while the Romneys claimed none. Foul! The question is that since Barack Obama now qualifies for a $191,000 a year presidential pension, why is he continuing to maximize the simplified employee pension account (SEP) deduction? In the private sector, the most anyone can exclude from income for retirement purposes, including employer matching contributions, is $49,000 per year. Yet Barack Obama gets to claim this maximum deduction, while at the same time deferring taxes on the annual contributions the U.S. Treasury makes to his pension account. Does that sound fair to you? Is Obama paying his fair share?

Is a guaranteed $191,000 a year for life, on top of a virtually unlimited presidential expense account, insufficient for Mr. Obama? In stark contrast, Mitt Romney refused to take a salary while he served as Governor of Massachusetts. So has anyone bothered to ask if he would waive his presidential salary? Would he also consider waiving the presidential pension and lush lifetime expense account? Somebody needs to ask that question. By the way, Mitt Romney could have claimed exactly the same SEP-IRA deduction that the Obamas did, based on his net business income, which would have further reduced his tax liability, but chose not to. So what does this say about character?

Next, the Obamas also claimed a $47,564 home mortgage deduction amounting to 5.6% of their income, while the Romneys claimed none. Wow! So since the Obamas claimed both a $47,564 home mortgage deduction, and the $49,000 maximum retirement contribution exclusion, while the Romneys claimed neither, this gave the Obamas an 11.4% handicap. Note: According to the Internal Revenue Service, in tax year 2010, only 25.8% of tax filers claimed the home mortgage deduction, which kind of makes the case for placing limits on this deduction.

Now when it comes to charitable contributions, as stated earlier, the Romneys gave $4,000,000, or around 29.2% of their income, while the Obamas gave $172,130, or 20.4%. But since the Romneys only chose to write-off $2,250,772, their actual deduction amounted to just 16.4% of their income. So once again the Obamas had a slight advantage, yet when their total itemized deductions are compared, we find that the Romneys amounted to 34.2% of their income, while the Obamas amounted to 33.0%, or about the same.

Finally, the Romneys federal taxes included an Alternative Minimum Tax (AMT) of $674,512, representing 4.9% of their income, while the Obamas incurred a liability was $12,491, or 1.5%. The AMT limits certain deductions and tax preferences to ensure that high income earners pay at least a minimum amount of tax. So what will happen when the AMT is eliminated? Will the rich pay less in taxes? Not necessarily, because if the same deductions and tax preferences for high income earners were eliminated from the get go, then the AMT wouldn’t be necessary. Isn’t this the objective of tax reform, to eliminate deductions and preferences, lower tax rates, and thus simplify the tax code? So when tax rates are cut by 20% in the next year or two, and that’s where we’re headed, the first place to look for deductions and preferences to eliminate is within current AMT regulations.

Content of Character

So what’s the point? First of all, we learned that in 2011, the Romneys paid a total of $3,454,434 in federal, state and local taxes, while the Obamas paid $209,057. When state and local taxes were added to the mix, we found that the Romneys paid an overall effective tax rate of 25.2%, versus the Obamas 24.8%. But when charitable contributions were figured in, we discovered that the Romneys paid a real effective tax rate of 54.4% compared to the Carters 45.6%, the Obamas 45.1%, and the Roosevelts 33.3%.

What should be clear is that measuring a person by the size of their effective tax rate reveals nothing about their character. If those who pay the largest share of taxes are the most patriotic among us, then that all but eliminates everyone except for the Top 1 Percent. If effective tax rates are so important, then why not simply convert to a flat tax (i.e. the FairTax)? That way the concept of effective tax rates becomes meaningless. In a perfect world it seems this would be the goal.

Is paying more taxes than absolutely necessary savvy? No, but anyone who voluntarily pays more must really love this country. Mitt and Ann Romney didn’t claim all of the charitable contributions they could have, and thus paid a higher amount in taxes than legally required. When it comes down to it, no one that I know cares anything about increasing their own personal effective tax rate; most are like the Obamas, preoccupied with finding ways to reduce it.

The main point of this post has been to prove that measuring any American by the size of their effective tax rate reveals next to nothing about the content of their character. Thus, Barack Obama’s entire fair share mantra turns out to be nothing but rubbish. The rich already pay more than their fair share sir. It’s time to bring on a business guy, someone who really understands what’s going on in this country. It’s time to lower income tax rates, limit deductions and preferences, broaden the tax base, and reduce the size of government. It’s time to lower the federal deficit and move towards a balanced budget. It’s time to purge Barack Obama’s jaded philosophy of – do as I think, not as I do.

Definitions:

(a) The Traditional Model – Under the traditional model, the effective tax rate is calculated by dividing total income taxes (before tax credits and other taxes), by total income (before exclusions and deductions).

(b) Effective Federal Tax Rate – The effective federal tax rate is determined by dividing total federal income taxes (before tax credits and other taxes), by total income (before exclusions and deductions).

(c) Effective State and Local Tax Rate – The effective state and local tax rate is determined by dividing total state income taxes, real estate taxes, and personal property taxes claimed on federal Schedule A, by total income (before exclusions and deductions).

(d) Overall Effective Tax Rate – The overall effective tax rate is calculated by dividing total federal income taxes (before tax credits and other taxes), plus total state and local taxes as in (c), by total income (before exclusions and deductions).

(e) Real Effective Tax Rate – The real effective tax rate is calculated by dividing total federal income taxes (before tax credits and other taxes), plus state and local taxes as in (c), plus charitable contributions, by total income (before exclusions and deductions).

References:

The Romneys 2011 Tax Return

The Obamas 2011 Tax Return

The Roosevelts 1937 Tax Return

The Carters 1978 Tax Return

Romney’s Taxes: A Window Into Charitable Giving

Even at 14%, Romney Pays a Higher Rate than 97% of His Fellow Americans

Ex-presidents have huge expense accounts

President Obama’s Taxpayer-Backed Green Energy Failures

From AAA to AA- in Four Years

The New National Curse

– By: Larry Walker, Jr. –

In the year 2009 double-dealing returned to Washington, DC. Shortly after his inauguration, President Barack Obama pledged to cut the nation’s annual budget deficit in half by the end of his first term. At the time, he identified exploding health-care costs as the chief culprit behind rising federal deficits. He warned that the country could not continue its current rate of deficit spending without facing dire economic consequences. He said, “I refuse to leave our children with a debt they cannot repay. … We cannot and will not sustain deficits like these without end. … We cannot simply spend as we please.” Yet within four short years, the USA’s sovereign credit rating has been downgraded three times, from AAA to AA(+) on August 5, 2011, to AA on April 15, 2012, and again to AA(-) on September 14, 2012.

Talk is cheap. By September 20, 2012, after 44 month’s of empty words, health care costs have continued to rise. Having risen by 3.9% in 2010, health care costs are expected to rise by another 7.5% in 2013, or more than three times the projected rates for inflation and economic growth. As if this wasn’t bad enough, the national debt has exploded by $5,387,546,974,859 in the last 44 months, resulting in an average annual increase of $1.5 trillion, versus an average of $612.4 billion during the presidency of George W. Bush (see chart below). And there are still four month’s to count until inauguration day.

National Debt: The National Curse

“I am one of those who do not believe that a national debt is a national blessing, but rather a curse to a republic; inasmuch as it is calculated to raise around the administration a moneyed aristocracy dangerous to the liberties of the country.”Andrew Jackson

On Jan. 8, 1835, all the big political names in Washington gathered to celebrate what Democrat President Andrew Jackson had just accomplished. The national debt had been paid. It was the only time in history when the U.S. was debt free, and it lasted exactly one year. Back then like today, it wasn’t easy for politicians to slash spending — that is until Andrew Jackson came along.

During the election of 1828, Jackson’s opponents referred to him as a “jackass”. Jackson liked the name and used the jackass as a symbol for a while, but it died out. However, it later became the symbol for the Democrat Party when cartoonist Thomas Nast popularized it. But based upon the growth of the national debt over the past 44 months, the symbol no longer fits, or does it?

“For Andrew Jackson, politics was very personal,” says H.W. Brands, an Andrew Jackson biographer at the University of Texas. “He hated not just the federal debt. He hated debt at all.” Before he was president, Jackson was a land speculator in Tennessee. He learned to hate debt when a land deal went bad and left him with massive debt and some worthless paper notes. Ah, so unlike Barack Obama, Andrew Jackson brought some practical business experience to the White House, just like Mitt Romney will.

When Jackson ran for president, he knew his enemy: banks and the national debt. He called it the national curse. People ate it up. In Jackson’s mind, debt was “a moral failing,” Brands says. “And the idea you could somehow acquire stuff through debt almost seemed like black magic.” Yet if you listen closely to today’s Democrat Party, the national debt is no longer its enemy, but rather the anti-debt, fiscally responsible Tea Party.

Andrew Jackson pledged to pay off the debt. In order to do so, he took advantage of a huge real-estate bubble that was raging in the Western U.S. The federal government owned a lot of Western land — so Jackson started selling it off. He was also ruthless on the budget. He blocked every spending bill he could. “He vetoed, for example, programs to build national highways,” Brands says. “He considered these to be unconstitutional in the first place, but bad policy in the second place.” But nowadays, we hear repeatedly from Barack Obama stuff like, “The House should put aside partisan posturing and pass the measure authorizing $109 billion in spending over two years. So much of America needs to be rebuilt right now. We’ve got crumbling roads and bridges…” In other words, forget about the credit downgrade, borrow and spend now, pay later.

When Jackson took office in 1829, the national debt was about $58 million. Six years later, it was paid in full, and the government was running a surplus. This created a new problem: What to do with all that surplus money? So Jackson decided to divide it among the states. By the way, the phrase “the government was running a surplus” doesn’t mean the same thing as Bill Clinton’s four consecutive annual budget surpluses. Although that was a step in the right direction, the national debt was still over $5.7 trillion when he left office.

Andrew Jackson was a stand up guy, he fulfilled his pledge. But unfortunately, the debt would only remain at zero for one year. By January 20, 2001, the national debt had grown to $5,727,776,738,305. From the time Andrew “Jackass” Jackson paid it off, until the inauguration of Republican President George W. Bush, the national debt grew at an annual average of $34.7 billion over the ensuing 165 years.

Forward: To Insolvency

In the year 2000, George W. Bush was elected on a pledge to cut income taxes. By the end of his term, the national debt had grown by another $4.9 trillion — to $10.6 trillion or at an annual average of $612.4 billion over 8 years. Although in retrospect, most of the Republican Party finds his fiscal record detestable, it is notable that Bush never once pledged to pay down the national debt or cut the federal deficit. In fact the federal government was running at a slight surplus at the time of his election, so the federal budget wasn’t an election year issue. Nevertheless, the USA’s sovereign credit rating remained intact at AAA throughout both of his terms, and its debt-to-GDP ratio averaged around 62.4%.

Finally in the year 2008, under the banner of Hope and Change, along came Barack H. Obama, portending to be all things to everybody. After making a solemn promise to cut the federal deficit in half by the end of his first term, many thought he represented the second coming of old Jackass himself. But instead, from the time of his inauguration the national debt has grown by an additional $5.4 trillion, not only exceeding the Bush presidency, but in double-time. That’s a fact! The national debt now stands at just over $16.0 trillion, having grown at an annual average of $1.5 trillion over the last 4 years. To top it off, the U.S. sovereign credit rating has been downgraded three times on his watch, from AAA to AA(+) on August 5, 2011, to AA on April 15, 2012, and again to AA(-) on September 14, 2012. Meanwhile, the U.S. debt-to-GDP ratio has risen to 104% and is projected to reach 110% a year from today.

Conclusion

As Andrew Jackson put it, the national debt is “the national curse.” In the first 165 years after the debt was paid off in 1835, it rose by an average of $34.7 billion per year. And although it would increase by an average of $612.4 billion over the next eight years, during President Bush’s term, that doesn’t excuse President Obama. Besides, how can we hold Bush accountable for something he never pledged to do? Nonetheless, Barack Obama is on the ballot this year, not Bush. And he pledged to cut the deficit in half during his first term, but it has instead doubled. Your word is your bond.

You might be thinking, “So what? We can’t afford to go back to the failed policies of George W. Bush, because that’s what caused health care costs to spiral out of control, and that’s the reason the debt was so high to begin with.” Yeah, like that makes sense. Stop listening to far-left lies and think for yourself. As a consequence of Barack Obama’s shortsightedness, the USA’s sovereign credit rating has been downgraded three times, from AAA to AA(+) on August 5, 2011, to AA on April 15, 2012, and again to AA(-) on September 14, 2012. Another downgrade or two and U.S. backed securities will no longer be suitable for many bond investors. And what happens when there are more sellers of U.S. backed debt than buyers? Interest rates will skyrocket. And what happens when interest rates rise? Everyone’s borrowing costs will increase, as will the USA’s annual budget deficits.

Now it’s election time, and thus time to decide. Who’s to blame for Obama’s improvidence, Bush, the Republican Party, the Tea Party, or perhaps simply Obama himself? Well, allow me to spell out the American way. If you make a pledge and fail to deliver, there’s no one to blame but yourself. Not only did Obama fail to cut the deficit in half by the end of his first term, but the USA’s annual deficits have more than doubled, and its credit reputation has been trashed. Barack Obama has cursed the nation, and now is the time to cut his career short. And here’s my pledge, if we elect Mitt Romney and he screws up, I will personally help to expel the bum four years from now. But just for today, the ‘jackass’ in chief has got to go.

_____________________________________________________________

Addendum: Ratings History

Egan-Jones rating history for United States Government:

  • 9/14/2012 AA to AA(-)

  • 4/15/2012 AA(+) to AA (Negative outlook)

  • 7/16/2011 AAA to AA(+)

Standard & Poor’s rating history for the United States Government:

  • 08/05/2011 AAA to AA(+) (Negative outlook)

_____________________________________________________________

Photo Credit Via: Greetings Jackass

Obama’s Jobs Recovery — In Temporary Help Services

One Term Wonder

Symptoms of Government-Down, Borrow-and-Spend Economics

– By: Larry Walker, Jr. –

According to Barack Obama, “We tried this trickle-down fairy dust before. And guess what — it didn’t work then, it won’t work now. It’s not a plan to create jobs.” But only the most gullible members of the Democrat Party would find such words edifying. What really matters to the majority of Americans, a point all but ignored by the Obama-Biden Entourage, is the fact that since the beginning of the Great Recession, a total of 4,778,000 Nonfarm Jobs have been entirely wiped out, and what we have been waiting to hear is a coherent plan whereby they might be recovered, not the comedic rhetoric of a left-wing jester.

In reality what Mr. Obama’s words describe are his own government-down, borrow-and-spend, loot-and-plunder policies, which have not only failed to add a single net Nonfarm Job (see chart below), but have instead added more than $5 trillion to the National Debt in just four years, resulting in the first credit rating downgrade in U.S. history. Instead of inundating the nation with more empty rhetoric, what every American deserves to know is the truth regarding where we stand, and how furthering Mr. Obama’s government-down, borrow-and-spend policies would help to restore both America’s credit rating and American jobs.

An analysis of real facts and figures, supplied by the U.S. Bureau of Labor Statistics, finds that during the Obama-Biden Administration a total of 316,000 Nonfarm Jobs have been lost, and regarding Private Sector Jobs, out of a mere 332,000 which have been recovered during the Obama-Biden Dynasty, every single one can be traced directly to the Temporary Help Services Industry. So when it comes to jobs, the pomposity we’ve all heard repeated over and over again by the Obama-Biden Crew and its cheerleading squad, including those prone to media-bias, is just that. A more substantive analysis begins.

Total Nonfarm Jobs

Examining the growth (decline) in Total Nonfarm Jobs [Private Sector + Government] since January 2001, it is clear that job creation is not something the Obama-Biden Administration should be bragging about. Here’s why (see chart below).

Total Nonfarm Jobs

  • From the end of January 2001 through the end of January 2008, a total of 5,557,000 Nonfarm Jobs were gained, during the Bush Administration.

  • During the last year of the Bush Administration, as a result of the Great Recession, from the end of January 2008 to the end of January 2009, a total of 4,462,000 Nonfarm Jobs were lost.

  • Thus, a total of 1,095,000 Nonfarm Jobs were gained during the Bush Administration.

  • During the Obama Administration, from the end of January 2009 through July 2012, a total of 316,000 Nonfarm Jobs have been lost.

  • Overall, we are still 4,778,000 Nonfarm Jobs in arrears, from a record high established by the Bush Administration at the end of January 2008.

Thus, in terms of Total Nonfarm Jobs, 1,095,000 were added during the Bush Administration, a rather pathetic record since we need to create 1,524,000 jobs a year (127,000 per month) just to keep up with population growth. In comparison, after nearly four years, and $5.3 trillion in new federal debt, not a single Nonfarm job has been added by the Obama-Biden Administration, but rather 316,000 have been lost. In spite of the policies of Obama-Biden, Nonfarm Jobs are still 4,778,000 short of the January 2008 peak, so gullible Obama-Biden loyalists need to find something else to showboat.

Total Private Sector Jobs

After cringing at the Total Nonfarm statistics above, gullible Obama-Biden loyalists will say that what they were really bragging about was their record on Private Sector Jobs (exclusive of Government). Okay, so let’s examine the growth (decline) of Private Sector Jobs since January of 2001.

Total Private Sector

  • From the end of January 2001 through the end of January 2008, a total of 4,016,000 Private Sector Jobs were gained, during the Bush Administration.

  • From the end of January 2008 to the end of January 2009, due to the Great Recession, a total of 4,662,000 Private Sector Jobs were lost, during the Bush Administration.

  • Thus, a total of 646,000 Private Sector Jobs were lost, during the Bush Administration.

  • During the Obama-Biden Administration, from the end of January 2009 through July 2012, a total of 332,000 Private Sector Jobs have been recovered.

  • Overall, Private Sector Jobs are still in arrears by 4,330,000 from a record high established by the Bush Administration at the end of January 2008.

So in terms of Private Sector Jobs, we have to hand it to Obama-Biden. While the Bush Administration lost 646,000 Private Sector Jobs over eight years, the Obama-Biden Administration has recovered 332,000 over the last four years. However, since we really need to create 1,524,000 jobs a year (127,000 per month) just to keep up with population growth, and since Private Sector Jobs remain 4,330,000 short of the January 2008 peak, the Obama-Biden Administration’s record isn’t really worth grandstanding. In fact, when government-down supporting, Obama-Biden loyalists discover the subsector in which these jobs were added, they should run as far away from their Party’s chosen platform as they can get.

Which Subsector(s) Gained Jobs?

Which areas of the Private Sector gained jobs during the Obama-Biden Administration? To know the answer, one must comb through all of the various industries detailed by the Bureau of Labor Statistics, in Table B-1, sector by sector. Were jobs gained in Mining and Logging, Construction, or Manufacturing? No. What about in the Wholesale Trade, Retail Trade, or Transportation and Warehousing? Nope. How about Information, Financial Activities, Education and Health Services, Leisure and Hospitality, or Other Services? Nope.

To be precise, the only sector of the economy where you’ll find any net jobs growth during the Obama-Biden Administration is under the Professional and Business Services category, and there only in the subsector named Temporary Help Services (under Professional and Business Services >> Administrative and Waste Services >> Administrative and Support Services >> Employment Services >> Temporary Help Services).

Temporary Help Services (NAICS 56132) – The temporary help services industry comprises establishments primarily engaged in supplying workers to clients’ businesses for limited periods of time to supplement the working force of the client. The individuals provided are employees of the temporary help service establishment. However, these establishments do not provide direct supervision of their employees at the clients’ work sites. So let’s examine the growth (decline) of Temporary Help Service Jobs since January of 2001.

Temporary Help Services Jobs

  • From the end of January 2001 to the end of January 2009, a total of 600,000 Temporary Help Service jobs were lost, during the Bush Administration. [Note: This accounts for nearly all of the 646,000 Private Sector Jobs lost over the period.]

  • During the Obama-Biden Administration, from the end of January 2009 through July 2012, a total of 576,000 Temporary Help Service jobs have been recovered. [Note: This accounts for all of the 332,000 Private Sector Jobs recovered during the period, minus losses in other sectors.]

So 600,000 Temporary Help Service jobs were lost during the Bush Administration, and the Obama-Biden Administration was able to recover 576,000 of them. In effect, since a total of 646,000 Private Sector Jobs were lost during the Bush Administration, among them, 600,000 or almost all were Temporary Help Service jobs. Since then, the Obama-Biden Administration has recovered a total of 332,000 Private Sector Jobs, and every single one of them, 576,000 minus losses in other sectors, were in Temporary Help Services.

Conclusion

From the end of January 2001 to the end of January 2009, a total of 1,095,000 Nonfarm Jobs were gained during the Bush Administration. In contrast, during the Obama-Biden Administration, from the end of January 2009 through July 2012, a total of 316,000 Nonfarm Jobs have been lost. Meanwhile, as Barack Obama, Joe Biden and their gullible loyalists boast about this great accomplishment, we are still 4,778,000 Nonfarm Jobs, and 4,330,000 Private Sector Jobs short of the record highs established by the Bush Administration at the end of January 2008. Even worse, since the population continues to grow, from the start of the Great Recession the real jobs deficit in the U.S. has increased to 11,760,000. That’s the record. Those are the facts. That’s the truth.

Like it or not, the only platform on the ballot this November which includes a plan and a promise to create more than 12,000,000 middle-class jobs over the next four years is the Romney-Ryan platform. In contrast, the plan and promise outlined by the Obama-Biden platform, to-date, includes more gloating, more lofty rhetoric, more special interest tax breaks, more deficit-financed subsidies, more uncertainty, more divisiveness, more government dependency, more government regulation, more borrowing and spending, higher health care costs, higher taxes, and with any luck a few more Temporary Help Service jobs.

It’s time to wake-up. It’s time to care. It’s time to do what’s in your best interests and that of your country. It’s time to stop believing in myths, and time to ‘Believe in America’.

“It is impossible to calculate the effect of deficit-financed government spending on demand without specifying how people expect the deficit to be paid off in the future.” ~ Theory of Rational Expectations

Chart Data | At Google Drive

Has Obama’s Loot-and-Plunder Theory Worked?

A 50-Year Retrospective

– By: Larry Walker, Jr. –

“Socialism is a philosophy of failure, the creed of ignorance, and the gospel of envy, its inherent virtue is the equal sharing of misery.” ~ Winston Churchill ::

Discussing his economic policies at a fundraiser in Oakland, California on July 23rd, Barack Obama, told supporters that, “We tried our plan, and it worked.” Yet, by the end of his first year in office, he had only managed to drag America, kicking and screaming, beyond the point of no return, as our National Debt, on a per capita (per person) basis, surpassed per capita Personal Income for the first time in more than 50 years (see chart above). As of June 30, 2012, after nearly four years of disservice to the nation, under the leadership of Barack Obama, every American now owes $7,958 more in federal government debt, on a per capita basis, than their personal income.

Per Capita National Debt to GDP

Equally alarming, as of June 30, 2012, the U.S. National Debt per capita reached a stunning 101.7% of Gross Domestic Product, an increase of 45.1% since the end of 2008. Looking back over the last half-century, no other President of the United States has done more to destroy our standard of living than Barack Obama. Now if that was his goal, then yes – it worked like a charm. However, this temporary condition will soon meet its demise.

Gross Domestic Product (GDP) is the market value of all officially recognized final goods and services produced within the United States. GDP per capita is considered an indicator of our nation’s standard of living. As of June 30, 2012, U.S. GDP per capita was equal to $49,672. The National Debt is the sum of all previously incurred annual federal deficits. Since deficits are financed by government borrowing, either from the public or from itself, the national debt is equal to all government debt outstanding. As of June 30, 2012, the U.S. National Debt per capita was equal to $50,502.

Thus, it may be stated that, as of June 30, 2012, the standard of living of the United States is negative. In other words, when taken as a whole, on a per capita basis, for the first time in more than a half-century, Americans now owe more in federal government debt than we produce. In effect, there isn’t anything left to address the growing mountain of state and local government, personal and business arrearages.

Granted that Barack Obama and a tiny remnant of gullible far-left loyalists have devised numerous excuses as justification for this atrocity, one way of accurately measuring the validity of such subterfuge is to simply compare the ratio of per capita National Debt to GDP over the last half-century. After all, it was Barack Obama who said of supply-side economics, a theory which has been deployed during most of the 1960’s through 2007, “We tried this trickle-down fairy dust before, and guess what — it didn’t work then, it won’t work now… It’s not a plan to lower the deficit…” Well, let us test this hypothesis on a relative basis, and see just how well his loot-and-plunder theory stacks up.

A quick study of the chart above, Per Capita National Debt to GDP: 1960 through June 2012, tells the whole story.

Testing Obama’s Theory

  1. At the end of 1960 per capita National Debt to GDP was equal to 54.4%.

  2. John F. Kennedy’s Tax Reduction Act of 1964 was signed into Law by his successor Lyndon B. Johnson. Under the ensuing era of lower tax rates, by the end of 1981, per capita National Debt to GDP declined all the way to 31.9%.

  3. Ronald W. Reagan’s Economic Recovery Tax Act went into effect in 1982, and even though government spending was higher than he would have liked, by the end of his term in 1988, per capita National Debt to GDP stood at just 51.0%.

  4. In 1993, Bill Clinton signed the Deficit Reduction Act, which turned out to be nothing more than a tax hike. By the end of 1996, per capita National Debt to GDP had increased to 66.7%.

  5. Then in 1997 the Republican-led Congress passed a tax-relief and deficit-reduction bill that was resisted but ultimately signed by President Clinton. One of the things the 1997 bill did was lower the capital gains tax. It was actually the 1997 tax cut, not the 1993 Clinton tax hike, which produced the boom of the 1990’s. By the end of the year 2000, per capita National Debt to GDP declined to 57.0%.

  6. In 2001, George W. Bush signed the Economic Growth and Tax Relief Reconciliation Act. By the end of 2001, per capita National Debt to GDP decreased to 56.5%, and later increased slightly to 58.5% in 2002.

  7. The following year, George W. Bush signed the Jobs and Growth Tax Relief Reconciliation Act of 2003, which provided the tax rates in effect today. By the end of 2007, per capita National Debt to GDP held at just 64.2%.

  8. In 2009, Barack H. Obama signed the American Recovery and Reinvestment Act (ARRA). The primary objective for ARRA was to save and create jobs almost immediately. Secondary objectives were to provide temporary relief programs for those most impacted by the recession and invest in infrastructure, education, health, and ‘green’ energy. The cost of the economic stimulus package was estimated to be $787 billion at the time of passage, but was later revised to $831 billion. By the end of 2009, per capita National Debt to GDP increased to 85.2%.

  9. The following year, Barack H. Obama signed the Tax Relief, Unemployment Insurance Reauthorization, and Job Creation Act of 2010, which extended long-term unemployment benefits and cut the employee’s portion of the Social Security payroll taxes by 2.0%. By the end of 2010, per capita National Debt to GDP increased to 93.5%. By the end of 2011 the ratio had increased to 101.0%, and by June 30, 2012, per capita National Debt to GDP notched up by another seven tenths of a percent to 101.7%.

Ever since Barack Obama implemented his plan, America’s standard of living has gone straight down the tubes. And since he said, “We tried our plan, and it worked…,” we are forced to conclude that his goal was to destroy America’s standard of living. If for some reason this wasn’t his goal, then a more honest assessment would have been, ‘We tried our plan, and it failed.’

When Barack Obama said, “We tried this trickle-down fairy dust before. And guess what — it didn’t work then, it won’t work now… It’s not a plan to lower the deficit..,” whose policies could he possibly have been referring to? A quick study of U.S. per capita National Debt to GDP ratios and per capita Personal Income to National Debt over the last 50 years leads to only one possible conclusion – his own.

Conclusion

Since per capita National Debt to GDP is at the highest ratio since the unsustainable heights attained during the second World War, and higher than at any time in the last half-century, and since Barack Obama has clocked the highest annual budget deficits in American history ($1,412.7 billion in 2009, $1,293.5 billion in 2010, $1,299.6 billion in 2011, and $1,326.9 billion in 2012), we can only conclude that his loot-and-plunder economic theory has achieved the worst results of any set of economic policies deployed by any American president, ever. The facts speak for themselves.

We tried Barack Obama’s loot-and-plunder theory, and it failed. And not only have Obama’s policies failed, but American’s are now worse off than at any time since the 1940’s. No one has managed our economy more recklessly than Barack H. Obama. Are you still a believer? Isn’t it high time we go back to what we know works, make some improvements, and implement some of the reforms proposed over the years, which were errantly pushed aside? Yes it’s time. And since Barack Obama has proved himself unwilling to bend to the will of the American people, it’s time we gave someone else the opportunity. It’s time to switch teams. It’s time to follow real leadership. It’s time to elect a true Conservative.

References:

Table 7.1 Selected Per Capita Product and Income Series in Current and Chained Dollars | Bureau of Economic Analysis

Debt to the Penny | Treasury Direct

Chart Data | Google Drive

Talk about Fairy Dust and Snake Oil!

:: Obama’s Loot-and-Plunder Theory on Social Benefits

– By: Larry Walker, Jr.-

Under Barack Obama’s economic theory, better known as Loot-and-Plunder Economics, income tax rates will necessarily skyrocket, perhaps by as much as 50% across-the-board. If you don’t believe it, just look at the facts and figures. For example, as of FY 2011, annual outlays on Social Security Benefits were 77.7% greater than they were in 2001, while outlays on Medicare were 148.8% greater (shown in current dollars in the chart above). Has Obama solved the problem through entitlement reform? Has he raised Social Security and Medicare taxes by 77.7% and 148.8% respectively? No, so what do you think is coming?

While Obama talks the talk, regarding taxing the rich and fairness, surely even he knows that his plan is not sustainable. It doesn’t balance the budget or grow the economy. The truth is that Obama has no plans for lowering income tax rates on the middle-class, but instead he created Obamacare, which is a nifty way of imposing a whole new set of taxes on those who can least afford health insurance, namely the middle-class. Got it? There will be no middle-class tax relief in a second Obama term, just new health care taxes (i.e. more pain).

So other than leading us all to the edge of a Fiscal Cliff, what else has Obama done for the middle-class? Well, he delivered a two-year Make Work Pay Credit (MWPC), which represented a $400 to $800 reduction in Social Security Taxes in 2009 and 2010, and followed this up with a two-year 2.0% Social Security Tax Cut. In other words, he gave us four years of temporary measures in an effort to stimulate the economy. But what did this really accomplish?

Two Things

#1 – The jobs deficit has grown to 11,760,000 under Obama’s watch, from 5,165,000 when Bush turned over the keys. So we can state without ambiguity that his attempts to stimulate the economy have failed. Sure, things might not be as bad as they could have been, but at the same time, things might not be as good as they could have been either.

The “jobs deficit” increases every month that employers create fewer than 127,000 jobs, the number needed to keep pace with population growth. As you can see in the chart below, the jobs deficit has increased under Obama’s watch, and has remained virtually unchanged since December of 2009. Aside from the jobs deficit, we are still 4,648,000 jobs short of where we were in December of 2007, partially due to the Great Recession, which ended in June of 2009, but namely due to Barack Obama’s loot-and-plunder economic policies, which were designed to prolong the crisis.

#2 – Not only has the unemployment rate remained above 8.0% for his entire term, but Obama’s ingeniously designed Social Security tax cuts have since created a $500 billion per year shortfall in the Social Insurance Fund accounts. Per the chart below, derived from the Bureau of Economic Analysis, Table 3.14 – Government Social Insurance Funds Current Receipts and Expenditures, the gap between Social Insurance receipts and expenditures is now worse than ever, thanks to Obama. I guess we’ll find out whether or not work pays (i.e. the MWPC), a few years from now, when we discover that our Social Security and Medicare guarantees were squandered away during the Obama years. His looting of an additional $716 billion out of Medicare to fund Obamacare should be le coup de grâce (the final blow).

As you can see in the chart above, the point of no return was actually breached in FY 2001, when Outlays for Social Benefits equaled Insurance Contributions. This was primarily due to an escalation in the number of baby-boomers reaching retirement age. But instead of addressing the obvious dilemma, the federal government allowed it to fester into larger and larger annual deficits. Thus, the “Social Benefits Deficit” eventually reached $177 billion by Fiscal Year 2008. Then along came Obama, who instead of addressing the problem has handed out four consecutive years of Social Security Tax cuts (i.e. loot-and-plunder fairy dust).

In just three years Obama turned a $177 billion annual Social Benefits Deficit into a $500 billion per year morass. Free money! Obamabucks! What were the results? As you can see in the chart above, and in the related table, in Fiscal Year 2009 the gap between Government Social Benefit Expenditures and Contributions swelled to $376 billion, from $177 billion in 2008, or by 112.4%. Those were the consequences of giving both taxpayers and non-taxpayers a reduction in their Social Insurance responsibilities via the MWPC. In Fiscal Year 2010, with the extension of MWPC, the Social Benefits Deficit widened to $411 billion, or by another 9.3%.

As if that wasn’t enough, Obama devised an even more cunning way of plundering America’s future retirement security. Replacing MWPC with his 2.0% Payroll Tax Cut, in 2011, caused the Social Benefits Deficit to widen by an additional 21.4%, to $499 billion. That’s a half-a-trillion dollar shortfall. And it’s not over yet. Since the 2.0% Payroll Tax Cut was extended into 2012, we will find out where Social Insurance Benefits stand, at the close of the fiscal year, on September 30th. But so far, when added together, $376 billion in 2009, $411 billion in 2010, and $499 billion in 2011, equals a total Social Benefits Deficit of $1.3 trillion. That’s the amount Obama has added to the national debt by tampering with our future retirement security, and that’s just a fraction of the $5.3 trillion he’s added to the overall debt.

Summary:

Between FY 2001 and 2008, Contributions for Government Social Insurance grew by 39.3%, while Social Benefit Expenditures grew by 73.6%. But instead of raising a red flag and solving the problem, Barack Obama proceeded to loot-and-plunder contributions, at a time when the demand for benefits was soaring. This was an amateurish move. Between FY 2009 and 2011, Contributions for Government Social Insurance actually shrank by -6.9%, while Social Benefit Expenditures rose by 22.1%, creating a $1.3 trillion shortfall.

So while gullible far-left loyalists continue to fall for Obama’s pretense, that the Romney-Ryan Ticket and Supply-Side economics would gut Social Security and Medicare, if they took five minutes to look up the facts, they would discover that Obama, through his own brand of loot-and-plunder fairy dust, has already beat them to it. The snake oil Obama is pushing is the same stuff that prolonged the Great Depression. Everyone knows that the federal government didn’t end the Depression, World War II did. That is everyone except for Obama, the unlearned and a few far-left loons.

What folks should be engaged in is bipartisan criticism of the manner in which Barack Obama is destroying our future economic security. We should at least be able to agree that there has to be a more viable alternative. Supply-side economics worked in the Roaring 20’s under Coolidge, in the 1960’s under JFK, in the 1980’s under Reagan, and in the 1990’s through 2007 under Clinton and Bush. That’s right! But according to Barack Obama, “It never worked.” Don’t believe that lie. A quick glance at the following chart, Net Federal Outlays and Receipts since 1980, says it all. Trillion dollar annual deficits are a phenomenon which began with Obama.

Lest we forget, Bill Clinton’s famed tax plan was a package which included tax rates ranging from 15% to 39.6% (i.e. rates were higher at all levels across-the-board), in addition to the Republican-led Tax-Relief and Deficit-Reduction Bill of 1997 (i.e. what actually created the boom of the 90’s). But if you think Obama can cherry-pick just one smidgen of Clinton’s tax policies, apply it to only a fraction of taxpayers, those making more than $250,000 (the equivalent of $157,197 in 1993), and achieve the same results, then you’re not using your brain.

Loot-and-Plunder economics ends when everyone sees their taxes rise by 50% or more across-the-board. That’s the only way the federal government can continue to spend at current levels, and move even halfway towards balancing its budget. When you see the symptoms of a failed economic policy (above), and your candidate boasts, “My plan worked,” that’s when you run!

—————————–

Notes:

The third chart (above) purposefully excludes interest contributed towards Social Insurance, since such interest is paid from general government funds. The federal government long ago raided the Social Security Trust Fund spending every dime, and now owes the Social Security Trust Fund $2.5 trillion, per Note 24 of the United States Government’s Notes to the Financial Statements, for the year ended September 30, 2011. From time to time, the federal government pays the Trust Fund interest on its debt, but with trillion dollar deficits for the last four years, it is reasonable to conclude that every dime of the interest paid is borrowed, thus it makes no sense to double count. The chart also excludes administrative expenses.

References:

U.S. GAO | Fiscal Year 2011 Financial Report of the United States Government

Bureau of Economic Analysis | Table 3.14 Government Social Insurance Funds Current Receipts and Expenditures

Chart Data | Google Drive

Obama’s Loot-and-Plunder Theory on Steroids

:: Use It or Lose It: We Can’t Wait

– By: Larry Walker, Jr. –

According to unelected hoodlums within the Obama Administration, from 2003 to 2006, Congress set aside $473 million in earmark transportation funds that have never been spent. “These idle earmarks have sat on the shelf as our infrastructure continued to age and construction workers stood on the sideline,” Transportation Secretary Ray LaHood said in a conference call Friday. “I’m taking that unspent money and giving it right back to the states so they can put it to work on the infrastructure projects that they need most — projects that will put people to work.”

So according to Mr. LaHood he’s going to take (i.e. steal) $473 million that was earmarked for infrastructure projects from 2003 through 2006, and send it right back (i.e. 6 to 9 years after the fact) to the states so they can spend it on the infrastructure projects they need the most (i.e. for purposes other than Congress intended). Aside from the fact that this proposal is felonious, the money Mr. LaHood is referring to no longer exists.

The idea of taking funds earmarked towards specific projects, which were deemed unworthy of pursuit during a previous administration, and shifting them towards other purposes today is felonious. What does the term “earmarked funds” mean? It means if Congress passes legislation to repair a certain bridge, the money to repair that bridge is “set aside”. But following Mr. LaHood’s gangster logic, ‘fictitious’ funds earmarked towards certain projects, six to nine years ago, may now be used to fund projects such as California’s Bullet Train to Nowhere. Perhaps a pair of handcuffs is in order.

Common sense dictates that if a bridge still needs fixing, and if the funds still exist and are not barred by the statute of limitations, then it should be fixed. But if the bridge doesn’t need fixing, if it was subsequently replaced by another project, or if the statute of limitations has expired, then the funds, assuming they still exist, should be returned to the Treasury. The notion of “use it or lose it” in this matter is felonious. According to Mr. LaHood, States now have around 45 days, or until October 1st, to identify projects for which they plan to use the money, or else they will lose it. In other words, the funds were not lost after sitting idle for 6, 7, 8 and 9 years, but suddenly there is an arbitrary 45-day deadline. Who passed that law? What is the statute of limitations for spending on earmarked transportation projects – 9, 8, 7, or 6 years? Is there one, or do bureaucrats just get to make up the rules as they go along?

Where’s the Money?

The following analysis from John A. Swinford on his blog, People, Places, News and Other Stuff, answers a key question: Where’s the money?

“Sounds reasonable, right? Hold on to your horses; remember this is a politician speaking. According to Transportation Secretary Ray LaHood, “These idle earmarks have sat on a shelf…” Well, OK, they were authorized but not used. I get that, but what happened to the funding for those earmarks…where is the money…in a lock box or a savings account…or somewhere else? Secretary Hood claims the earmarks were authorized during a period between 2003 and 2006 but not actually spent and therefore, the cash is still available.”

“Before you buy that explanation consider the difference between a budget and cash accounting. If you go to the St. Louis Federal Reserve Bank website you can pull up the actual Federal cash receipts and outlays. In each of the years to which Secretary Hood refers, the cash deficits ran $378 billion, $413 billion, $318 billion and $248 billion respectively (in current dollars). OMG, Washington spent more cash than it took in…What a surprise… But if that is so how could there possibly be some extra loose cash sitting around. Answer… there is none. The only way to fund “Use It or Lose It” is what? You guessed it…more borrowing.”

In fact, according to the Bureau of Economic Analysis, in real terms, the federal government operated at deficits of -1,955.2 billion from 2003 to 2008, and another -4,678.1 billion from 2009 to 2012 (shown in Constant FY 2005 Dollars). So not only was there nothing leftover, the money was never there to begin with.

The annual deficits shown in the chart above and listed below are shown in billions of constant (FY 2005) dollars. Note that the federal budget was nearly balanced in FY 2007.

  • 2003 -402.6
  • 2004 -427.9
  • 2005 -318.3
  • 2006 -239.7
  • 2007 -151.0
  • 2008 -415.7
  • 2009 -1,274.4
  • 2010 -1,153.0
  • 2011 -1,127.6
  • 2012 -1,123.1 (estimate)

The chart below summarizes receipts and outlays as percentages of Gross Domestic Product. Notice how the budget gap has widened dramatically since 2009.

Obama’s ideas on the economy are nothing more than classic Loot-and-Plunder, trickle-up, middle-out snake oil. In other words, borrow now – pay never. It didn’t work during the Great Depression, it hasn’t worked since 2009, it has never worked and it never will. Proposing to implement 1/16th of President Clinton’s 1990’s tax policies, while ignoring the fact that back then, income tax rates were higher on every American across-the-board, isn’t a serious plan for either growing the economy or balancing the budget. It’s a notion that most certainly fails to justify the felonious borrowing conjured up by Transportation Secretary LaHood just yesterday.

It’s time to return to supply-side economics which proved itself during the Roaring 20’s, the 1960’s, the 1980’s, the 1990’s and most of the 2000’s (through 2007). Obama has no plan to pay down the $5.3 trillion (in current dollars) which he’s added to the national debt, let alone the $16 trillion overall balance. Yet he seems to have no problem borrowing another $500 million under the guise that it’s somehow Bush’s fault. That’s right! Expect the extra $500 million in borrowing to magically be credited to George W. Bush, while Obama continues to promote the obvious lie that spending hasn’t increased on his watch.

But as each of the above charts show, whether in terms of current dollars, constant (FY 2005) dollars, or as percentages of GDP, Obama has allowed spending to skyrocket while revenues have continued to suffer due to a weak economy and high unemployment, symptoms of his failed economic policies. It’s time to put an end to this churlish presidency. Borrow It or Save It? We can wait – all the way to November 6th.

“The debt and the deficit is just getting out of control, and the administration is still pumping through billions upon trillions of new spending. That does not grow the economy.” ~ Paul Ryan

Addendum:

During 2008 the Highway Trust Fund required support of $8 billion from general revenue funds to cover a shortage in the fund. This shortage was due to lower gas consumption as a result of the recession and higher gas prices. Further transfers of $7 billion and $19.5 billion were made in 2009 and 2010 respectively.

^ Weiss, Eric M. (September 6, 2008). “Highway Trust Fund Is Nearly Out of Gas“. The Washington Post. Retrieved May 4, 2010.

^ “President Signs Bill Providing 9-Month Extension, $19.5 Billion for Highway Trust Fund“. The Washington Post. March 19, 1010. Retrieved August 15, 2011.

———————————————

References:

THE OLD WASHINGTON SHELL GAME? | John A. Swinford

Trickle Up Economics | Peter Schiff

Chart Data: Spreadsheet | Google Drive

Understanding Obama’s Loot and Plunder Theory

A.K.A. Trickle-up, or Trickle-sideways

– By: Larry Walker, Jr. –

The ignorance of one voter in a democracy impairs the security of all.” ~ John F. Kennedy –

“Trickle-down theory” is a pejorative term in United States politics which refers to the idea that tax breaks or other economic benefits provided by government to businesses and the wealthy will benefit poorer members of society by improving the economy as a whole. In the real world, and called by its proper name, supply-side economics has never failed. In fact, in spite of the ignorance of a few, any improvement in our economy since the end of the Great Recession can be attributed directly to the remaining bands of supply-side tax policies left over from the Bush Tax Cuts, which are scheduled to expire on December 31st.

In the 1980’s what was known as Reaganomics was pejoratively referred to by RINO’s and the far-left as “trickle-down” or “voodoo” economics. But they were wrong. Supply-side economics worked then and it will work now. Yet according to our clueless president, Barack Obama, it’s just “fairy dust”. We have to remind the far-left, including our clownish president (act like a clown and you get called one), that the four pillars of Reagan’s economic policy were to reduce growth of government spending, reduce income taxes and capital gains taxes, reduce government regulation of the economy, and control the money supply to reduce inflation. Now if that’s just “fairy dust” to you, then perhaps like Mr. Obama, back in your college days, you took one drag too many off a marijuana cigarette.

Mitt Romney’s five-point plan is the closest platform on the ballot to Reagan’s four pillars. Romney’s policies would also cut the deficit, reduce income taxes and capital gains taxes, reduce the number of government regulations, and would create a Reagan Economic Zone to strengthen free-enterprise and the U.S. Dollar world-wide. We call this supply-side economics. What’s the alternative? Does Obama have a better plan? Economist George Reisman, a proponent of tax cuts, said the following:

“Of course, many people will characterize the line of argument I have just given as the ‘trickle-down’ theory. There is nothing trickle-down about it. There is only the fact that capital accumulation and economic progress depend on saving and innovation and that these in turn depend on the freedom to make high profits and accumulate great wealth. The only alternative to improvement for all, through economic progress, achieved in this way, is the futile attempt of some men to gain at the expense of others by means of looting and plundering. This, the loot-and-plunder theory, is the alternative advocated by the critics of the misnamed trickle-down theory.”

On the other side of reality is Barack Obama’s one-point plan, also known as Obamanomics, “trickle-up”, “trickle-sideways” or “loot-and-plunder theory”. Under the Obama hypothesis, the deficit isn’t cut, income and capital gains taxes are hiked on those making over $250,000 while remaining static on those making less, the number of government regulations on the economy continue to expand, and nothing is done to improve the U.S. trade deficit or to strengthen the dollar. In other words, his one-term plan lacks a growth catalyst. Raising taxes on businesses and the wealthy isn’t an economic growth strategy, not even according to its chief proponent, Barack Obama. It’s merely a futile attempt of some men to gain at the expense of others by means of looting and plundering.

The Ends of Obama’s Loot-and-Plunder Theory

There are many countries with top tax rates higher than the 35% paid by the wealthiest Americans. In fact, the U.S. is ranked #23 in terms of top marginal tax rates among the 96 countries surveyed by KPMG in 2011. In the U.S. the top rate kicks in at around $388,350 of taxable income in 2012. Workers are also mandated to pay social security taxes of 4.2% (10.4% if self-employed) on the first $110,100 in wages, plus another 1.45% (2.9% if self-employed) on an unlimited amount of earned income. The U.S. tax on capital gains is currently 15%. The top U.S. corporate tax rate also clocks in at a healthy 35%, in addition to a matching portion of social security and Medicare taxes (6.2% of the first $110,100 and an unlimited 1.45%) on wages paid.

Among nations with the highest tax rates in the world, Ireland ranks #10. Its top tax rate of 48% kicks in at about $43,900 USD of taxable income (including a Universal Social Tax of 7.0%). Other notable taxes include a capital gains rate of 30%, and a pay related social insurance tax of 4% (also 4% if self-employed, with a 10.75% employer match). But while its personal tax rates are high, it has among the lowest corporate tax rates in Europe at just 12.5%.

The country with the #1 tax rate in the world is the Dutch territory of Aruba. Its top marginal rate of 58.95% kicks in at around $165,000 USD of taxable income, but the 35% rate kicks it at around $38,500 USD. Other notable taxes include a capital gains tax of 25%, a 1.6% (9.5% if self-employed) health insurance tax, a 4.0% (13.5% if self-employed) pension and accident insurance tax, and a 3% national sales tax. While its individual tax rates are the highest in the world, Aruba levies a flat corporate tax rate of just 28%, which is better than in the U.S.

A quick analysis of nations with the highest tax rates in the world reveals one common thread. Once a populace is conned into loot-and-plunder theory and tax rates begin to rise, it’s not long before tax brackets fall to a level where top tax rates affect almost everyone except for those below the poverty line. The top tax rate of 48% in Ireland kicks in at around $43,900 USD of taxable income and a tax rate of 35% kicks in at around $38,500 USD in Aruba. And that’s not including social insurance, health care, and VAT or national sales taxes which always follow. Where loot-and-plunder theory ends is when every middle-class worker is forking over 40% or more of their income to the government.

Live by the sword, die by the sword. If you’re in favor of hiking taxes on businesses and the wealthy, then you’re in favor of having your own and everyone else’s taxes hiked as well. That’s the deal. That’s the choice. The only one on the ballot offering a 20% across-the-board tax rate cut on every American is Mitt Romney. The only one offering not to tax interest, dividends or capital gains for those making less than $200,000 is Mitt Romney. The only one offering to eliminate the Alternative Minimum Tax and the Death Tax is Mitt Romney. The only one offering to cut the top corporate tax rate to 25% is Mitt Romney. The only pro-growth, deficit reduction plan on the ballot is Mitt Romney’s. The only things standing in the way are the clueless clown and part-time president Barack Obama (no I’m not laughing), and the ignorance of a few.

“Our tax system still siphons out of the private economy too large a share of personal and business purchasing power and reduces the incentive for risk, investment and effort – thereby aborting our recoveries and stifling our national growth rate.” ~ John F. Kennedy, Jan. 24, 1963, message to Congress on tax reduction and reform, House Doc. 43, 88th Congress, 1st Session

References:

Oxford English Dictionary

“The General Benefit from Reducing Taxes on the ‘Rich'”.Capitalism: A Treatise on Economics. p. 308. ISBN 978-0915463732

Countries With the Highest Income Tax Rates | CNBC

Aruba Tax Rates

Ireland Income Taxes and Tax Laws 2012

Path to Liberty | Privatization or Back to the Plantation?


“Mr. President, it is natural to man to indulge in the illusions of hope. We are apt to shut our eyes against a painful truth, and listen to the song of that siren till she transforms us into beasts. Is this the part of wise men, engaged in a great and arduous struggle for liberty? Are we disposed to be of the number of those who, having eyes, see not, and, having ears, hear not, the things which so nearly concern their temporal salvation? For my part, whatever anguish of spirit it may cost, I am willing to know the whole truth; to know the worst, and to provide for it.” ~ Patrick Henry

An Accountant Explains Why the U.S. Cannot Balance its Budget

– By: Larry Walker, Jr. –

In following video (link), a former accountant who worked with budgets for over 40 years clearly explains the U.S. budget dilemma. After reviewing the facts contained therein, it should be evident that there are only two possible solutions for the survival of the United States: (1) raise taxes by 50% across the board or, (2) lower taxes and privatize entitlement programs.

Raising taxes leads to a smaller economy and larger government, with the need to eventually raise taxes again at some point. On the other hand, lowering taxes while privatizing entitlement programs leads to a larger economy and less government. Although the latter will cause some pain in the initial years, the affliction will be faced either way. However, privatization is the only path leading to the long-term sustainability of a free Republic.

While some would conclude that the solution involves a combination of increasing tax rates while cutting entitlement programs, I believe the two are mutually exclusive. That is to say, raising taxes reduces the size of the economy leading to the need for even more entitlements. Raising taxes also narrows the tax base leading to less government revenue. On the other hand, privatization requires lowering income tax rates to enable entitlement programs to go private. Cutting taxes also leads to a larger private economy, a broader tax base and increased government revenues. So the latter leads to greater economic independence for free citizens, and less reliance on government programs. This should be the goal for a free society.

Our freedoms may only be sustained by lowering income tax rates in conjunction with privatization of the major entitlement programs (i.e. Social Security, and Medicare). Although some painful days will occur during the initial years of conversion, in which the government must meet its past commitments while transitioning younger workers towards privatization, it is important to note that, “Every time in this century we’ve lowered the tax rates across the board, on employment, on saving, investment and risk-taking in this economy, revenues went up, not down.” Thus reducing income tax rates will actually increase, not decrease, federal revenues during the transition. Therefore, the tax cuts that I am speaking of should be across the board and immediate, as should the transition towards privatization.

There are really only two choices, (1) a larger private economy based on free-market principles and self-reliance, or (2) an ever increasing and invasive federal government with greater dependence on its ability to collect taxes from a shrinking base of those able to pay. The policies implemented today will determine America’s future. The alternatives are clear – live free, or become a ward of the State. There are no laurels to rest upon. Either you favor exercising your God-given right to freedom, or returning to slavery. The decision is yours. As for me, I choose freedom, by any means necessary.

“The day that the black man takes an uncompromising step and realizes that he’s within his rights, when his own freedom is being jeopardized, to use any means necessary to bring about his freedom or put a halt to that injustice, I don’t think he’ll be by himself.” ~ Malcolm X

Photo Credit: English Exercises

See Related:

Obsolete Government Programs, Part 1 | FICA – Apr 20, 2011

If we were not forced to pay this mandatory tax of 6.2% (12.4% for the self-employed) on earned income up to the limit of $106,800, we would be able to save a greater portion of our own money into the modern retirement…

Obsolete Government Programs, Part 2 | Medicare – Apr 21, 2011

Medicare is partially financed through payroll taxes imposed by the Federal Insurance Contributions Act (FICA) and the Self-Employment Contributions Act of 1954. In the case of employees, the tax is equal to 2.9% (1.45%…

Social Security: A Breach of Trust – Jan 09, 2011

As I explained in “The Social Security Bust Fund”, the federal government has summarily confiscated and spent every dime of the $2.6 trillion surplus, which would have comprised the Social Security Trust Fund, and has…

Unequally Yoked | Social Security and the Working Class – May 07, 2011

Did you know that most state and local government employees are exempt from Social Security taxes? Millions of Americans who are covered by state or local retirement plans do not pay into the Social Security system.

The Social Security Bust Fund – Jan 03, 2011

In other words, the Treasury pays interest to the Social Security Trust Fund, but not in the form of cash, rather in the form of additional special-issue securities. (Huh?) Interest is only physically paid out when money is needed…

Taxing Inflation, Part 3 | Romney vs. Nothing

“We are in the midst of yet another great American discussion about taxation. Perhaps no policy area has become more sensitive or controversial. At stake are two vital concerns for the American future: How will we generate sufficient revenue to balance our budget without discouraging economic activity, and will the burden of taxation fall equitably on all Americans?” ~ Mitt Romney

Faith vs. Hopelessness | Independence vs. Dependence

– By Larry Walker, Jr. –

Under Mitt Romney’s tax proposal, no one making less than $200,000 a year is taxed on interest income, dividends or capital gains. For more on why this is just, see Parts One and Two, but to be brief, when investments are losing purchasing power at a faster pace than current returns, a tax on investment income merely acts as a second tax on top of inflation. In addition, under Romney’s plan, income tax rates are cut by 20% across the board, with the bottom tax bracket reduced from 10% to 8%, and the top bracket from 35% to 28%. The last President to lower top tax rates to 28% was Ronald Reagan, and we all know what happened back in the 1980’s. Romney’s game plan also eliminates the alternative minimum tax (AMT), which deserves to die, since Congress has failed to peg its exemptions to inflation.

Aside from the above, Romney eliminates the death tax and caps corporate tax rates at 25%. Altogether Romney’s strategy is pro-growth, one fully capable of giving our stagnant economy the boost it needs to reach a full recovery, and place us back on the right track. Although Romney’s proposal isn’t perfect, it’s far better than the alternative, which can be pretty much summed up as nothing to less than nothing. That’s right! Barack Obama’s scheme omits economic growth as a viable possibility, instead settling on sanctimonious indignation against high achievers, especially business owners who would be hit by his proposed tax hikes.

Obama’s blueprint offers nothing for 98% of Americans, those making less than $157,197 in 1993 dollars (the equivalent of $250,000 today). In other words, you won’t see your taxes rise or fall by one dime, except of course for those new health care taxes. And for the remaining 2%, those making more than $157,197 in 1993 dollars (the equivalent of $250,000 today), Obama offers to hike tax rates to 36% and 39.6%, and to raise the capital gains tax from 15% to 30% or more. In short, under Obama’s outline, 100% of the 51% of Americans who pay income taxes will either receive nothing, or less than nothing. But the most glaring flaw in Obama’s program is that it omits incentives capable of stimulating private sector investment, and thus growth. And without private sector growth, there will be even fewer jobs to go around, and only more of the same — temporary, deficit-financed, government boondoggles.

A Dearth of Gross Private Domestic Investment

Gross Private Domestic Investment is one of the four components of Gross Domestic Product (GDP). In the United States, real gross private domestic investment currently represents just 14.1% of real GDP, or $1.9 trillion. But after the Republican-led Congress passed a tax-relief and deficit-reduction bill in 1997, real gross private domestic investment subsequently peaked at 17.5% of GDP in the year 2000. The 1997 bill lowered the capital gains tax from 28% to 20%, which induced greater levels of private domestic investment, leading to a higher rate of GDP growth, and increases in economic activity, employment and tax collections. Contrary to popular opinion, it was actually the 1997 tax cuts, not the 1993 Clinton tax hike, which produced the boom of the 1990’s (see chart below).

In the year 2000, the Dot-Com Bubble burst, wiping out a great deal of private capital and reducing gross private domestic investment back to 15.6% of GDP by 2002. So Republicans passed the Jobs and Growth Tax Relief Reconciliation Act of 2003. The 2003 Act slashed capital gains rates once again, this time to 5% and 15%. This attracted capital investment back into the economy, boosting gross private domestic investment to 17.2% of GDP in the years 2005 through 2006. Then in 2007, global credit markets went haywire, the housing bubble burst, and the Great Recession commenced. Lasting until June of 2009, the most recent downturn dragged gross private domestic investment to a 20-year low of 11.4% of GDP. Although there has since been a mild rebound to 14.1% of GDP, gross private domestic investment remains hopelessly mired in the same doldrums faced in the mid-1990s. Private investors, perhaps with good reason, are still reluctant to place new capital at risk domestically.

The Perils of Government Investment

There is a strong correlation between gross private domestic investment and real GDP growth (see table). Which came first, the investment or the growth? Well, without investment, there is no growth. And investment can only come from two sectors, private or government. Federal government consumption has remained constant, representing 7.7% of GDP in 1995 and 7.6% currently, while state and local government consumption has declined from 13% of GDP in 1995 to 10.6% currently (see table). The federal goverment’s contribution to GDP is already deficit financed, and state and local governments have bankrupted themselves through commitments to union induced pension schemes and Medicaid. So which is likely to succeed, more deficit-financed government investment, or higher levels of private sector investment?

The reason gross private domestic investment remains retarded is due to the policies of Barack Obama. Under Obama’s program, government spending has spiraled completely out of control, resulting in a glut of low interest U.S. Treasury securities, which are siphoning off capital from the private sector, via the lure of a government guarantee. This is doing a great deal of harm to the American economy, since government is incapable of building anything on its own. As a matter of fact, the only accoutrement the federal government has built by its lonesome is a $15.8 trillion mountain of debt, which now amounts to $139,500 for each U.S. taxpayer (subject to increase every millisecond). What’s ironic is that a taxpayer investing in U.S. government securities is also responsible for making interest payments on the same, through income taxes. After all, it’s not like the government has its own private stash with which to pay. Thus, the notion of government investment is but a farce.

The Obama administration’s latest presumption involves purchasing aviation biofuel through the U.S. Air Force at $59 per gallon, while straight avgas is selling for $3.60 a gallon. This they surmise is somehow a good use of taxpayer monies. The Obama administration, in its wisdom, fully expects the price of biofuels to fall by 2015, even if solely through the demand of a single customer – the U.S. taxpayer. Apparently, no private sector airline is dumb enough to join the gala. The major flaw in this design is that the recipient of this generous subsidy, Gevo, Inc., relies heavily on corn in the manufacture of its patented isobutanol fuel. And since day corn prices have jumped by more than 52% in the last month, due to the severe drought, this puppy is liable to go bankrupt by the end of the year, along with the rest of the Obama administration’s not-so-green, government financed, ventures. But at least we can say, “We didn’t build that, somebody else made that happen.” Is converting the food supply into fuel ever a good idea? Hello!

By the way, Gevo’s stock peaked on the NASDAQ exchange at $25.55 per share in April of 2011, but since the end of June has been trading below $5.00 per share. The fact that the stock had already lost over 80% of its value before the drought tells us all we need to know about the current administration’s due diligence. Relying on government investment to make up for a shortfall in private investment is kind of like cutting off your nose to spite your face. Barack Obama’s parting shot, proposing to raise income taxes in the middle of an economic quandary, is about twice as dopey. By now it should be clear that Obama’s big-government dream isn’t the solution to our problems, it is the problem. Government doesn’t know best. In fact, but for the $2.4 trillion a year it collects in taxes from the private sector, the federal government wouldn’t exist.

The Verdict

Raising real gross private domestic investment back to 17.5% of GDP would add as much as 3.4% to real GDP, or the equivalent of $455.6 billion. And since according to the Bureau of Economic Analysis, per capita personal income is currently $37,500, that means rebalancing the economy in favor of gross private domestic investment could translate into as many as 12.2 million new jobs.

Mitt Romney’s proposal, to eliminate the tax on interest, dividends, and capital gains for those making less than $200,000, is the only serious plan on the table capable of boosting gross private domestic investment back to 2000 levels, and beyond. And the creation of 12.2 million new jobs through Romney’s strategy is just the tip of the iceberg. Additional jobs are created through increases in personal consumption as the result of cutting income tax rates by 20% across the board, eliminating the AMT, eliminating the death tax, and capping corporate taxes at 25%.

In contrast, Barack Obama’s inflation tax raises taxes on the most productive Americans, those making more than $157,197 in 1993 dollars (the equivalent of $250,000 today), and does nothing for the other 98% of Americans, the combination of which will result in the loss of as many as 12.7 million jobs. So Obama’s notion offers nothing to less than nothing in terms of economic growth.

Mitt Romney’s proposal, on the other hand, leads to higher levels of gross private domestic investment, GDP, economic activity, employment, and tax collections. It’s the best hope for improving America’s economic condition. It’s economic independence versus dependence. It’s faith versus hopelessness. It’s pro-growth versus nothing. Thus, you may place me in the decided column. Was there ever a doubt?

Taxing Inflation, Part 2 | Simple Pro-Growth Policies

Are we interested in treating the symptoms of poverty and economic stagnation through income redistribution and class warfare, or do we want to go at the root causes of poverty and economic stagnation by promoting pro-growth policies that promote prosperity? ~ Paul Ryan

… Promoting Prosperity

– By: Larry Walker, Jr. –

In the United States, real gross private domestic investment currently represents 14.1% of real GDP, or $1.9 trillion. But it only represented 12.6% in 1993, after the Clinton tax hikes. Then in 1997, the Republican-led Congress passed a tax-relief and deficit-reduction bill that was at first resisted but ultimately signed by President Clinton. The 1997 bill lowered the top capital gains tax rate from 28% to 20%. The reduction in capital gains rates encouraged greater private domestic investment, leading to GDP growth, and increases in both economic activity and tax collections. After the bill passed, real gross private domestic investment grew to 15.6% in 1997, and reached a peak of 17.5% by the year 2000. It was actually the 1997 tax cuts, not the 1993 Clinton tax hike, which produced the boom of the 1990’s.

But then the Dot Com Recession began, lasting from March through November 2001, wiping out capital and reducing gross private domestic investment to a low of 15.6% of GDP. Then Republicans passed the Jobs and Growth Tax Relief Reconciliation Act of 2003. The 2003 Act slashed capital gains rates to 5% and 15%, which boosted gross private domestic investment back to 17.2% of GDP in 2005 and 2006. But then the housing bubble burst and the Great Recession began, lasting from December 2007 through June 2009, eviscerating trillions of dollars in capital. Recessions typically destroy capital, and the Great Recession was no exception. Afraid of losing again, investors have been reluctant to place new capital at risk. Government spending has since spiraled out of control, absorbing capital from the private sector with the lure of low return guaranteed government securities.

Boosting gross private domestic investment back to 2000, 2005 and 2006 levels, or to between 17.2% and 17.5%, would add as much as 3.4% to GDP growth. But Barack Obama, through a series of temporary measures, coupled with threats of higher taxes, has done little to allay investors fears. So the question today is what can the U.S. government do to encourage more private investment in the domestic economy? Following are three simple policies which can and should be implemented right away.

Pro-Growth Tax Policies

Long-term capital gains are currently taxed at a top rate of 15%, while short-term gains are taxed as ordinary income (at rates ranging from 10% to 35%). At the same time, capital losses are limited to the lesser of $3,000 per year, or up to the amount of concurrent capital gains. Interest income and ordinary dividends are currently taxed as ordinary income, while qualified dividends (paid on stocks held for 60 days or longer) are treated as long-term capital gains and taxed at a maximum rate of 15%.

But this is all subject to change next year – with the rate on long-term capital gains increasing to a maximum of 20%, and the tax on interest, ordinary dividends and qualified dividends all increasing to ordinary rates of between 15% and 39.6%. Until Congress either changes or extends the current rates, uncertainty and flagging private domestic investment will prevail. But a more exigent question is whether taxing any form of return on capital investment is fair. What’s a fair tax for the return on investment?

1. Indexing Capital Gains

As discussed in Part I, in India, capital gains are computed differently than in the U.S. Under India’s tax law an investor is allowed to increase the cost of the original investment by the annual inflation index, before computing a capital gain or loss. Capital gains in Israel are also inflation adjusted. And as stated previously, the following countries don’t tax capital gains at all: Belize, Barbados, Bulgaria, Cayman Islands, Ecuador, Egypt, Hong Kong, Islamic Republic of Iran, Isle of Man, Jamaica, Kenya, Malaysia, Netherlands, Singapore, Sri Lanka, Switzerland, and Turkey. Other countries like Canada, Portugal, Australia, and South Africa do levy a tax on capital gains, but the tax only applies to 50% of the gain.

However, in the United States, capital gains are figured without the benefit of an inflation adjustment. What’s wrong with this? What’s wrong is that the U.S. dollar has lost 96% of its value since the Federal Reserve was established and the Tax Code imposed in 1913. Therefore, much of what is thought of as a capital gain in the U.S. isn’t a gain at all, it is rather the recovery of an amount equivalent to (or in some cases less than) the purchasing power of the original investment.

For example, if you had invested $100,000 in 1981, your investment would have the same purchasing power as $261,497 today. That’s because annual inflation has averaged 3.15% in the U.S. over the last 31 years (calculate it here). So an investment of $100,000, 31 years ago, which happened to appreciate by $161,497, hasn’t really made a dime. Yet the federal government will levy a tax of $24,225 (@ 15%) on the investor as a reward for believing in America. But had the same investment been made in India, Israel, or in any of the other 17 above mentioned countries which don’t tax capital gains, the return on capital would have been tax-free. So what’s a fair share?

Does the USA’s current capital gains policy encourage American citizens and corporations to invest more at home, or to move abroad? The answer should be clear. But making matters worse, the tax rate on capital gains is scheduled to increase from 15% to 20% in 2013. And even worse, Barack Obama is proposing to raise the rate to at least 30% on the “wealthy”, while doing nothing for the other 98% of Americans. But on a brighter note, Mitt Romney would eliminate the capital gains tax entirely on taxpayers with incomes below $200,000, while lowering ordinary income tax rates to between 8% and 28%. Romney is on the right track, but he could go a bit farther.

Why not simply index capital gains to inflation, tax real capital gains at ordinary tax rates, and allow an unlimited amount of real capital losses to be claimed within the year recognized? That way it’s not necessary to play the class warfare game. Making capital gains taxes fairer for everyone is a way to increase private domestic investment and GDP, while at the same time attracting capital back to the U.S. and away from what are currently more just investment havens.

2. No Tax on Interest Income

In the U.S., interest income earned on deposits at banks and credit unions, on money market funds, on bonds, and on loans, such as seller-financed mortgages is taxed as ordinary income, subject to ordinary income tax rates. Interest on U.S. Treasury bonds and savings bonds is taxable for federal purposes, but tax-free at the state level. Interest on municipal bonds is tax-free at the federal level and tax-free at the state level if invested within one’s state of residence. Interest on municipal private activity bonds is tax-free for the regular tax, but is taxable for the alternative minimum tax.

Focusing on taxable interest, when the interest rate earned is less than the inflation rate, why is it considered taxable? If an investor isn’t earning at least the inflation rate, there are no real earnings, since the investor suffers a loss in purchasing power. For example, according to FDIC.gov, the national average interest rate paid on bank savings accounts is currently 0.09%, and the average rate on 60-month certificates of deposit, whether over or under $100,000, is 1.06%. Meanwhile, inflation has averaged 1.81% over the last five years (lower than normal due to the recession). So at today’s interest rates, an investor with $100,000 in a savings account is losing something on the order of 1.71% in purchasing power each year. This adds up over time. At current averages it would amount to loss in capital of 8.55% over five years. And that doesn’t include service charges some banks impose for the privilege of having an account.

Interest rates banks pay today aren’t a reward, but rather a punishment. But as if interest rates aren’t pathetic enough, after losing purchasing power while trying to save a dollar or two, the federal government then levies a tax on the decline in value, ensuring that no American will ever get ahead. The return on U.S. Treasury securities isn’t any better. On July 16th, the U.S. Treasury was somehow able to sell 3-year Treasury Notes offering an interest rate of 0.25%, and a yield of 0.366%. That’s laughable especially considering that the interest earned is taxable as ordinary income. Meanwhile, the inflation rate for urban consumers was 2.93% last year, and is expected to reach 3.00% in 2013. Are we paying our fair share yet?

The federal government currently taxes interest income at rates ranging between 10% and 35%, yet those rates are scheduled to increase to between 15% and 39.6% in 2013. Barack Obama’s solution is to do nothing for anyone making less than $250,000, and to raise rates to 36% and 39.6% on those making more. Mitt Romney’s solution is to eliminate the tax on interest for taxpayers with incomes below $200,000, while lowering ordinary income tax rates to between 8% and 28%. But Romney shouldn’t even have to play the class warfare game.

Either taxing interest is fair, or it’s not. And if it’s not fair, then it’s not fair for any American. If the U.S. government is serious about encouraging savings within its borders, then at the very least it will eliminate the tax on interest. It’s that simple. In no case should any investor earning less than the rate of inflation be insulted with an income tax bill. And to be truly fair, a capital loss deduction should be allowed when a long-term saver loses purchasing power by getting trapped at rates below the rate of inflation.

3. No Tax on Dividends

In 2003, President George W. Bush proposed to eliminate the U.S. dividend tax stating that “double taxation is bad for our economy and falls especially hard on retired people.” He also argued that while “it’s fair to tax a company’s profits; it’s not fair to double-tax by taxing the shareholder on the same profits.” Perhaps he was right.

In Brazil, dividends are tax free, since the issuer company has already paid a tax. In Japan, since 2009, capital losses may be used to offset dividend income. But in the U.S. dividend income is first taxed to corporations at rates ranging from 15% to 35%, before being paid to shareholders. Investors then get hit with a second tax on the same income ranging from 10% to 35% on ordinary dividends, or limited to 15% on qualified dividends (on stock held for greater than 60 days). And income tax rates on dividends are scheduled to increase to between 15% and 39.6% in 2013, on both ordinary as well as qualified dividends.

Naturally, Barack Obama’s solution is to raise taxes on dividends. Obama plans to keep Bush’s lower 10% tax bracket in place, but to raise top tax rates to 36% and 39.6% on those most likely to invest in dividend paying ventures, those making more than $250,000. Mitt Romney, on the other hand, would eliminate the tax on dividends for taxpayers with incomes below $200.000, while lowering ordinary income tax rates to between 8% and 28%. I believe that Romney is on the right track; however, if double taxation is unfair, then it’s just not fair – no matter how much income is involved.

Dividends should either be taxable to the corporation or the individual, but not both. And lest we forget, a tax on dividends may also be punitive, in the sense that when an investor’s returns are lower than the rate of inflation, purchasing power is being lost, not gained. If the government insists on taxing both entities, then the tax should only apply to individuals on the amount of return in excess of the rate of inflation.

Summary

No American should have to pay a tax on capital gains or interest income, unless the return on investment exceeds the rate of inflation. No American should have to pay a tax on dividends when the tax has already been paid by a corporation. Whether it’s easier to just do away with investment taxes altogether is subjective, but I do believe that it’s in best interests of the United States to entirely eliminate them for every American. No American should ever be taxed after suffering a decline in the purchasing power of their capital. At the very least, the basis of capital investments should be adjusted for inflation, and capital losses should be deductible in full and concurrently. If the return on investment is less than the rate of inflation, then there is nothing to tax.

Barack Obama has proposed to do nothing for 98% of taxpayers, and to raise taxes on the investment income of those making more than $250,000. He’s so stuck on the class warfare tack that he has totally forgotten to put anything on the table which would encourage greater levels of savings and investment within the United States. If Obama is somehow successful, I would expect more capital and more jobs to be shipped overseas.

Mitt Romney has proposed policies which will encourage greater savings and investment. Although his plan isn’t perfect, it’s far better than the alternative. Romney would eliminate the tax on capital gains, interest and dividends for taxpayers making less than $200,000. He would also lower the bottom tax rate to 8% from 10%, and top rates to 28% from 35%. Romney’s policies are more likely to retain capital within the U.S. and to attract more from abroad, which will lead to increases in gross private domestic investment, GDP, economic activity, employment and wealth creation.

Data: Spreadsheet on Google Drive