What the Individual Mandate means for you and your family
:: By: Larry Walker II ::
Under the Affordable Care Act, beginning in 2014, State governments, insurers, employers, and selected individuals are supposed to share in the responsibility of providing health insurance coverage.
The Act’s shared responsibility provision, also known as the individual mandate, requires you and each member of your family to either:
- Have minimum essential coverage; or
- An exemption from the responsibility to have minimum essential coverage; or
- Pay an Excise Tax.
You will report minimum essential coverage, claim an exemption therefrom, or make an excise tax payment when you file your 2014 federal income tax return in 2015.
Now let’s stop and think about what this means. What it means for me, since I chose not to purchase health insurance this year, instead choosing to pay my own health care expenses out-of-pocket, is that on top of what I have already paid this year (which incidentally comes to less than 10% of my income so none of it will be tax deductible), I am also being punished by way of an excise tax. An excise tax for what exactly? For not purchasing a service which I deem to be worth less than its cost, due to high deductibles coupled with premiums?
‘State of Being’ Tax
In the United States, an Excise tax is an indirect tax on listed items. In constitutional law sense, an excise tax is usually an event tax (as opposed to a state of being tax). A recent exception to this “state of being” principle is the “minimum essential coverage” tax under Internal Revenue Code section 5000A as enacted by the Patient Protection and Affordable Care Act (Public Law 111–148), whereby an indirect tax is imposed on the condition of not having health insurance coverage.
In case you didn’t catch that, excise taxes are usually assessed on events, such as the purchase of a quantity of a particular item like gasoline, diesel fuel, liquor, wine, cigarettes, airline tickets, tires, trucks, etc. Such a tax is usually included in the price of the item—not listed separately like sales taxes. To minimize tax accounting complications, excise taxes are generally imposed on quantities like gallons of fuel, gallons of wine or liquor, packets of cigarettes, etc. and are usually paid by the manufacturer or retailer.
Other examples of excise taxes imposed in the U.S. relate to such things as luxury passenger automobiles, heavy trucks and trailers, “gas guzzler” vehicles, tires, petroleum products, coal, vaccines, medical devices, recreational equipment, firearms (see National Firearms Act), communications services (see Telephone federal excise tax), air transportation, policies issued by foreign insurance companies, wagering, water transportation, removal of hard mineral resources from deep seabeds, chemicals, certain imported substances, non-deductible contributions to certain employer plans, and many other subjects.
Excise taxes are normally passed on to the consumer who eventually consumes the product. The price for which the item is eventually sold is usually not considered in calculating the amount of the excise tax. Income taxes, value added taxes (VATs), sales taxes, and transfer taxes are examples of other excise taxes but are typically not called such (in the United States) because of the different ways they are imposed. In the U.S. the only taxes called excise taxes are essentially taxes on quantities of enumerated items (whiskey, wine, tobacco, gasoline, tires, etc.). Other taxes on certain events may technically be considered excise taxes, but may or may not be collected under the name “excise tax.”
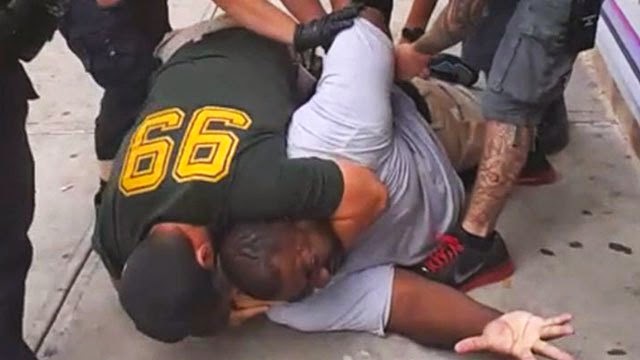
Virtually every excise tax levied since the founding of this nation (perhaps since the dawn of time) has been levied for actively participating in some event. If you buy gasoline, you pay an excise tax on each gallon purchased, but if you don’t own a vehicle and don’t purchase gasoline, the tax is not levied. If you use a land-based or mobile telephone service, you pay an excise tax, but if you don’t have a phone, you don’t get charged. If you legally purchase tobacco, you pay an excise tax, but if you don’t smoke, you are spared. And I might add, if you are caught bootlegging a couple of loose cigarettes (loosies) on a street corner, you’re liable to get choked by a corybantic cop, and left to die on a New York sidewalk.
Anyway, will someone please explain to me why a person choosing not to engage in an event should be taxed? In effect, I’m damned if I do, and damned if I don’t. If I pay the premiums for the least expensive health insurance policy that the government insists I can afford (without so much as bothering to check my balance sheet), won’t I still have to pay the first $6,300, or more, in medical expenses to meet its annual deductible? Yes. And, if my out-of-pocket expenses turn out to be less than the deductible, barring some major catastrophe, won’t I have needlessly wasted my money? Yes. So what’s the point?
If it was up to me, and by the way it should be, I would purchase a low-cost catastrophic health care plan, just in case something happens down the road. The only thing standing in my way is the federal government. That’s because under the misnamed Patient Protection and Affordable Care Act, catastrophic plans are only allowed to persons either under the age of 30, or to those over 30 who wish to go through the torture of completing an eleven, or more, page hardship exemption application, which must then be approved by a nameless, faceless government bureaucrat.
Catastrophe in the Making
My first problem with having to complete a hardship application is that I shouldn’t have to. If I want to buy a catastrophic plan, I should have the freedom to do so. Secondly, after looking over the application and all the information my government wants from me, my initial thoughts are as follows: Why don’t they know most of this already? Followed by, it’s none of your damned business. Here are just a few examples from the requisite exemption application.
-
Tell us about yourself (name, address, county, phone numbers, and email address). – [Okay.]
-
Tell us about members of your household (your spouse and dependents). – [Okay.]
-
Provide everyone in your household’s name, date of birth, sex, social security number. – [Incidentally, just beneath the space where your SSN is entered, it says in bold type: You are not required to have an SSN to get this exemption. Really, but if I don’t have a social security number, why would I need an exemption? Duh!]
-
Are you pregnant? – [Not that I’m aware of.]
-
Were you in foster care at age 18 or older? – [Uh, what does this have to do with anything?]
-
Have you used tobacco in the last 6 months? – [If I did will my request be denied?]
-
Are you a U.S. Citizen or U.S. national? – [Shouldn’t you wizards know this by my name, date of birth, and social security number entered at the top? Don’t tell me you didn’t bother to add citizenship status to your Master-File database.]
-
Are you a naturalized or derived citizen? – [Uh, what perchance is a derived citizen? And again, if you don’t know this by the information entered above, then you have serious yet solvable problems.]
-
Optional: What is your race? – [Do I have a better shot if I’m a person of color?]
-
Are you enrolled in health care coverage? – [If I was enrolled in health care coverage, then I wouldn’t be wasting my time?]
-
Are you offered health coverage from a job? – [I’m self-employed, and haven’t offered myself coverage.]
-
What company do you work for? – [Does it really matter?]
-
How much money do you make and how often are you paid? – [Ah, now we’re getting down to brass tacks.]
-
How many hours do you work each week? – [Too many, but since I’m not paid by the hour, does it really matter?]
-
When did you start this job, and when will it end? – [When will it end? Perhaps sooner than it should, due to this lousy law.]
-
What months do you expect to have income from this job this year and next? – [Who knows? Hopefully all of them.]
-
Are you self-employed? If so, what type of work do you do, and how much is your net income? – [Yes. Why does it matter what I do? And I’m not sure what my net income is yet, because you guys are still working out the final details of the 2014 tax law. However, I’m pretty sure I’m not making much headway burning valuable time and energy reading all of your rules and regulations, and filling out this application.]
-
When did you start this self-employment and when will it end? – [When will it end? Why don’t you tell me, since you’re mucking up the works, and have predetermined that I can afford your prescribed coverage?]
-
What month’s do you expect income from self-employment over the next two years? – [Two years? I’m not sure, but at this pace my prospects are dimming.]
-
Tell us about your other income (unemployment, retirement, pension, farming/fishing, rental/royalty, alimony, social security, etc…) – [Gross, or after expenses, principal debt repayments and taxes?]
-
Now tell us about deductions you claim on your tax return (alimony paid, IRA deduction, student loan interest, and other…) – [What about my out-of-pocket medical expenses, mortgage interest, property taxes, state income taxes, employee business expenses and other itemized deductions? I guess these don’t count.]
-
Now do the same for your spouse and any dependents you claim on your tax return. – [Damn it. Oh, I almost forgot; good thing I’m still technically single.]
-
Proof of yearly income: Submit proof of each type of income listed for each person on this application (copy of your most recent tax return, original W-2 and 1099 Forms, one or more pay stubs, financial statements, Schedule C, Form 1120S, lease agreements, court documents for alimony, etc.) – [Are you kidding me? Anything else before we get to the long-awaited catastrophic health plan?]
-
Just one more question before you sign. Is anyone listed on this application incarcerated? – [WTH? Not yet anyway.]
-
Now just sign, date and wait. – [Well alrighty then, but since this statement is not sworn under penalties of perjury, does that mean it can be a complete fabrication without consequence? And since this is a pseudo-government agency, how long before I get an answer — months or years?]
After assessing the prospect of completing and submitting the requisite hardship application along with supporting documents, and awaiting approval or denial from a faceless, faraway bureaucrat; solely to obtain permission to purchase a catastrophic health care plan, which is all I really want and need; I’m seriously leaning towards just forking over the 1% excise tax next year, another 2% in 2016, and 2.5% in 2017. What a catastrophe! So not only am I paying my actual out-of-pocket health care expenses, some of which already include excise taxes, but on top of that I’m being unfairly taxed (based on a percentage of gross income above the filing threshold) for the privilege of doing so. This is a travesty of justice.
The bottom line: An “event tax” should not be imposed on anyone who chooses not to participate in the event. The Affordable Care Excise Tax, being levied against Americans for not purchasing health insurance, is thus immoral. No American should be subject to an excise tax for choosing to take personal responsibility for his or her own health care expenses, without insurance. And, no American, desiring to do so, should be denied, or forced to jump through hoops for the right to purchase a catastrophic health care policy. You may proceed with this unjust confiscation of my money (if you will), and then go blank yourselves, or you can do what only true Americans would do. Open the damned “marketplace” so that health insurance plans available to selected Americans are available to all Americans.
Related:
Affordable Care Excise Tax, Part II
Affordable Care Excise Tax, Part III