Hope and Change on Ice

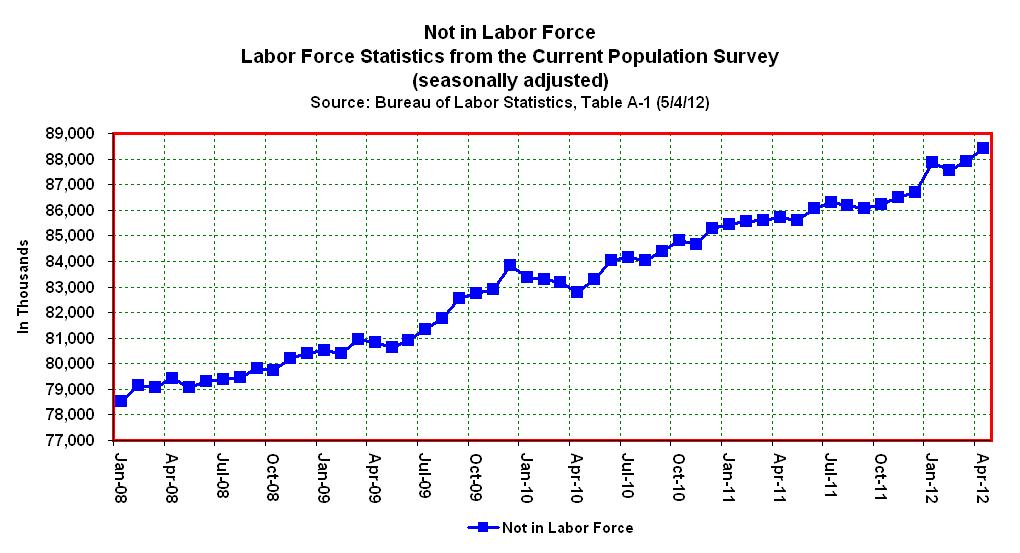
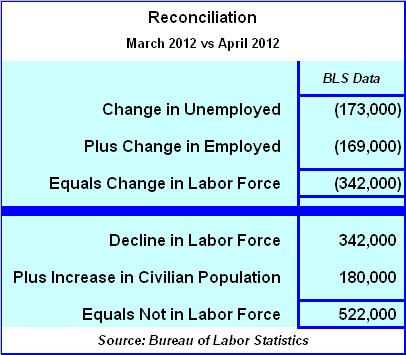
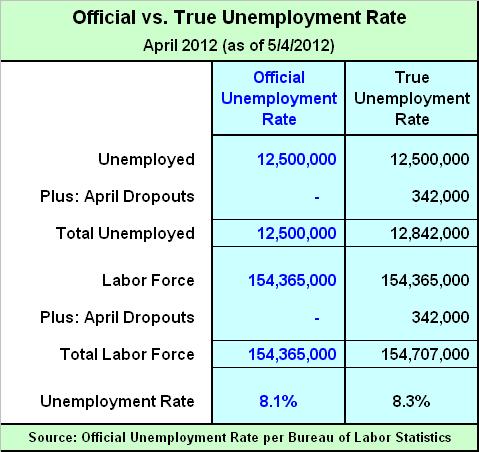
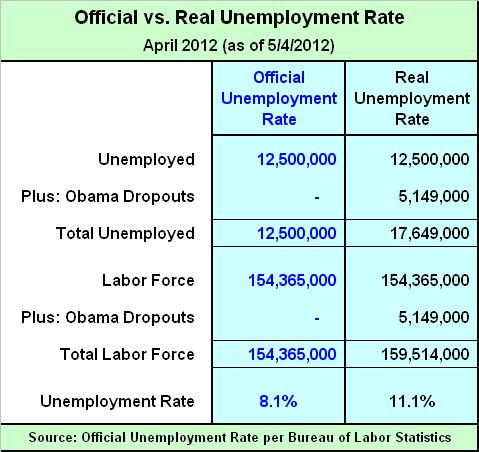
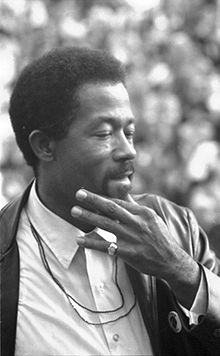
Leroy Eldridge Cleaver
(8/31/1935 to 5/1/1998)

Remembering Eldridge Cleaver

* By: Larry Walker, Jr. *

“Right-wing conservatives and left-wing radicals here in the U.S. must be willing and able to sit down at the same table, look across the table at each other and see not an enemy, a target or a statistic, but a brother, a sister, a fellow American, another child of God. We must expand our hearts and enlarge our identity beyond ‘my people’ to include and embrace all of Creation.” ~ Eldridge Cleaver

In the late 1960’s, after leading a troubled youth, Leroy Eldridge Cleaver became a prominent member of the Black Panthers. Having held the titles Minister of Information, Head of the International Section of the Panthers while in exile in Cuba and Algeria, and as editor of the official Panther’s newspaper, Cleaver’s influence on the direction of the Party was rivaled only by founders Huey P. Newton and Bobby Seale.

Cleaver and Huey Newton eventually fell out with each other over the necessity of armed struggle as a response to the FBI’s Counter Intelligence Program and other actions by the government against the Black Panthers and other radical groups. While Cleaver advocated the escalation of armed resistance into urban guerilla warfare, Newton suggested the best way to respond was to put down the guns, which he felt alienated the Panthers from the rest of the Black community, and focus on more pragmatic reformist activity.

In 1968, Cleaver was shot during an ambush he initiated against Oakland police officers, in which fellow Black Panther member Bobby Hutton was killed and two police officers were injured. Charged with attempted murder, he jumped bail and fled to Cuba and later to Algeria. Following Timothy Leary’s Weather Underground assisted prison escape, Leary stayed with Cleaver in Algeria; however, Cleaver placed Leary under “revolutionary arrest” as a counter-revolutionary for promoting drug use. Cleaver later fled Algeria and went underground in France.

Cleaver returned to the United States in 1975, having become a born again Christian, and renouncing his ultra-radical past. The charge of attempted murder, stemming from the armed Panther attack on Oakland police in 1968, ended in Cleaver being sentenced to probation for assault. In the late 1970’s, he joined the Mormon Church of Latter-day Saints. Once his probation ended, he was baptized into the Church of Jesus Christ of Latter-day Saints on December 11, 1983. He periodically attended regular services, lectured by invitation at LDS gatherings, and was a member of the church in good standing at the time of his death in 1998.

Cleaver argued that the Mormons were among the few religious groups who, as an entity, did not propagate slavery. He simply found the claims that the Church was a “racist institution” to be unconvincing. Furthermore, Cleaver identified with Joseph Smith and with the ideas of a literal relationship to God as children, not as creations. He appreciated how seriously Mormonism took the written scripture.

Along with Cleaver’s theological conversion came a political conversion. By the 1980s, Cleaver had become a conservative Republican. He appeared at various Republican events and spoke at a California Republican State Central Committee meeting regarding his political transformation. He began lecturing on college campuses, promoting conservative issues and campaigned for then presidential candidate Ronald Reagan. In 1984 Cleaver ran for election to the Berkeley City Council but lost. Undaunted, he promoted his candidacy in the Republican Party primary for the 1986 Senate race but was again defeated.

Eldridge Cleaver’s journey, in his own words:

“I embarked upon a search to try to find out what was the truth. That led me to checking out all different kinds of religions. Because I knew that there must be some truth out there somewhere. But I found out that every time I went and checked out a religion or a sect or a denomination or a cult, people started calling me by names. I thought I’d better go check out the Mormons, so I went and studied their material, their doctrine. And People started calling me a Mormon… And then I went and checked out the Moonies to see what Rev. Moon was talking about. But I tell you, I was very reluctant, because after following Mao Tse Tung, and Ho Chi Ming, and Kim El Sun, I wasn’t ready for another great wise man from the East. And I said ‘Hey, I’m not a Moonie, I’m not a Mormon, I just got to the M’s!’

“You know, it’s a logical progression, it’s a metamorphosis. And what I found was that my heart was growing, I became more and more inclusive to be able to relate to more and more people on this planet.”

“I used to be a Marxist and I used to think all our problems were economic and political. But at the end of the day I found out that our main problems are spiritual problems. Because the connection between people and between Creation and the creator is not a political connection, it’s not an economic connection, it’s a spiritual connection. Your creator lays down markers in your life—you don’t know what all this is happening for.”

“A lot of people said I sold out. The biggest drug dealer in Oakland said to me: ‘You know, you flipped out, man.’ I said, ‘No I flipped back in.’” ~ Eldridge Cleaver

————————————————————

I can identify with Mr. Cleaver on several levels, although my life has been somewhat less dramatic. I grew up in the era. I was born in Detroit, Michigan in 1960. My father was a pioneer in the day, he was just completing his Master’s Degree when I came along. In 1964, my family headed for California, where we resided about 80 miles from Oakland. I remember the times. I remember the struggle.

Cleaver’s transformation was similar to my own. When my eyes finally opened, I came to know that, “… we are not fighting against flesh-and-blood enemies, but against evil rulers and authorities of the unseen world, against mighty powers in this dark world, and against evil spirits in the heavenly places (Ephesians 6:12).” Once I understood, I embarked upon my own spiritual journey. I ran with the Baptists, the Pentecostals, the Seventh Day Adventists, the Christian Scientists, then back to the Pentecostals. I just never made it to the M’s, yet.

In the early 1980’s, I too became a Reagan Conservative. Groupthink forever ceased to be my forte. Freedom requires an open mind. ‘The connection between people and between Creation and the creator is not a political connection, it’s not an economic connection, it’s a spiritual connection.’ I choose to live free. Today, I am an independent conservative, I am Christian, I am American, I’m Black, and I’m proud.

“If a man like Malcolm X could change and repudiate racism, if I myself and other former Muslims can change, if young whites can change, then there is hope for America.”Soul on Ice – by Eldridge Cleaver

Right On, Eldridge, Right On!

References:

One Journey Home: Eldridge Cleaver’s Spiritual Path ~ by Linda Neale

From Black Panther to Mormon: The Case of Eldridge Cleaver ~ Mormon Matters

Photo via:

Library of Congress Prints and Photographs Division Washington, D.C. 20540 USA

Obama’s Economic Fallacy: The Not-To-Do List

Small Business Goals, Rewards and Incentives

* By: Larry Walker, Jr. *

“Contrariwise, if it was so, it might be; and if it were so, it would be; but as it isn’t, it ain’t. That’s logic.” ~ Lewis Carroll *

In his latest weekly address, Mr. Obama outlined a mirage of goals, rewards and incentives which he says Congress ‘must’ act upon immediately. But for the most part, what he proffered are just more of the same tried and failed policies, conjured from the same line of illogical reasoning we’ve heard, time and time again, over the last four years. Therefore, what Mr. Obama coined as a “Congressional To-Do List” should rather be endorsed as the official “Not-To-Do List”. Why? Well, let’s test the logic of just one item on the, so called, ‘To-Do List’.

Mr. Obama said, “Third, Congress should help small business owners by giving them a tax break for hiring more workers and paying them higher wages. Small businesses are the engine of economic growth in this country. We shouldn’t be holding them back – we should be making it easier for them to succeed.”

In order to understand why Mr. Obama’s argument is fallacious, one must understand what an argument is. Very briefly, an argument is an attempt to persuade someone of something, by giving reasons or evidence for accepting a particular conclusion. It consists of one or more premises followed by a conclusion. In a logical argument, the premises support the conclusion. When we place Mr. Obama’s argument in its proper order we arrive at the following:

Premise 1 – Small businesses are the engine of economic growth in this country.

Premise 2 – We (the government) shouldn’t be holding them back – we should be making it easier for them to succeed.

Conclusion – Congress should help small business owners by giving them a tax break for hiring more workers and paying them higher wages.

No one in their right mind would disagree with either premise. Yes, small businesses are the engine of economic growth in the USA. And no, the government shouldn’t be holding us back, but should rather get out of our way, and off of our backs, so that we may succeed. However, the premises Mr. Obama presented do not support his conclusion.

Will the act of offering or failing to offer the reward of tax breaks to small businesses, that hire more workers and pay higher wages, make them any more, or less, the engine of economic growth in America? Will the act of passing additional governmental laws, rules, regulations and loopholes make it any easier for small businesses to succeed?

As a small business owner myself, I can state first hand, that offering my company a reward for hiring more workers and paying them higher wages won’t help my company in the least. That’s because nowhere in my mission statement will you find the stated goals of hiring more workers and paying them higher wages.

How many small business owners do you know that are in business for the purpose of hiring more workers and paying them higher wages? I’m in business to provide a top quality, affordable service, and to hopefully make a profit in the process, not to hire more workers and pay higher wages.

In my world, hiring more workers and paying higher wages are by-products of increased demand. But since demand is still a far cry from where it was in 2007, why would I suddenly alter my goals toward hiring more workers and paying them higher wages? If demand were to suddenly increase, I might be forced to hire more workers and/or offer higher wages, but I would not do so to receive a deficit-financed government reward.

If, and when, I decide to hire another employee, the decision will be solely based on demand. But as long as the economy remains in its present lackadaisical state, if enacted, Mr. Obama’s proposed reward will wind up just like the 17 other so called tax cuts he has offered to small businesses over his failed term – another waste of paper and ink. If anything, what small business owners lack is an incentive to succeed, not more rewards for jumping through narrowly defined governmental hoops.

Goals, Rewards and Incentives

In order to understand how illogical Mr. Obama’s proposal is, one must have an understanding of goals, rewards and incentives. A goal is simply the purpose toward which an endeavor is directed. And while a reward is a positive reinforcement granted after the performance of a desired behavior, an incentive is an expectation of reward, offered in advance, in order to induce action or motivate effort.

Goal: The purpose toward which an endeavor is directed; an objective.

Reward: The return for performance of a desired behavior; positive reinforcement.

Incentive: An expectation of reward that induces action or motivates effort.

In the matter at hand, an incentive would be something offered upfront to motivate small business owners to reach their own goals. But what Mr. Obama has proposed is to reward small business owners after they achieve a government-imposed goal.

According to Mr. Obama, the measure of success for a small business lies in the number of persons it employs. What’s wrong with this theory? The main problem is that it fails to align with the realistic goals of most small businesses. Following is a list of goals for my small business. As you can see, hiring more workers and paying them higher wages isn’t on the list.

  1. Offer top quality services at affordable prices.

  2. Make a profit.

  3. Control costs.

  4. Maintain sufficient demand to remain viable.

  5. Meet all current obligations with current revenue.

  6. Payoff existing debt without incurring more.

  7. Build and maintain a prudent reserve.

  8. Achieve moderate growth, in-line with current resources.

Hiring more workers and paying them higher wages might be Obama’s goal for business owners, but what business has he ever run? Common sense dictates that hiring more workers and paying higher wages are by-products of successful business practices, not primary objectives. It is only when small business owners meet their goals that business activity, hiring and wages increase. So instead of offering a reward for something low on the priority list of small business owners (not even on my list), Congress could do better by offering an incentive to help small businesses reach their true goals. Number one on that list is, indisputably, a reduction of individual income tax rates.

Lower Individual Income Tax Rates

Like me, since most small business owners are taxed at the individual level, lowering individual income tax rates will support small businesses in the following ways:

  1. Helps small businesses keep prices level by not forcing them to raise prices to meet higher income tax obligations.

  2. Enables small companies to maintain the same effective profit margin, in the present unstable economy, without raising prices or slashing expenses.

  3. Makes it easier to control costs without raising prices, or laying-off existing workers.

  4. Helps small companies stay in business in the face of lower demand, which is the by-product of oppressive government taxing and regulatory policies.

  5. Allows small businesses to meet current obligations without incurring additional debt.

  6. Enables small companies to pay down existing debt without incurring more.

  7. Allows small companies to build prudent reserve accounts to meet obligations in the face of future business cycle downturns.

  8. Helps small companies achieve moderate growth in-line with existing resources.

In addition, lowering individual income tax rates will enable increased consumer demand for the products and services offered by small businesses, since a rate cut would apply to everyone across-the-board. Lower income tax rates are therefore a win-win for the economy.

Who asked you anyway?

The only one asking for tax breaks for small businesses that hire more workers and pay them higher wages is Barack Obama. No small business owner that I know has requested any such nonsense. But on the other hand, everyone that I know would benefit from the incentive of lower individual income tax rates. If we can’t agree on this, can we at least agree not to raise individual income tax rates?

Raising tax rates on small business owners on January 1, 2013, which is what’s really on the table, will not help them reach their goals, nor will it achieve Mr. Obama’s fallacious goal. Raising taxes will rather have the opposite effect. Even if the proposed carrot on a stick, tax breaks for those who hire more workers and pay higher wages, is offered, the pending tax hikes will negate that reward, leaving both those who take the bait, and those who don’t in jeopardy.

Arbitrarily hiring more workers and paying higher wages, in a stagnant economy, will force small businesses to raise prices on existing customers, and raising prices, without regard to demand, will have the effect of reducing demand, as customers seek lower cost alternatives. The resulting drop in demand, in the face of higher costs, will lead to further price hikes, in order to meet current obligations. In effect, pursuing the third item on Mr. Obama’s ‘To-Do List’ would land most small businesses – out-of-business – in double-time.

I am frankly sick and tired of all the special interest gimmicks conjured from the illogical mind of an amateur. What Mr. Obama ought to do at this point is simply surrender the keys, and let someone who knows what they’re talking about manage the economy. That’s what I call a logical conclusion.

“Companies are not charitable enterprises: They hire workers to make profits. In the United States, this logic still works. In Europe, it hardly does.” ~ Paul Samuelson

Related:

Picture via: Christ, My Redeemer


Manipulation 401 : U-3 vs Real Unemployment


Another 522,000 left the labor force in April 2012.

April’s Bogus Unemployment Rate

* By: Larry Walker, Jr. *

Now that economists, media pundits, and the Obama administration have weighed in with half-hearted and inaccurate theories respecting April’s decline in the U.S. unemployment rate, it’s time to set the record straight. We learned yesterday, that the official rate declined from 8.2% in March to 8.1% in April, but what’s really beneath the decline? To know, one must have an understanding of how the unemployment rate is calculated, and how to access the appropriate reports. From there it’s just a matter of simple mathematics. After poring through the numbers, I have concluded that the official unemployment rate actually rose to 8.3% in April, while the real unemployment rate ticked up to 11.1%.

According to the U.S. Bureau of Labor Statistics (BLS), as of May 4, 2012, “Nonfarm payroll employment rose by 115,000 in April, and the unemployment rate was little changed at 8.1 percent.” What’s wrong with this pronouncement? The quandary is that nonfarm payroll employment comes from Establishment Data, reported in Table B-1, and has nothing to do with the official unemployment rate. The official unemployment rate is completely derived from Household Data, which is found in Table A-1.

Nonfarm payroll employment and the official unemployment rate are inapposite (one has nothing to do with the other). In fact, if you take a gander at Table A-1, from which the unemployment rate is officially derived, you will notice that the number of employed persons actually declined by 169,000 from March to April of 2012. Does it make sense that establishments reported the creation of 115,000 jobs, while households reported losing 169,000 jobs? Which data set are we to trust? Well, since most of the hoopla surrounds the decline in the unemployment rate, we shall focus on Household Data.

As I outlined in Manipulation 101: The Real Unemployment Rate, the Labor Force is comprised of those who are either Employed or Unemployed, and the Unemployment Rate is calculated by dividing the number of unemployed persons by the size of the labor force, as follows:

[ (A) Total Unemployed / (B) Labor Force = (C) Unemployment Rate ]

Thus, the official unemployment rate of 8.2% in March, as reported by the Bureau of Labor Statistics on April 6, 2012, was calculated as follows:

[ 12,673,000 / 154,707,000 = 8.2% ]

As shown in the table below, at the end of March 2012, 12,673,000 persons were officially unemployed, out of a labor force totaling 154,707,000, equaling an unemployment rate of 8.2%. Got it?

To take it a step further, if 12,673,000 persons were unemployed, out of a labor force of 154,707,000, then it should follow that the remaining 142,034,000 were employed. I found this to be consistent with BLS data and labeled the number of employed as item (D) in the table above. Next, in order to determine whether or not the decline in the unemployment rate is completely bogus, we must take into account some additional statistics from Table A-1, so I included the number of persons “Not in the Labor Force” (E), and the “Civilian Noninstitutional Population” (F). Now we will compare the March statistics to April’s calculation.

The April Employment Situation Summary concluded that a total of 12,500,000 persons were unemployed, out of a labor force totaling 154,365,000, equaling a decline in the official unemployment rate to 8.1%, from 8.2% in March. So what changed?

Comparing the monthly changes in the table below, you will note that from March to April, the number of unemployed persons (A) declined by 173,000. This would be a good thing, if they were all able to find jobs, right? So how many found jobs? Well, none. As you can see, according to Table A-1, the number of employed persons (D) also fell by 169,000. Since the number of employed and unemployed persons both declined, where did they go? As you can see the entire labor force declined by 342,000. Is it a coincidence that 173,000 plus 169,000 equals 342,000? No, it’s not.

The number of unemployed persons declined by 173,000, not because they were able to find work, the BLS merely removed them from the labor force. The BLS also removed an additional 169,000 persons from the labor force, who were considered employed just a month prior. Thus, 169,000 persons were ushered directly from a status of employed in March, to completely out of the labor force by the end of April. Does this raise any eyebrows? Also noteworthy are changes in the number of persons “Not in the Labor Forcewhich increased by 522,000, and the “Civilian Noninstitutional Population” which increased by 180,000. How de we reconcile this?

Reconciliation

The table below summarizes the truth behind the decline in the official unemployment rate.

Here’s what happened.

  1. The number of unemployed persons declined by 173,000 in April.

  2. The number of employed persons declined by 169,000 in April.

  3. The labor force declined by 342,000 in April, which is the sum of #1 plus #2.

  4. The 342,000 persons in #3, who officially dropped out of the labor force in April, were added to those considered “Not in the Labor Force”.

  5. The Civilian Noninstitutional Population (working age population) increased by 180,000 in April, but none entered the labor force.

  6. The number of persons counted as ”Not in Labor Force” increased by 522,000 in April, which is the sum of the 342,000 persons who were previously counted as unemployed (173,000) and employed (169,000), plus the 180,000 new working age persons who were swept under the rug.

Sequitur

To sum it up, in April, 342,000 persons dropped out of the labor force, while another 180,000 new entrants fell by the wayside. In effect, a total of 522,000 persons were removed from the labor force. So what would the official unemployment rate have been had the 342,000 April dropouts been instead left in the labor force and counted as unemployed? The answer is 8.3%, as shown below. Thus, the true unemployment rate ticked up by 1 basis point, from 8.2% in March to 8.3% in April, rather than down by 1 basis point as the BLS reported.

The labor force has historically grown at an annual rate of 1.0% (mirroring population growth), but looking back to December of 2008, it is safe to state that the labor force stopped growing altogether since Obama’s inauguration (see chart below). [Note: The labor force participation rate has likewise declined from 65.8% to 63.6% over the same period, or by 220 basis points.]

Final question: What would the unemployment rate be if the 1.0% per annum shortfall in the labor force, since January of 2009, was restored? Well, since 40 month’s have passed, the labor force should have grown by 3.33% ((1.0% / 12) * 40). And since the labor force stood at 154,626,000 in December of 2008, it should have grown to 159,775,000 by April of 2012, a difference of 5,149,000. Thus, the real unemployment rate is 11.1%, not 8.1%, as shown below.

Are we really moving the right direction? That depends on ones definition of the word “right”. Is manipulating the truth right?

“Anyone who doesn’t take truth seriously in small matters cannot be trusted in large ones either.” ~ Albert Einstein

Data:

Spreadsheets

Real GDP Per Capita — Dead!

Moving Forward — Without Obama

* By: Larry Walker, Jr. *

Why do I get the eerie feeling that we’ve gotten nowhere in the last four years? The answer is because we’ve gone precisely nowhere with Obama. As the chart above displays, on a per capita basis, real gross domestic product has declined by a cumulative -0.20% during Obama’s four-year term (through Q1 2012).

President’s Ronald Reagan and Bill Clinton both inherited rather weak economies. Each achieved real GDP per capita growth of 1.52% in the first year in office, but by the second year, Reagan’s cumulative GDP had declined to -1.35%, while Clinton’s rate climbed to 4.34%. Yet by the end of the fourth year, Reagan’s policies resulted in cumulative GDP per capita growth of 8.47%, versus Clinton’s 8.19%. Man, whatever Reagan was onto needs to be codified and replayed, over and over and over again. Needless to say, both were overwhelmingly re-elected.

George W. Bush inherited a really crummy economy. After only achieving real per capita growth of 0.08% in his first year, by his fourth, Bush’s policies had grown the economy to cumulative real GDP per capita of 5.06%. And with that, Bush ’43 was easily re-elected.

The policies of Reagan, Clinton and Bush ’43 moved America ‘forward’. That’s what I call progress – moving the economy forward in real and measurable terms. Terms that every American could see, touch and feel in their own billfolds, as real GDP per capita was spread around, lifting many from poverty and mediocrity into new realities.

Why Real GDP Per Capita?

Why measure GDP on a per capita basis? GDP is an aggregate figure which does not consider differing sizes of nations. Therefore, it should be stated as GDP per capita (per person) in which total GDP is divided by the resident population on a given date.

Why use chained dollars? When comparing GDP figures from one year to another, it is desirable to compensate for changes in the value of money – i.e., for the effects of inflation. The factor used to convert GDP from current to constant values in this way is called the GDP deflator. Unlike the Consumer price index, which measures inflation or deflation in the price of household consumer goods; the GDP deflator measures changes in prices of all domestically produced goods and services in the economy.

It is only by comparing cumulative changes in real GDP per capita that we are able to understand whether today’s economic policies are helping or hurting. Furthermore, by making the comparison in 4 and 8 year increments we are able to determine whether to re-elect a POTUS or send him packing, or to continue with the same party affiliation or make a break towards independence. So where do we stand today?

GDP is Dead

Although Barack Obama also inherited a bad deal, his policies made it worse. The economy was declining at a real per capita rate of -1.27% in 2008, but by the end of 2009, Obama turned that into a decline of -4.33%. That’s a fact. Then, by the end of his second year, Obama’s stimulus programs resulted in a slight improvement, as the economy achieved negative cumulative growth of -2.15%. Although similar to Reagan’s second year decline to -1.36%, that’s where all similarities end.

Now in his fourth year (as of Q1 2012), Obama has achieved cumulative real GDP per capita growth of -0.20%. Compared to Reagan, Clinton, and Bush ‘43’s fourth year benchmarks of 8.47%, 8.19% and 5.06%, Obama is clearly a first-term loser. In absolute terms, the economy has gone nowhere under Obama. In terms that really matter, inflation adjusted dollars, as a percentage of the population; the economy hasn’t moved at all under the policies of Barack Obama. We are still below zero as far as real per capita growth – below zero, in spite of $6.3 trillion of additional debt. If Barack Obama is re-elected, he will be the only POTUS in modern history to be reinstated based on driving our economy into the ground.

Forward

“If you cry ”Forward” you must be sure to make clear the direction in which to go. Don’t you see that if you fail to do that and simply call out the word to a monk and a revolutionary, they will go in precisely opposite directions?” ~ Anton Chekhov

Forward? Yes, we will be moving forward – without Obama. The distraction of rising student loan interest rates is irrelevant in a shrinking economy. The concepts of a fair shot and a fair share are inapposite and unworthy of further discussion given the circumstances. And this garbage about being the only American around capable of giving a nod to take out a dangerous radical jihadist is just that – garbage.

I care about my children, my grandchildren, my parents, my sisters, my friends, my business, my customers, my community and my neighbors, but I could care less about Afghanistan. Why are Americans still dying in that cesspool? If Obama really wants to take responsibility for all of his actions, then why not include the fact that 69% of U.S. Afghan War casualties have occurred during his 39 month command? Explain that! How did Obama manage the war for only 30% of the time, 3 years out of 10, yet wind up responsible for 69% of the casualties?

Between the trail of blood, death and destruction abroad and his tanking of the economy at home there’s really no reason to grant Obama a second chance. It’s time for Obama to give up the keys, stop impersonating a president, and go home. Only new leadership will move America forward.

References:

Bureau of Economic Analysis, Table 7.1. Selected Per Capita Product and Income Series in Current and Chained Dollars (A) (Q)

Spreadsheet:

Per Capita Product and Income

Rising Interest on Federal Debt | Don’t Double My Rates

Hey, Don’t Double Obama’s Rates!

* By: Larry Walker, Jr. *

Mr. Obama asked students at the University of North Carolina yesterday afternoon to tell their members of Congress one thing: Don’t double my rates.

Once again, Mr. Obama doubled down on flimflam, this time misdirecting towards rising interest rates on student loan debt — instead of targeting the rising cost of interest on the federal debt. According to the White House, interest on the federal debt is projected to surpass $1.0 trillion per annum by the year 2020. Mr. Obama also failed to mention the $494 billion tax hike scheduled to hit American taxpayers on January 1, 2013.

According to Mr. Obama, “Five years ago, Congress cut the rates on federal student loans in half. That was a good thing to do. But on July 1st — that’s a little over two months from now — that rate cut expires.  And if Congress does nothing, the interest rates on those loans will double overnight…. And just to give you some sense of perspective — for each year that Congress doesn’t act, the average student with these loans will rack up an additional $1,000 in debt — an extra thousand dollars.  That’s basically a tax hike for more than 7 million students across America…”

If rising interest rates on student loan debt represents a tax hike, what are we to make of next year’s higher income tax rates?

Nine years ago, Congress cut income tax rates across the board. That too was a good thing to do. But on December 31st — that’s a little over eight months from now — those rates expire. And if the U.S. Senate does nothing, income tax rates will rise overnight… Tax policies in seven different categories will expire, including the Bush Tax Cuts, the payroll tax cut, and the AMT Patch. Plus five of the 18 new tax hikes from Obamacare will begin. And just to give you some sense of perspective — Taxmageddon is a $494 billion tax increase, so each year that the U.S. Senate doesn’t act, every man, woman, and child in America will rack up an additional $1,500 in income taxes — an extra fifteen hundred dollars. That’s an extra $6,900 for every U.S. taxpayer (the 50% of us who actually pay income taxes) – an extra six thousand nine hundred dollars.

So should my three children, who are all in college, be worried more about rising interest rates on student loans, dismal employment prospects, looming tax hikes, or rising interest on the federal debt?

Rising Interest on the Federal Debt

Based on Obama’s fiscal year 2013 budget, per Table 27-13, Baseline Budget Authority and Outlays by Function, Category, and Program, Gross Annual Interest on Treasury Debt Securities is projected to grow from $453.9 billion in 2011 to over $1.0 trillion by 2020, and to surpass $1.2 trillion by the year 2022 (see Chart below). Since this represents about half of the government’s current revenue, that doesn’t leave much room for anything other than Social Security and Medicare.

Today’s college students need to give serious and careful thought to a lot more than interest rates on student loan debt. Within the next eleven years, on a cumulative basis, the U.S. Government will incur more than $9.3 trillion in interest on the federal debt (see Chart below). That equates to roughly $30,000 for every man, woman and child in America. And since only 50% of working Americans pay income taxes, for those fortunate enough to obtain gainful employment, it amounts to nearly $131,378 each. And that’s just over the next eleven years — an extra one hundred and thirty one thousand three hundred and seventy eight dollars.

Thanks, Mr. Obama, for sugarcoating the dire consequences of your lack of a cohesive economic plan, and for sacrificing my children and grandchildren’s futures in lieu of your own selfish ambitions.

Tables

Reference:

Table 27-13. Current Services Budget Authority and Outlays by Function, Category, and Program

Evacuated Tube Transport | A Silver Bullet

Nix the Bullet Train to Bankruptcy

* By: Larry Walker, Jr. *

Forget about airplanes, electric cars, algae biofuel, and the bullet train to bankruptcy, evacuated tube transport is the wave of the future. At 1/10th the cost of high speed rail, and 1/4th the cost of a freeway, with top speeds of 370 mph intrastate and 4,000 mph interstate/international, silent, safe, and faster than jets, ET3’s six passenger frictionless magnetic levitation capsules are far more viable than any other form of transportation on the horizon.

Does the idea of travelling from New York to L.A. in 45 minutes, without a TSA pat down, and at a fraction of the cost sound appealing to you? Would I buy a ticket? Hell yeah! I would ride today if I could. Looks like the government can cancel its plans on that $500 billion high-speed rail network to nowhere. It’s already obsolete.

There’s just one caveat: Let the private sector run it.

Reference: http://www.et3.com/

Passing the Buck and Taking Names | Obama’s GSA

* By: Larry Walker, Jr. *

“Ultimately the buck stops with me… I’m going to be accountable.” ~ Barack Obama *

What a load of bull! Harry Reid’s U.S. Senate hasn’t passed a budget resolution since April 29, 2009. Barack Obama hasn’t presented a budget, at least not one acceptable to either Democrats or Republicans, since the day he set foot in office. Yet he thinks he should keep his job. But that’s not how it works in America. Obama was given a fair shot; he had his fair share of opportunities, but he chose to pass the buck, running his mouth instead of governing, and now it’s time to give someone else a shot.

U.S. Gross Domestic Product has grown by a mere 7.59% from 2007 to 2011, or at an average annual growth rate of a pathetic 1.90%. But Federal Agency spending has increased by 32.04% over the same period, or at an average annual growth rate of 8.01%. Does the fact that Agency spending outpaced the economy by 322% sound any alarms? Well if we had a chief executive who was paying attention it would. This is an outrageous, hair-raising, mind-boggling, egregious, statistical fact, yet all U.S. taxpayers have heard for the last three plus years are threat after threat of higher taxes.

The Bush tax cuts are out, no they’re in. The payroll tax cut is gone, no it’s back. The AMT Patch is dead, no it’s still breathing.’

And now we have to contend with yet another threat, Taxmageddon. Taxmageddon is a $494 billion tax increase that strikes at the beginning of 2013. This time it’s the largest tax increase in U.S. history, scheduled to hit us smack in the face on January 1, 2013. Under current law, tax policies in seven different categories will expire, including the Bush Tax Cuts, payroll tax cut, the AMT Patch, plus five of the 18 new tax hikes from Obamacare will begin, see Taxmageddon: Massive Tax Increase Coming in 2013.

Unusual uncertainty remains unusually uncertain.

With Taxmageddon looming, the GSA scandal is well-timed. It has undeniably exposed the truth. And the truth is that the federal government has been living large through its discretionary spending, throwing our future to the wind, while we’ve been left sitting on pins and needles. Since the economy is practically at zero growth, where do these morons think the money to pay higher taxes will come from? I find it amazing, simply amazing, that no one has been in charge of the national purse for the last three-plus years. Absolutely no one has kept tabs on how our tax dollars were spent. We deserve better.

With an estimated $6.3 Trillion borrowed and squandered on Obama’s watch, and red flags abounding, it makes me sick to my stomach that politicians are suddenly concerned. You would have to be blind or not paying any attention to federal spending whatsoever to not notice the humongous 6,896.30% increase in the GSA’s expenditures from 2007 to 2011. Why blame the GSA? Blame yourselves, or blame Obama. The buck stops with Obama, right? So fire him. Put Obama on trial.

Maybe if someone wasn’t on the golf course, on vacation, or campaigning every other week (at our expense), and instead actually took time to study the budget “line by line”, and to work with Congress on cutting and capping spending, the GSA incident wouldn’t have occurred. I call it not doing the job you were elected to do. But hindsight is 20/20; foresight is not reelecting someone who has proven he can’t handle the job.

Does the following condensed OMB table, Outlays by Agency, which compares government spending growth from 2007 to 2011, raise any flags? If you ask me, the entire record is a red flag. The General Services Administration is an obvious bell ringer, its expenditures having grown from $27 million in 2007, to over $1.8 billion in 2011, or by 6,896.30%. But it’s not the only agency that should concern us, frankly they all should.

As you scan through the following highlights, keep in mind that the entire U.S. economy grew by a mere 7.59% over the four-year period, or at average annual growth of 1.90%.

  • The Department of Agriculture’s four-year spending growth was 65.11%, with average annual growth of 16.28%. You would think they were actually growing crops or raising livestock, but we know that’s not the case, so why have annual expenditures increased by $54.9 billion? Cut it.

  • The Department of Commerce’s four-year spending growth was 53.36%, with average annual growth of 13.34%. You would think they were actually manufacturing products or providing services, but we know that’s not the case, so why have annual expenditures increased by $3.5 billion? Cut it.

  • The Department of Energy’s four-year spending growth was 55.95%, with average annual growth of 13.99%. You would think they were actually producing electricity, mining coal or drilling for oil, but we know that’s not the case, so why have annual expenditures increased by $11.3 billion? Cut it.

  • The Department of Labor’s four-year spending growth was 177.58%, with average annual growth of 44.40%. You would think they were actually performing job placement services, but we know that’s not the case, so why have annual expenditures increased by $84.4 billion? Cut it.

  • The Department of State’s four-year spending growth was 77.29%, with average annual growth of 19.32%. You would think they were annexing nations and granting Statehood, in order to increase GDP, but we know that’s not the case, so why have annual expenditures increased by $10.6 billion? Cut it.

  • The Department of Veterans Affairs’ four-year spending growth was 74.36%, with average annual growth of 18.59%. Is this sustainable on average annual GDP growth of just 1.90%? Not hardly. So why have annual expenditures increased by $54.1 billion? Cut it.

  • The Corps of Engineers–Civil Works’ four-year spending growth was 158.75%, with average annual growth of 39.69%. You would think they were actually building roads and bridges, but we know that’s not the case, so why have annual expenditures increased by $6.2 billion? Cut it.

  • The Small Business Administration’s four year spending growth was 424.51%, with average annual growth of 106.13%. You would think they were actually making loans directly to small businesses, but we know that’s not the case, so why have annual expenditures increased by $4.9 billion? Cut it.

  • The Social Security Administration’s (On-Budget) four-year spending growth was 182.82%, with average annual growth of 45.70%. On-budget spending isn’t mandated, it’s not the entitlements portion in which Social Security Taxes offset payments to retirees and those with disabilities. No, this is interest and principal repayments of previously looted funds, and coverage of shortfalls due to the payroll tax cut and other gimmicks. You would think they were actually increasing benefit checks or lowering Medicare premiums, but we know that’s not the case, so why have annual expenditures increased by $100.4 billion? Cut it.

  • Total Federal Outlays experienced four-year spending growth of 32.04%, with average annual growth of 8.01%. With that kind of spending, you would think our economy would have grown by more than 7.59% over the four-year period, and achieved far more than average annual growth of 1.90%, but we know that didn’t happen, so why have annual expenditures increased by $874.4 billion? Has the economic stimulus program of 2009 become permanent? Cut it.

  • And last but far from least, the General Services Administration’s four-year spending growth was a whopping 6,896.30%, with average annual growth of 1,724.07%. You would think they were throwing some really wicked parties, or something. Oh, it turns out that was the case! No wonder annual expenditures increased by $1.9 billion. Just cut it.

Our government is spending at a rate which is 322% greater than the underlying economy. We call this “unsustainable”. What do you call it? The egregious growth of the GSA’s expenditures should have been caught long before it became a public scandal. Has anyone in the District of Columbia been paying attention for the past three years? You would think Obama would have caught this with his vast experience running companies, governing States, and all. Oh that’s right, he doesn’t have any experience.

I just gave you $340.2 billion of simple budget cuts, while Obama refuses to acknowledge the problem. If you still don’t get it, here’s the wrap.

The economy isn’t growing. The government is spending at a rate which is 322% greater than its underlying economy. Every additional dollar of tax revenue sucked out of our stagnant economy will cause the economy to decline further, while government continues to live the high life. Since there is no additional revenue to garner, government spending must be cut. The economy was on fire in 2007 on dramatically less government spending. Therefore, returning to the budget of 2007 damages nothing, other than Obama’s plan to bankrupt the nation. If Obama isn’t trying to bankrupt the USA, then what is he doing?

Fire Obama! Cut government spending. Cut the B.S. Cut it big. And cut it now!

References:

Table 4.1—Outlays by Agency: 1962–2017

BEA—Gross Domestic Product and Personal Income

Spreadsheets

Obama’s Secretarial Tax Fallacy

By: Larry Walker, Jr.

There’s no way Obama’s secretary paid a higher effective tax rate than the Obamas. You don’t believe it? Are income taxes such a mystery that we can’t figure it out? Well, let’s run the numbers and see.

According to Jake Tapper of ABC News, Mr. Obama released his 2011 federal income tax today, with he and his wife reporting an adjusted gross income of $789,674. The Obamas paid $162,074 in total tax – an effective federal income tax rate of 20.5%.

The White House also reported that President Obama’s secretary, Anita Decker Breckenridge, makes $95,000 a year. White House spokeswoman Amy Brundage told ABC News that Breckenridge “pays a slightly higher rate this year on her substantially lower income, which is exactly why we need to reform our tax code and ask the wealthiest to pay their fair share.”

The only problem with this story is that Amy Brundage doesn’t know how to compute a tax return, or an effective tax rate. If Ms. Breckenridge were single, made wages of $95,000, and had no other dependents or deductions, her standard deduction would have been $5,800 and her personal exemption $3,700. So taking Ms. Breckenridge’s income of $95,000 and subtracting her deductions of $9,500 results in taxable income of $85,500, and a total income tax of $17,564 (click the tax return image below to enlarge). Thus, her effective tax rate is 18.4% (17,564 / 95,000). The last time I checked 18.4% was less than not greater than 20.5%.

Is the Obama Administration so delusional that it believes the American public doesn’t understand basic math? Get a clue! Or ask an accountant. In my opinion we’re all paying way too much for the incompetence of this government. The mainstream media should be ashamed for not verifying the numbers. And Obama’s definitely on the wrong track, one which should (should have) lead to the end of his short and sorry career. That suits me fine.

Note: What I have calculated above is the maximum effective tax rate possible for a single person with $95,000 of gross income. However, if Ms. Breckenridge is married her tax rate will be lower, if she has dependents her total tax will be reduced, if she owns a home and pays mortgage interest, gives to charity, or pays a substantial amount in State taxes she could itemize deductions on Schedule A, any combination of which would make her effective tax rate substantially lower than 18.4%.

Fair Shot, Fair Share and a Glass of Algae

* By: Larry Walker, Jr. *

“Lake Erie is facing its worst toxic algae bloom since the 60’s and somehow it is going unnoticed…” ~ JoeOH111 *

According to Mr. Obama, you don’t have a fair shot right now, and it’s all because millionaires aren’t paying enough income tax. If millionaires would just give the federal government its fair share, then you, I, and everyone else would have a fair shot…, and a glass of algae.

What, pray tell, is a fair shot?

The best definition I can surmise is “a lawful chance at odds.” But don’t we all have this already? For example, the odds of winning the recent $640 million Mega Millions jackpot were 1 in 176 million. In order to guarantee a win, one would have had to spend $176 million buying up every combination. So if some nefarious millionaire had purchased all 176 million combinations, would he or she have had an unfair advantage?

Well, perhaps, but what millionaire would be dumb enough to blow $176 million on lottery tickets? What are the odds of that ever happening? The odds of one person buying all 176 million winning combinations, across multiple States, would probably be 1 in (infinity). In other words, a guaranteed win is impossible, at least when it comes to the Mega Millions lottery. But a fair shot is open to anyone who plays the game. “You gotta be in it to win it.”

According to CBS News, one person purchased $2,600 worth of lotto tickets, and another threw down $55, while the more frugal played their usual dollar or two. Did the one who blew $2,600 have an unfair advantage over $55 and $1 players? I will concede that the $2,600 player had an advantage, but I would hesitate to call it unfair. The poor sap simply had more to lose, yet not a dime more to gain. Not one dime. Now let’s flip over to the Mega Trillions Federal Debt Lotto.

Mega Trillions Federal Debt Lotto

If a taxpayer earns $176 million in taxable income and pays $29.9 million in federal taxes (a rate of 17%), while another earns $50,000 and pays $8,500 in taxes (also a rate of 17%), and yet another earns $25,000 and pays $0, does either have an unfair advantage? Since both the millionaire and the $50,000 wage earner pay the exact same tax rate (17%), the non-taxpayer has an advantage. But is it an unfair advantage? I would say so, especially since in the recent past we all pitched in at every level of income. Yet the one paying $29.9 million in taxes has a lot more to lose than both the $8,500 payer, and the non-taxpayer.

But who wins in this crapshoot? With the federal government borrowing and spending hundreds of billions of dollars, in advance, and squandering it to produce test-tube sewage-fed algae biomass for fuel, while Lake Erie and other U.S. lakes are full of “free” blue-green scum, the answer is no one. You’d have to be an idiot to waste hundreds of billions of dollars manufacturing something that’s sitting right in front of your face, wouldn’t you? Hindsight is 20/20, foresight is priceless.

When it comes to the national debt, those who don’t pay federal income taxes make out like bandits, they have nothing to lose. And those who already pay more than their “fair share” (i.e. taxed enough already) have nothing to gain. It’s not the 2% of top earners that worry me, they generally pay their bills on time, but rather the federal government which has already borrowed more than 100% of our entire economy, an amount estimated to reach $16.3 Trillion by September 30th of this year.

Only a depraved leader would have his nose in other peoples finances while ignoring his own debt laden, broken, overspent, and soon to be bankrupt enterprise. The federal government is not the solution to our problems; it’s the $16.3 Trillion in the hole, deadbeat, money squandering, largest debtor-nation in the Universe, leach, which is forever in the way and constantly on our collective back.

The moral of this story: Never confuse motion with action.

In other words, quit giving speeches and fix the problem. No one is going to vote for a tax increase in the middle of an election cycle, no matter how many speeches are enounced and dribbled. Especially not the one proffered, which in the end will barely cover one day’s worth of current deficit spending. No not a one! We don’t have a revenue problem; no, no, no, what we have is a deadbeat, money squandering, and largest debtor-nation in the Universe, ass-backwards, leach of a federal government problem. Get a clue!

Rather than paying more taxes, or spending multi-millions on lottery tickets to become multi-millionaires all over again, our well-to-do brethren would do better by investing in their own casinos, creating jobs and fair shot opportunities for others. And that leads us back to square one all over again: cut taxes, cut spending, and get out of our way and off our backs.

Photo Credit: Lake Erie, Stirred Up | Via: NASA Earth Observatory (March 21, 2012)

The Real Employment Situation – January 2009 through March 2012

* By: Larry Walker, Jr. *

“Our economy’s now created more than 4 million private sector jobs over the past 2 years. And more than 600,000 in the past 3 months alone,” Mr. Obama boasted to a forum at the White House on women and the economy, on Friday (CBS News).

And in related news, on the previous evening, Egan-Jones Ratings Co. cut the U.S.A.’s credit rating one step to AA, the second downgrade in nine months and two levels below its highest grade, with a negative outlook citing the nation’s increasing debt burden (Bloomberg).

Most of us are well aware of the nation’s impending debt implosion, but the real employment situation has been distorted beyond reason. I understand how badly Mr. Obama is fighting against returning to the obscure existence he led prior to 2008, but if he was at all capable, he would at least tell us the truth about where we stand. I’m frankly weary from all the sugarcoating and distortion of facts. So what’s the real employment situation?

The Truth Shall Set You Free!

In order to know the truth, we must examine not so much monthly trends in employment, but rather changes which have occurred from the end of January 2009 through March 2012. When we examine the entire record, we find that our economy hasn’t created any jobs at all over the past 3 ¼ years, on a seasonally adjusted basis. Instead the unemployment rate has risen from 7.8% to 8.2%, the number of nonfarm jobs has declined by 740,000, the number of unemployed persons has increased by 624,000, and total employment has declined by 153,000. Meanwhile, the working age population has grown by 7,865,000, while the civilian labor force has only managed an increase of 471,000, causing the number of persons no longer counted in the labor force to balloon by 7,395,000.

The truth is that our economy hasn’t created any new jobs since Obama’s policies took effect. The total number of jobs peaked at an all time high of 146,595,000 in November of 2007, and through March of 2012 the number stands at 142,034,000, more than 4.5 million off the mark. If we had more jobs than existed in November of 2007, then Obama would have something to brag about, although not much. But since the truth is somewhat inconvenient, we are supposed to ignore the fact that we are more than 4 million jobs in the hole, and submit to repeated media brainwashing and succumb to the belief that we have somehow moved ahead by over 4 million. Phooey! Here are the facts.

Unemployment Rate

The unemployment rate rose from 7.8 percent in January of 2009 to 8.2 percent as of March 2012, according to the U.S. Bureau of Labor Statistics (Employment Situation 4/6/2012). (See table A-1 / Seasonally Adjusted)

Nonfarm Employment

Nonfarm payroll employment declined by 740,000 through March of 2012, from 133,561,000 in January of 2009 to 132,821,000. (See table B-1 / Seasonally Adjusted)

Unemployed Persons

The number of unemployed persons increased by 624,000 through March of 2012, from 12,049,000 in January of 2009 to 12,673,000. (See table A-1 / Seasonally Adjusted)

Total Employment

The number of persons employed declined by 153,000 through March of 2012, from 142,187,000 in January of 2009 to 142,034,000. (See table A-1 / Seasonally Adjusted)

Civilian Noninstitutional Population

The Civilian Noninstitutional Population (working age population) increased by 7,865,000 through March of 2012, from 234,739,000 in January of 2009 to 242,604,000. (See table A-1 / Seasonally Adjusted)

Civilian Labor Force

The labor force increased by 471,000 through March of 2012, from 154,236,000 in January of 2009 to 154,707,000. The labor force hasn’t grown at all since October of 2008. (See table A-1 / Seasonally Adjusted)

Not in Labor Force

The number of persons not in the labor force increased by 7,395,000 through March of 2012, from 80,502,000 in January of 2009 to 87,897,000. (See table A-1 / Seasonally Adjusted)

To make the claim of having created more jobs than Mr. Bush, which we all know was Mr. Obama’s insinuation; he must first match Mr. Bush’s all-time-high of 146,595,000. If the number of persons who involuntarily dropped out of the labor force (7.3 million), since Mr. Obama’s policies took effect, had instead been jobs created, Mr. Obama might go down in history as the all-time greatest. However, since we presently have 4.5 million fewer jobs than existed at Mr. Bush’s peak, and since, under the direction of Mr. Obama, 7.3 million new working age persons have been pushed straight into joblessness and generational dependency, Mr. Obama’s policies should perhaps be branded as the most ineffective in U.S. history.

Since employment is a lagging economic indicator, and because economists are calling for recession in 2012, and since the statistics above represent the sum total of Obama’s economic accomplishments, we’re in for serious troubles ahead. To reiterate, Mr. Obama’s policies of Inordinate Stimulus, Undue Debt and Global Warming Foolishness caused the Looming Recession.

Photo Credit: A swarm of Western Toad tadpoles eating algae. Photo: Kristiina Ovaska

Reference: Bureau of Labor Statistics, Employment Situation Summary

Data: Worksheets