Monday, August 8, 2016: Donald J. Trump delivered remarks on the economy at the Cobo Center in Detroit, MI.

https://www.c-span.org/video/standalone/?413674-1/donald-trump-unveils-economic-plan

Trump Nails It
– By: Larry Walker II –
Last year our trade deficit with Mexico totaled $53.8 billion, and is projected to end about the same in 2015. When the last three decades are summed, we find that the United States 30-year trade deficit with Mexico amounts to $910.2 billion. Although this has been great for Mexico, it hasn’t been so great for the United States.
Looking back over the last 30 years, we find that the United States actually ran trade surpluses with Mexico in 1991 through 1994, and then came the North American Free Trade Agreement (NAFTA – 1994). Since NAFTA, the United States annual trade deficits with Mexico have totaled $897.8 billion (since 1995). By comparison, the deficit amounted to just $13.7 billion during the 9 years preceding NAFTA.
U.S. Trade Deficit with Mexico (1985 to 2015)
2015 $31.2 billion (through July)
2014 $53.8 billion
2013 $54.5 billion
2012 $61.7 billion
2011 $64.6 billion
2010 $66.3 billion
2009 $47.8 billion
2008 $64.7 billion
2007 $74.8 billion
2006 $64.5 billion
2005 $49.9 billion
2004 $45.2 billion
2003 $40.6 billion
2002 $37.1 billion
2001 $30.0 billion
2000 $24.6 billion
1999 $22.8 billion
1998 $15.9 billion
1997 $14.5 billion
1996 $17.5 billion
1995 $15.8 billion
1994 ($1.3) billion (surplus)
1993 ($1.6) billion (surplus)
1992 ($5.4) billion (surplus)
1991 ($2.1) billion (surplus)
1990 $1.9 billion
1989 $2.2 billion
1988 $2.6 billion
1987 $5.7 billion
1986 $4.9 billion
1985 $5.5 billion
Not only are we losing in trade with Mexico, but the Mexican government has allowed millions of its own citizens, and those from nations to its south, to pour over our southern border illegally. That’s right! The Mexican government has been mostly complicit, looking the other way while tens of thousands boarded trains from its southernmost to its northernmost border, allowing them to cross our border without any resistance. Although lately Mexico claims to be clamping down on illegal border crossings, the damage has already been done.
There are folks both left and right who say, “Free-trade is good for America, because it allows us to work less and buy cheaper goods.” Although plausible on paper, the theory fails once we tally the last thirty years results. Looking back over the last 30 years, we discover that not only has the U.S. lost nearly $5.0 trillion in national wealth ($4 trillion to China and $1 trillion to Mexico alone), but according to the Bureau of Labor Statistics, manufacturing jobs in the U.S. have declined from 18.0 million in 1985 to just 12.3 million as of August 2015.
According to Raymond Richman (Ph.D. in Economics from the University of Chicago and Professor Emeritus of Public and International Affairs at the University of Pittsburgh), “We should end our huge chronic trade deficits which have decimated our manufacturing sector and caused the loss of millions of good American manufacturing jobs. Our policy should be balanced trade which economic theory supports rather than free trade which is supported by economic theory only when countries have a common currency and free movement of capital and labor (as among the States of the United States). We should use the “Scaled Tariff” (our invention!), a single-country-variable-tariff that rises as trade deficits widen significantly, whatever the reason, and are reduced to zero as trade is brought into balance.”
Once aware that our flawed trade policy has resulted in the siphoning away of more than $5 trillion in national wealth ($1 trillion to Mexico alone) and 6 million manufacturing jobs, it should be easy to understand how Mexico will pay for the new border wall. Mr. Trump has his finger on two of the most glaring problems with our economy, illegal immigration and our Lose-Lose foreign trade policy. Balancing our trade deficit, by any means necessary, is a vital component in the quest to make America great again.
References:
An Economic Program for Stimulating U.S. Economic Growth
30-Year Trade Deficit with China – Maybe Trump Gets It
U.S. Census Bureau – Trade in Goods with Mexico
Bureau of Labor Statistics – CES Establishment Data – Manufacturing
U.S. Census Bureau – Income and Poverty in the United States: 2013
 |
| Port of Savannah |
Maybe Trump Gets It
-By: Larry Walker II-
This year-to-date, the United States has imported $267.7 billion in goods from China, while exporting just $65.4 billion in goods to China. That amounts to a current year trade deficit of $202.3 billion, in the first seven months alone. Looking back over the last 30 years, the last time our mutual trade comprised any semblance of balance was in 1985.
Our trade deficit with China was a mere $6.0 million in 1985 (the last time it would amount to less than a billion dollars). From a trade deficit of just $6.0 million in 1985, the imbalance suddenly jumped to $1.7 billion by 1986. It has grown progressively worse almost every year since. Last year our trade imbalance with China reached a record $343.1 billion, and it is projected to end higher this year.
When the last three decades are summed, we find that the United States 30-year trade deficit with China amounts to $3.9 trillion. To top it off, the imbalance is clearly growing worse year by year. Although this has been great for China, it hasn’t been so great for the U.S.
U.S. Trade Deficits with China (1985 to 2015)
2015 $202.3 billion (through July)
2014 $343.1 billion
2013 $318.7 billion
2012 $315.1 billion
2011 $295.2 billion
2010 $273.0 billion
2009 $226.9 billion
2008 $268.0 billion
2007 $258.5 billion
2006 $234.1 billion
2005 $202.3 billion
2004 $162.3 billion
2003 $124.1 billion
2002 $103.1 billion
2001 $83.1 billion
2000 $83.8 billion
1999 $68.7 billion
1998 $56.9 billion
1997 $49.7 billion
1996 $39.5 billion
1995 $33.8 billion
1994 $29.5 billion
1993 $22.8 billion
1992 $18.3 billion
1991 $12.7 billion
1990 $10.4 billion
1989 $6.2 billion
1988 $3.5 billion
1987 $2.8 billion
1986 $1.7 billion
1985 $6.0 million
There are folks on both the left and right who say, “Free-trade is good for America, because it allows us to work less and buy cheaper goods.” Although it may be true that free-trade allows us to purchase more goods at lower prices, a problem arises when the exchange is so grossly out of balance. Although plausible on paper, the theory fails once we tally the last thirty years results. Looking back, we discover that not only has the U.S. lost $3.9 trillion in wealth (with just one country), but according to the Bureau of Labor Statistics, manufacturing jobs in the U.S. have declined from 18.0 million in 1985 to just 12.3 million as of August 2015.
The idea of working less and being able to buy cheaper goods might sound great to someone who’s working their behind off and doing well, but not so much for those forced to sit on the sidelines. As I recently commented on an Anti-Trump Trade Policy Video, “How is the guy, in your example, supposed to go to Wal-Mart to buy an imported Chinese TV, if he has no job and is stuck on food stamps, unemployment or welfare? And, why is the poverty rate in the U.S. higher than it was 30 years ago?”
If you think a policy resulting in the siphoning away of $4 trillion in national wealth and 6 million manufacturing jobs is somehow winning, then perhaps that’s why you’re not. Maybe Mr. Trump is more knowledgeable than thou, at least when it comes to the economy.
References:
U.S. Census Bureau – Trade in Goods with China
Bureau of Labor Statistics – CES Establishment Data – Manufacturing
U.S. Census Bureau – Income and Poverty in the United States: 2013
“If it sounds too good to be true, it usually is.” ~ Better Business Bureau
– By: Larry Walker, Jr. –
According to the U.S. Department of Health and Human Services (HHS), there are 7.2 million uninsured Americans ages 18 to 34 years, living in single-person households in 34 states. And, of that total, 2.9 million are eligible to buy health insurance on either federal or state partnership insurance marketplaces. And among those 2.9 million, 1.3 million, or 46%, could pay less than $50 a month for a “Bronze Plan”.
Hmmm. That sounds, well, too good to be true. Let’s see, 1.3 million times $50 equals $65 million per month, or $780 million per year. Sounds like a good deal… for insurers that is, since the balance of the monthly premium, perhaps another $50 or more, will be subsidized by taxpayers, and the risk of actually paying out any benefits, after high deductibles, co-payments and co-insurance levels are met, is next to nothing. What’s a Bronze Plan anyway, a worthless policy that covers nothing?
Generally speaking, the Bronze Plan is intended to have the lowest premium of the 4 new categories of plans (Bronze, Silver, Gold, and Platinum) but charge the highest out-of-pocket costs for healthcare services. For people without employer sponsored insurance, the Bronze plan is the minimum health insurance plan which satisfies the Affordable Care Act’s health insurance mandate.
What HHS doesn’t tell you is that Bronze Plans are designed so that policy owners wind up paying 40% or more of covered healthcare expenses in the form of out-of-pocket fees, and that’s over and above the cost of the plan’s monthly premium. Although out-of-pocket expenses for individuals are expected to be capped at $6,350, keep in mind that this amount is reset each calendar year.
Out-of-pocket expenses include fees like deductibles, copayments, and coinsurance. Different plans will approach the 40% or more that policy owner’s will pay in various ways, so it is important to research the financial details of a specific plan before deciding which one to purchase. For example, a person who has frequent medical expenses may want a Bronze Plan with a lower deductible, because they will be required to pay at least that much of their annual health care expenses – in full.
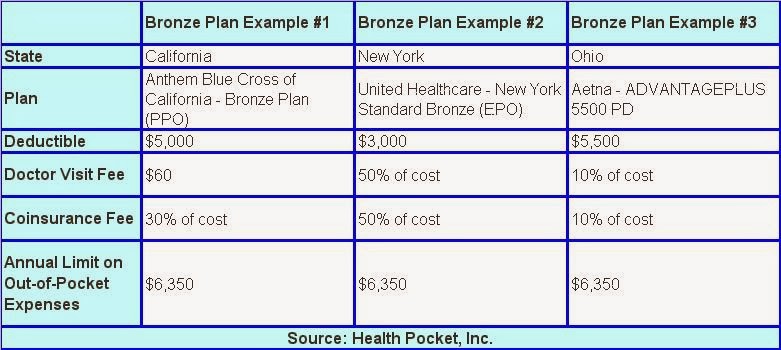
Look over the following examples of Bronze Plans, and then we’ll define the terms and discuss Example #2 in more detail.
Deductible – A deductible is the amount you pay for health care services before your health insurance begins to pay.
Coinsurance – Coinsurance is your share of the costs of a health care service. It’s usually figured as a percentage of the total charge for the service. You pay coinsurance after reaching your annual deductible.
Co-pay – A co-payment, or doctor’s visit fee, is a fixed amount you pay for a health care service, usually when you receive the service. The amount can vary by the type of service. You may also have a co-payment when you get a prescription filled.
Example #2: Okay, so let’s say the New York Bronze Plan (shown above) costs a young person $50 per month. What will he or she receive in return for this premium?
Well, since the annual deductible is $3,000, that means the insurance company won’t pay out a solitary dime, until after the insured pays the first $3,000 in annual health care costs. Then, once this $3,000 annual deductible has been met, the policy only covers 50% of the cost of doctor’s visits (co-pay), and 50% of the cost of all other medical services (co-insurance). It’s not until the insured reaches the annual out-of-pocket limit of $6,350 that the policy kicks in and pays all remaining expenses in full.
I hate to break it to you, but this alleged, under $50 per month, health insurance policy will actually wind up costing the poor sucker who buys it around $3,600 per year ($3,000 deductible + $600 premiums), or $300 per month, before it pays out a single dime in benefits. It will cost even more for plans with higher deductibles, and may wind up costing as much as $6,950 per year ($6,350 annual limit on out-of-pocket expenses + $600 annual premiums), or $580 per month, if ever actually utilized for a substantial amount of qualifying health care expenses.
Then there’s the question of which expenses such a plan actually covers, if any, once its benefits do kick in. Who in the hell knows the answer to that? Since the government’s official website is lacking in detail, even when it’s working, apparently you have to buy it first, in order to find out. Yeah, just call the toll-free number and blindly sign up. I guess it’s better than nothing, although not by much in my opinion. On this earth you get what you pay for, but the cost of nothing is generally free.
The bottom line: Don’t expect much from a health insurance plan costing less than $50 per month. If it sounds too good to be true, it usually is.
References:
How do deductibles, coinsurance and copays work?
Insurance for the young could be less than $50 a month
Bronze Plan – Affordable Care Act (Obamacare)
Related:

The Rise in Part Time Employment since the Great Recession
– By: Larry Walker, Jr. –
There are five categories among all nonagricultural workers who are officially counted as employed: government workers, private household and private industry workers, the self-employed and unpaid family workers. Among them there are three additional status classifications: those employed part time for economic reasons, part time for noneconomic reasons, and those employed full-time. An analysis of recent trends reveals that the number of part time workers is on the increase, while the number of full-time workers is on the decline.
Before we begin, the aforementioned status classifications of nonagricultural workers are defined as follows:
Part time for economic reasons refers to those who worked 1 to 34 hours during the reference week for a reason such as slack work or unfavorable business conditions, inability to find full-time work, or seasonal declines in demand.
Part time for noneconomic reasons refers to persons who usually work part time for reasons such as childcare problems, family or personal obligations, school or training, retirement or Social Security limits on earnings, and other reasons. Excluded are persons who usually work full time but worked only 1 to 34 hours during the reference week for reasons such as vacations, holidays, illness, and bad weather.
Employed full-time refers to those who worked 35 hours or more during the reference week. This includes workers who have both one full-time and part time job as well as those whose combined hours in two or more part time jobs total at least 35. Are you with me so far? Good.
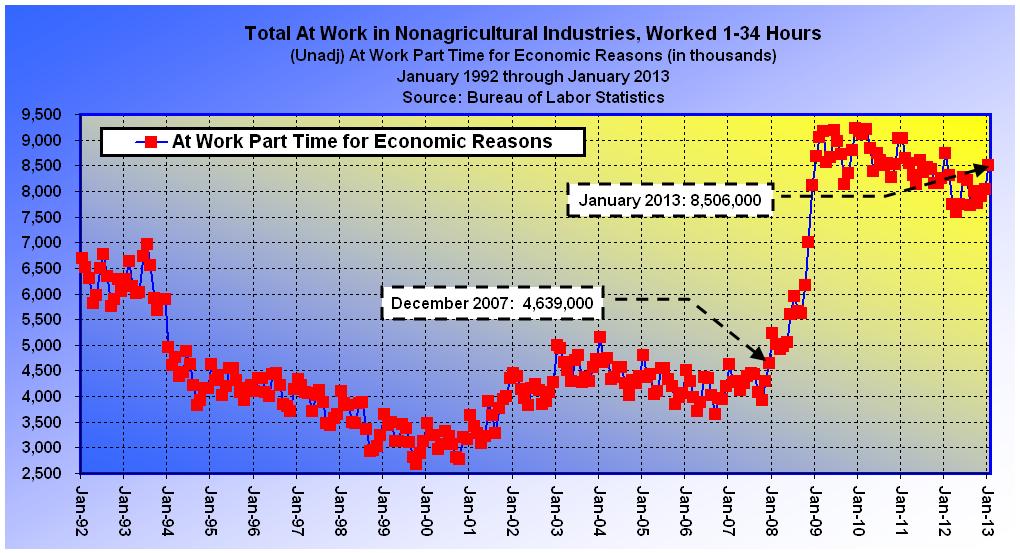
The chart above displays the number of nonagricultural workers employed part time for economic reasons. It extends from January 1992 through January 2013 for historical context, but what should stand out is the difference between where we are today, versus the month the recession began. In December 2007, at the onset of the Great Recession, 4.6 million workers were employed part time for economic reasons. Yet as of last month, three-and-a-half years after the recession ended, the figure stands at 8.5 million, an increase of 3.9 million, or 83.4%. How’s that for progress?
If measured from the peak of misery, I suppose one could perceive an improving situation, however in more concrete terms, Americans are actually worse off today than at any time since 1993. No amount of words can change the facts.
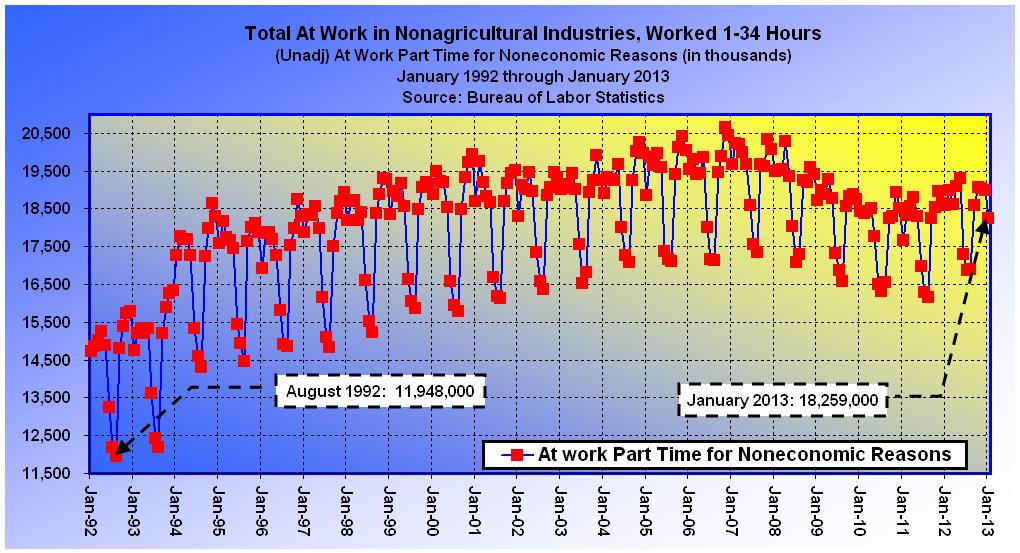
The second chart (above) shows the number of nonagricultural workers employed part time for noneconomic reasons. This isn’t all that relevant on its lonesome, because it represents those working part time because they want to. However, what is significant is that the number has grown by a staggering 6.3 million since the early 1990’s. In fact, when combined with the previous chart, we find that as of January 2013, a total of 26.7 million out of the 139.7 million officially counted as employed (see chart below), or 19.1%, are merely part-timers. This would be great if our workforce was able to work fewer hours for greater pay, without need of governmental assistance, but we all know that’s not the case.
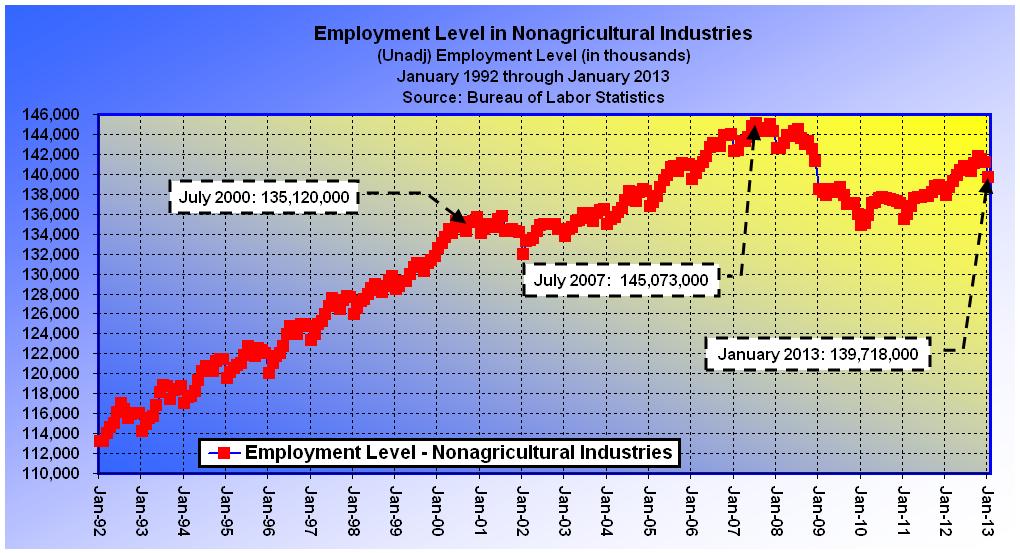
So what? So, the next chart (above) shows that in July of 2000 there were a total of 135.1 million nonagricultural employees, that the number grew to 145.1 million by July of 2007, and that it has since declined to 139.7 million. Again, if measuring from the peak of misery, it would appear that the employment situation has improved, but in real terms, we have 5.4 million fewer workers today, than we had in 2007. Thus, we are effectively back where we left off at the end of 2005, more than seven years ago. I guess that’s good in the eyes of some, but when discounted for the growth in the number of part time workers the situation is bleak.

In the last chart (above), when the number of nonagricultural workers employed part time, both for economic and noneconomic reasons, is subtracted from the total employment level, we find that the number of full-time workers has declined from 123.1 million in July 2007, to 112.9 million in January 2013. In other words, we currently have 10.1 million fewer full-time workers than existed at the pre-recession peak. Also notable is the fact that the number of full-time jobs in existence today, 112.9 million, is fewer than the 115.9 million which existed in July of 2000, more than a decade ago.
I suppose one could find a way to twist these numbers into a bright and rosy future, that is if one has no sense of where we have been or where we are headed, but since government spending is currently twice what it was just a decade ago, and politicians are frantically grasping to fill a gap, which for all of their efforts has merely widened, I fail to comprehend their hardheadedness.
According to POTUS, “We’ve created 6 million new jobs under my administration.” But according to reality, we currently have 5.4 million fewer workers than we had just over five years ago, 10.1 million fewer full-time workers, and 3.9 million more are employed part time for economic reasons. So you tried your plan, and it failed, and the employment situation won’t improve until government stops playing enabler, gets out of the way, and lets God reign.
“Without God there is no recovery, only disappointing substitutions and repeated failures.” ~ Friend of Bill’s
The data presented in this post was obtained through the Current Population Survey (CPS), a monthly sample survey of about 60,000 households conducted by the Bureau of the Census for the Bureau of Labor Statistics.
References:
My Worksheets: Part Time Workers for Web
A Different Look at Part-time Employment | Bureau of Labor Statistics
Table A-8. Employed persons by class of worker and part-time status
Small Business Goals, Rewards and Incentives
* By: Larry Walker, Jr. *
“Contrariwise, if it was so, it might be; and if it were so, it would be; but as it isn’t, it ain’t. That’s logic.” ~ Lewis Carroll *
In his latest weekly address, Mr. Obama outlined a mirage of goals, rewards and incentives which he says Congress ‘must’ act upon immediately. But for the most part, what he proffered are just more of the same tried and failed policies, conjured from the same line of illogical reasoning we’ve heard, time and time again, over the last four years. Therefore, what Mr. Obama coined as a “Congressional To-Do List” should rather be endorsed as the official “Not-To-Do List”. Why? Well, let’s test the logic of just one item on the, so called, ‘To-Do List’.
Mr. Obama said, “Third, Congress should help small business owners by giving them a tax break for hiring more workers and paying them higher wages. Small businesses are the engine of economic growth in this country. We shouldn’t be holding them back – we should be making it easier for them to succeed.”
In order to understand why Mr. Obama’s argument is fallacious, one must understand what an argument is. Very briefly, an argument is an attempt to persuade someone of something, by giving reasons or evidence for accepting a particular conclusion. It consists of one or more premises followed by a conclusion. In a logical argument, the premises support the conclusion. When we place Mr. Obama’s argument in its proper order we arrive at the following:
Premise 1 – Small businesses are the engine of economic growth in this country.
Premise 2 – We (the government) shouldn’t be holding them back – we should be making it easier for them to succeed.
Conclusion – Congress should help small business owners by giving them a tax break for hiring more workers and paying them higher wages.
No one in their right mind would disagree with either premise. Yes, small businesses are the engine of economic growth in the USA. And no, the government shouldn’t be holding us back, but should rather get out of our way, and off of our backs, so that we may succeed. However, the premises Mr. Obama presented do not support his conclusion.
Will the act of offering or failing to offer the reward of tax breaks to small businesses, that hire more workers and pay higher wages, make them any more, or less, the engine of economic growth in America? Will the act of passing additional governmental laws, rules, regulations and loopholes make it any easier for small businesses to succeed?
As a small business owner myself, I can state first hand, that offering my company a reward for hiring more workers and paying them higher wages won’t help my company in the least. That’s because nowhere in my mission statement will you find the stated goals of hiring more workers and paying them higher wages.
How many small business owners do you know that are in business for the purpose of hiring more workers and paying them higher wages? I’m in business to provide a top quality, affordable service, and to hopefully make a profit in the process, not to hire more workers and pay higher wages.
In my world, hiring more workers and paying higher wages are by-products of increased demand. But since demand is still a far cry from where it was in 2007, why would I suddenly alter my goals toward hiring more workers and paying them higher wages? If demand were to suddenly increase, I might be forced to hire more workers and/or offer higher wages, but I would not do so to receive a deficit-financed government reward.
If, and when, I decide to hire another employee, the decision will be solely based on demand. But as long as the economy remains in its present lackadaisical state, if enacted, Mr. Obama’s proposed reward will wind up just like the 17 other so called tax cuts he has offered to small businesses over his failed term – another waste of paper and ink. If anything, what small business owners lack is an incentive to succeed, not more rewards for jumping through narrowly defined governmental hoops.
Goals, Rewards and Incentives
In order to understand how illogical Mr. Obama’s proposal is, one must have an understanding of goals, rewards and incentives. A goal is simply the purpose toward which an endeavor is directed. And while a reward is a positive reinforcement granted after the performance of a desired behavior, an incentive is an expectation of reward, offered in advance, in order to induce action or motivate effort.
Goal: The purpose toward which an endeavor is directed; an objective.
Reward: The return for performance of a desired behavior; positive reinforcement.
Incentive: An expectation of reward that induces action or motivates effort.
In the matter at hand, an incentive would be something offered upfront to motivate small business owners to reach their own goals. But what Mr. Obama has proposed is to reward small business owners after they achieve a government-imposed goal.
According to Mr. Obama, the measure of success for a small business lies in the number of persons it employs. What’s wrong with this theory? The main problem is that it fails to align with the realistic goals of most small businesses. Following is a list of goals for my small business. As you can see, hiring more workers and paying them higher wages isn’t on the list.
Offer top quality services at affordable prices.
Make a profit.
Control costs.
Maintain sufficient demand to remain viable.
Meet all current obligations with current revenue.
Payoff existing debt without incurring more.
Build and maintain a prudent reserve.
Achieve moderate growth, in-line with current resources.
Hiring more workers and paying them higher wages might be Obama’s goal for business owners, but what business has he ever run? Common sense dictates that hiring more workers and paying higher wages are by-products of successful business practices, not primary objectives. It is only when small business owners meet their goals that business activity, hiring and wages increase. So instead of offering a reward for something low on the priority list of small business owners (not even on my list), Congress could do better by offering an incentive to help small businesses reach their true goals. Number one on that list is, indisputably, a reduction of individual income tax rates.
Lower Individual Income Tax Rates
Like me, since most small business owners are taxed at the individual level, lowering individual income tax rates will support small businesses in the following ways:
Helps small businesses keep prices level by not forcing them to raise prices to meet higher income tax obligations.
Enables small companies to maintain the same effective profit margin, in the present unstable economy, without raising prices or slashing expenses.
Makes it easier to control costs without raising prices, or laying-off existing workers.
Helps small companies stay in business in the face of lower demand, which is the by-product of oppressive government taxing and regulatory policies.
Allows small businesses to meet current obligations without incurring additional debt.
Enables small companies to pay down existing debt without incurring more.
Allows small companies to build prudent reserve accounts to meet obligations in the face of future business cycle downturns.
Helps small companies achieve moderate growth in-line with existing resources.
In addition, lowering individual income tax rates will enable increased consumer demand for the products and services offered by small businesses, since a rate cut would apply to everyone across-the-board. Lower income tax rates are therefore a win-win for the economy.
Who asked you anyway?
The only one asking for tax breaks for small businesses that hire more workers and pay them higher wages is Barack Obama. No small business owner that I know has requested any such nonsense. But on the other hand, everyone that I know would benefit from the incentive of lower individual income tax rates. If we can’t agree on this, can we at least agree not to raise individual income tax rates?
Raising tax rates on small business owners on January 1, 2013, which is what’s really on the table, will not help them reach their goals, nor will it achieve Mr. Obama’s fallacious goal. Raising taxes will rather have the opposite effect. Even if the proposed carrot on a stick, tax breaks for those who hire more workers and pay higher wages, is offered, the pending tax hikes will negate that reward, leaving both those who take the bait, and those who don’t in jeopardy.
Arbitrarily hiring more workers and paying higher wages, in a stagnant economy, will force small businesses to raise prices on existing customers, and raising prices, without regard to demand, will have the effect of reducing demand, as customers seek lower cost alternatives. The resulting drop in demand, in the face of higher costs, will lead to further price hikes, in order to meet current obligations. In effect, pursuing the third item on Mr. Obama’s ‘To-Do List’ would land most small businesses – out-of-business – in double-time.
I am frankly sick and tired of all the special interest gimmicks conjured from the illogical mind of an amateur. What Mr. Obama ought to do at this point is simply surrender the keys, and let someone who knows what they’re talking about manage the economy. That’s what I call a logical conclusion.
“Companies are not charitable enterprises: They hire workers to make profits. In the United States, this logic still works. In Europe, it hardly does.” ~ Paul Samuelson
Related:
Picture via: Christ, My Redeemer
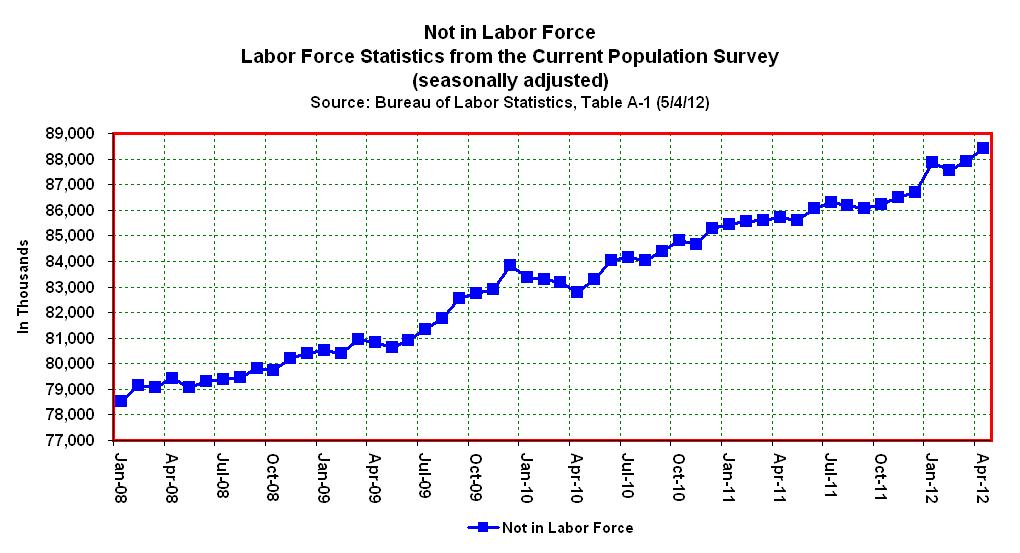 |
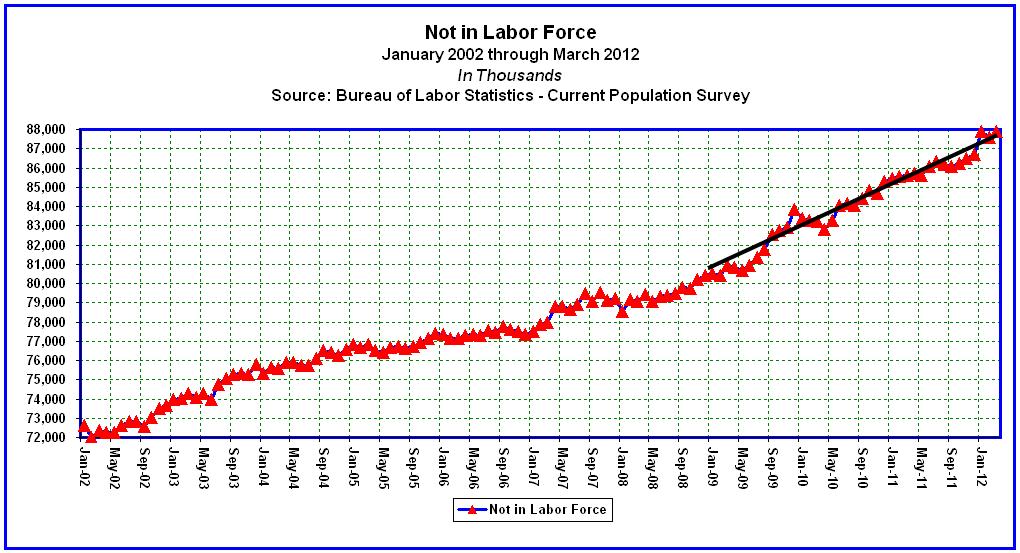
| Another 522,000 left the labor force in April 2012. |
April’s Bogus Unemployment Rate
* By: Larry Walker, Jr. *
Now that economists, media pundits, and the Obama administration have weighed in with half-hearted and inaccurate theories respecting April’s decline in the U.S. unemployment rate, it’s time to set the record straight. We learned yesterday, that the official rate declined from 8.2% in March to 8.1% in April, but what’s really beneath the decline? To know, one must have an understanding of how the unemployment rate is calculated, and how to access the appropriate reports. From there it’s just a matter of simple mathematics. After poring through the numbers, I have concluded that the official unemployment rate actually rose to 8.3% in April, while the real unemployment rate ticked up to 11.1%.
According to the U.S. Bureau of Labor Statistics (BLS), as of May 4, 2012, “Nonfarm payroll employment rose by 115,000 in April, and the unemployment rate was little changed at 8.1 percent.” What’s wrong with this pronouncement? The quandary is that nonfarm payroll employment comes from Establishment Data, reported in Table B-1, and has nothing to do with the official unemployment rate. The official unemployment rate is completely derived from Household Data, which is found in Table A-1.
Nonfarm payroll employment and the official unemployment rate are inapposite (one has nothing to do with the other). In fact, if you take a gander at Table A-1, from which the unemployment rate is officially derived, you will notice that the number of employed persons actually declined by 169,000 from March to April of 2012. Does it make sense that establishments reported the creation of 115,000 jobs, while households reported losing 169,000 jobs? Which data set are we to trust? Well, since most of the hoopla surrounds the decline in the unemployment rate, we shall focus on Household Data.
As I outlined in Manipulation 101: The Real Unemployment Rate, the Labor Force is comprised of those who are either Employed or Unemployed, and the Unemployment Rate is calculated by dividing the number of unemployed persons by the size of the labor force, as follows:
[ (A) Total Unemployed / (B) Labor Force = (C) Unemployment Rate ]
Thus, the official unemployment rate of 8.2% in March, as reported by the Bureau of Labor Statistics on April 6, 2012, was calculated as follows:
[ 12,673,000 / 154,707,000 = 8.2% ]
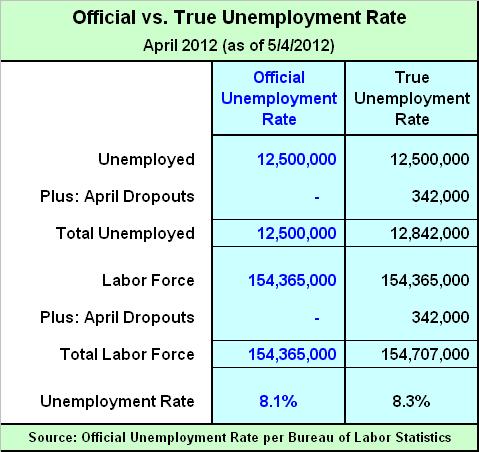
As shown in the table below, at the end of March 2012, 12,673,000 persons were officially unemployed, out of a labor force totaling 154,707,000, equaling an unemployment rate of 8.2%. Got it?

To take it a step further, if 12,673,000 persons were unemployed, out of a labor force of 154,707,000, then it should follow that the remaining 142,034,000 were employed. I found this to be consistent with BLS data and labeled the number of employed as item (D) in the table above. Next, in order to determine whether or not the decline in the unemployment rate is completely bogus, we must take into account some additional statistics from Table A-1, so I included the number of persons “Not in the Labor Force” (E), and the “Civilian Noninstitutional Population” (F). Now we will compare the March statistics to April’s calculation.

The April Employment Situation Summary concluded that a total of 12,500,000 persons were unemployed, out of a labor force totaling 154,365,000, equaling a decline in the official unemployment rate to 8.1%, from 8.2% in March. So what changed?
Comparing the monthly changes in the table below, you will note that from March to April, the number of unemployed persons (A) declined by 173,000. This would be a good thing, if they were all able to find jobs, right? So how many found jobs? Well, none. As you can see, according to Table A-1, the number of employed persons (D) also fell by 169,000. Since the number of employed and unemployed persons both declined, where did they go? As you can see the entire labor force declined by 342,000. Is it a coincidence that 173,000 plus 169,000 equals 342,000? No, it’s not.

The number of unemployed persons declined by 173,000, not because they were able to find work, the BLS merely removed them from the labor force. The BLS also removed an additional 169,000 persons from the labor force, who were considered employed just a month prior. Thus, 169,000 persons were ushered directly from a status of employed in March, to completely out of the labor force by the end of April. Does this raise any eyebrows? Also noteworthy are changes in the number of persons “Not in the Labor Force” which increased by 522,000, and the “Civilian Noninstitutional Population” which increased by 180,000. How de we reconcile this?
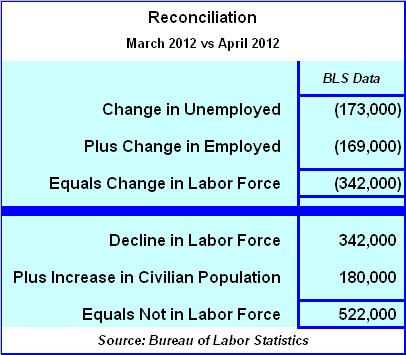
Reconciliation
The table below summarizes the truth behind the decline in the official unemployment rate.
Here’s what happened.
The number of unemployed persons declined by 173,000 in April.
The number of employed persons declined by 169,000 in April.
The labor force declined by 342,000 in April, which is the sum of #1 plus #2.
The 342,000 persons in #3, who officially dropped out of the labor force in April, were added to those considered “Not in the Labor Force”.
The Civilian Noninstitutional Population (working age population) increased by 180,000 in April, but none entered the labor force.
The number of persons counted as ”Not in Labor Force” increased by 522,000 in April, which is the sum of the 342,000 persons who were previously counted as unemployed (173,000) and employed (169,000), plus the 180,000 new working age persons who were swept under the rug.
Sequitur
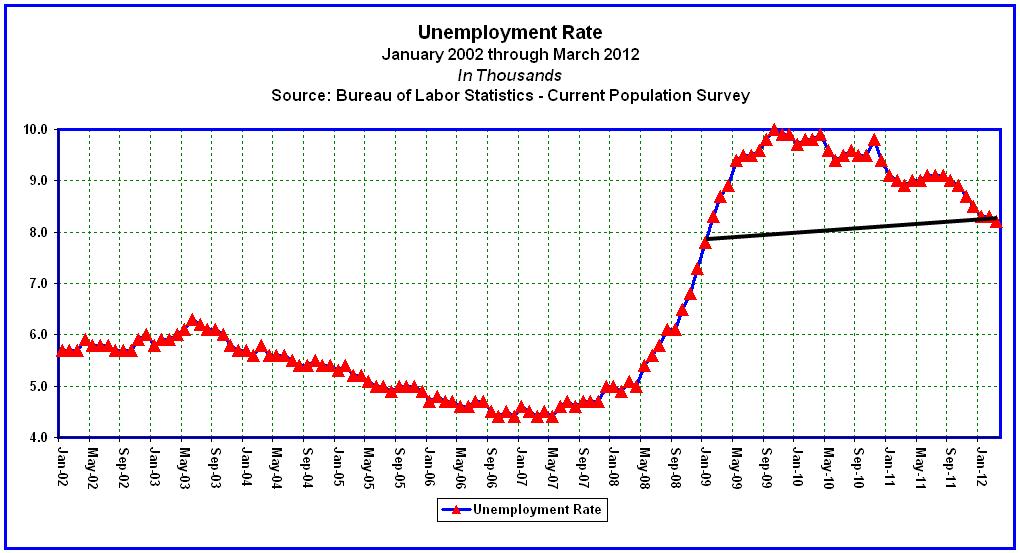
To sum it up, in April, 342,000 persons dropped out of the labor force, while another 180,000 new entrants fell by the wayside. In effect, a total of 522,000 persons were removed from the labor force. So what would the official unemployment rate have been had the 342,000 April dropouts been instead left in the labor force and counted as unemployed? The answer is 8.3%, as shown below. Thus, the true unemployment rate ticked up by 1 basis point, from 8.2% in March to 8.3% in April, rather than down by 1 basis point as the BLS reported.
The labor force has historically grown at an annual rate of 1.0% (mirroring population growth), but looking back to December of 2008, it is safe to state that the labor force stopped growing altogether since Obama’s inauguration (see chart below). [Note: The labor force participation rate has likewise declined from 65.8% to 63.6% over the same period, or by 220 basis points.]
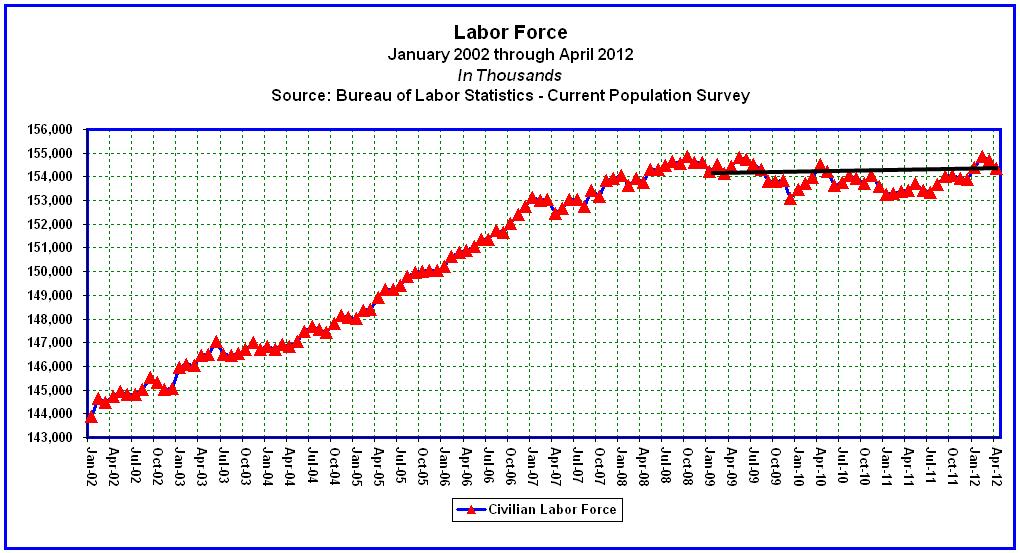
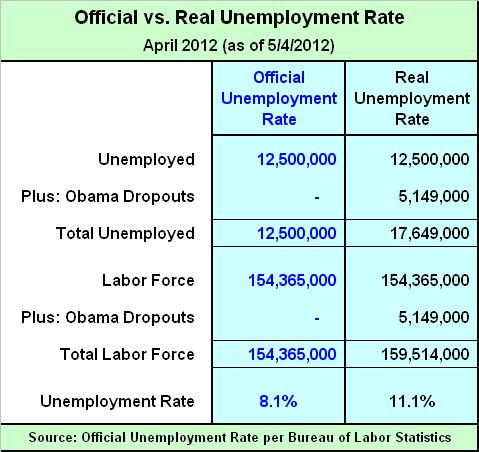
Final question: What would the unemployment rate be if the 1.0% per annum shortfall in the labor force, since January of 2009, was restored? Well, since 40 month’s have passed, the labor force should have grown by 3.33% ((1.0% / 12) * 40). And since the labor force stood at 154,626,000 in December of 2008, it should have grown to 159,775,000 by April of 2012, a difference of 5,149,000. Thus, the real unemployment rate is 11.1%, not 8.1%, as shown below.
Are we really moving the right direction? That depends on ones definition of the word “right”. Is manipulating the truth right?
“Anyone who doesn’t take truth seriously in small matters cannot be trusted in large ones either.” ~ Albert Einstein
Data:
* By: Larry Walker, Jr. *
“Ultimately the buck stops with me… I’m going to be accountable.” ~ Barack Obama *
What a load of bull! Harry Reid’s U.S. Senate hasn’t passed a budget resolution since April 29, 2009. Barack Obama hasn’t presented a budget, at least not one acceptable to either Democrats or Republicans, since the day he set foot in office. Yet he thinks he should keep his job. But that’s not how it works in America. Obama was given a fair shot; he had his fair share of opportunities, but he chose to pass the buck, running his mouth instead of governing, and now it’s time to give someone else a shot.

U.S. Gross Domestic Product has grown by a mere 7.59% from 2007 to 2011, or at an average annual growth rate of a pathetic 1.90%. But Federal Agency spending has increased by 32.04% over the same period, or at an average annual growth rate of 8.01%. Does the fact that Agency spending outpaced the economy by 322% sound any alarms? Well if we had a chief executive who was paying attention it would. This is an outrageous, hair-raising, mind-boggling, egregious, statistical fact, yet all U.S. taxpayers have heard for the last three plus years are threat after threat of higher taxes.
‘The Bush tax cuts are out, no they’re in. The payroll tax cut is gone, no it’s back. The AMT Patch is dead, no it’s still breathing.’
And now we have to contend with yet another threat, Taxmageddon. Taxmageddon is a $494 billion tax increase that strikes at the beginning of 2013. This time it’s the largest tax increase in U.S. history, scheduled to hit us smack in the face on January 1, 2013. Under current law, tax policies in seven different categories will expire, including the Bush Tax Cuts, payroll tax cut, the AMT Patch, plus five of the 18 new tax hikes from Obamacare will begin, see Taxmageddon: Massive Tax Increase Coming in 2013.
Unusual uncertainty remains unusually uncertain.
With Taxmageddon looming, the GSA scandal is well-timed. It has undeniably exposed the truth. And the truth is that the federal government has been living large through its discretionary spending, throwing our future to the wind, while we’ve been left sitting on pins and needles. Since the economy is practically at zero growth, where do these morons think the money to pay higher taxes will come from? I find it amazing, simply amazing, that no one has been in charge of the national purse for the last three-plus years. Absolutely no one has kept tabs on how our tax dollars were spent. We deserve better.

With an estimated $6.3 Trillion borrowed and squandered on Obama’s watch, and red flags abounding, it makes me sick to my stomach that politicians are suddenly concerned. You would have to be blind or not paying any attention to federal spending whatsoever to not notice the humongous 6,896.30% increase in the GSA’s expenditures from 2007 to 2011. Why blame the GSA? Blame yourselves, or blame Obama. The buck stops with Obama, right? So fire him. Put Obama on trial.
Maybe if someone wasn’t on the golf course, on vacation, or campaigning every other week (at our expense), and instead actually took time to study the budget “line by line”, and to work with Congress on cutting and capping spending, the GSA incident wouldn’t have occurred. I call it not doing the job you were elected to do. But hindsight is 20/20; foresight is not reelecting someone who has proven he can’t handle the job.
Does the following condensed OMB table, Outlays by Agency, which compares government spending growth from 2007 to 2011, raise any flags? If you ask me, the entire record is a red flag. The General Services Administration is an obvious bell ringer, its expenditures having grown from $27 million in 2007, to over $1.8 billion in 2011, or by 6,896.30%. But it’s not the only agency that should concern us, frankly they all should.
As you scan through the following highlights, keep in mind that the entire U.S. economy grew by a mere 7.59% over the four-year period, or at average annual growth of 1.90%.
The Department of Agriculture’s four-year spending growth was 65.11%, with average annual growth of 16.28%. You would think they were actually growing crops or raising livestock, but we know that’s not the case, so why have annual expenditures increased by $54.9 billion? Cut it.
The Department of Commerce’s four-year spending growth was 53.36%, with average annual growth of 13.34%. You would think they were actually manufacturing products or providing services, but we know that’s not the case, so why have annual expenditures increased by $3.5 billion? Cut it.

The Department of Energy’s four-year spending growth was 55.95%, with average annual growth of 13.99%. You would think they were actually producing electricity, mining coal or drilling for oil, but we know that’s not the case, so why have annual expenditures increased by $11.3 billion? Cut it.
The Department of Labor’s four-year spending growth was 177.58%, with average annual growth of 44.40%. You would think they were actually performing job placement services, but we know that’s not the case, so why have annual expenditures increased by $84.4 billion? Cut it.
The Department of State’s four-year spending growth was 77.29%, with average annual growth of 19.32%. You would think they were annexing nations and granting Statehood, in order to increase GDP, but we know that’s not the case, so why have annual expenditures increased by $10.6 billion? Cut it.
The Department of Veterans Affairs’ four-year spending growth was 74.36%, with average annual growth of 18.59%. Is this sustainable on average annual GDP growth of just 1.90%? Not hardly. So why have annual expenditures increased by $54.1 billion? Cut it.
The Corps of Engineers–Civil Works’ four-year spending growth was 158.75%, with average annual growth of 39.69%. You would think they were actually building roads and bridges, but we know that’s not the case, so why have annual expenditures increased by $6.2 billion? Cut it.
The Small Business Administration’s four year spending growth was 424.51%, with average annual growth of 106.13%. You would think they were actually making loans directly to small businesses, but we know that’s not the case, so why have annual expenditures increased by $4.9 billion? Cut it.
The Social Security Administration’s (On-Budget) four-year spending growth was 182.82%, with average annual growth of 45.70%. On-budget spending isn’t mandated, it’s not the entitlements portion in which Social Security Taxes offset payments to retirees and those with disabilities. No, this is interest and principal repayments of previously looted funds, and coverage of shortfalls due to the payroll tax cut and other gimmicks. You would think they were actually increasing benefit checks or lowering Medicare premiums, but we know that’s not the case, so why have annual expenditures increased by $100.4 billion? Cut it.
Total Federal Outlays experienced four-year spending growth of 32.04%, with average annual growth of 8.01%. With that kind of spending, you would think our economy would have grown by more than 7.59% over the four-year period, and achieved far more than average annual growth of 1.90%, but we know that didn’t happen, so why have annual expenditures increased by $874.4 billion? Has the economic stimulus program of 2009 become permanent? Cut it.
And last but far from least, the General Services Administration’s four-year spending growth was a whopping 6,896.30%, with average annual growth of 1,724.07%. You would think they were throwing some really wicked parties, or something. Oh, it turns out that was the case! No wonder annual expenditures increased by $1.9 billion. Just cut it.
Our government is spending at a rate which is 322% greater than the underlying economy. We call this “unsustainable”. What do you call it? The egregious growth of the GSA’s expenditures should have been caught long before it became a public scandal. Has anyone in the District of Columbia been paying attention for the past three years? You would think Obama would have caught this with his vast experience running companies, governing States, and all. Oh that’s right, he doesn’t have any experience.
I just gave you $340.2 billion of simple budget cuts, while Obama refuses to acknowledge the problem. If you still don’t get it, here’s the wrap.
The economy isn’t growing. The government is spending at a rate which is 322% greater than its underlying economy. Every additional dollar of tax revenue sucked out of our stagnant economy will cause the economy to decline further, while government continues to live the high life. Since there is no additional revenue to garner, government spending must be cut. The economy was on fire in 2007 on dramatically less government spending. Therefore, returning to the budget of 2007 damages nothing, other than Obama’s plan to bankrupt the nation. If Obama isn’t trying to bankrupt the USA, then what is he doing?
Fire Obama! Cut government spending. Cut the B.S. Cut it big. And cut it now!
References:
Table 4.1—Outlays by Agency: 1962–2017
* By: Larry Walker, Jr. *
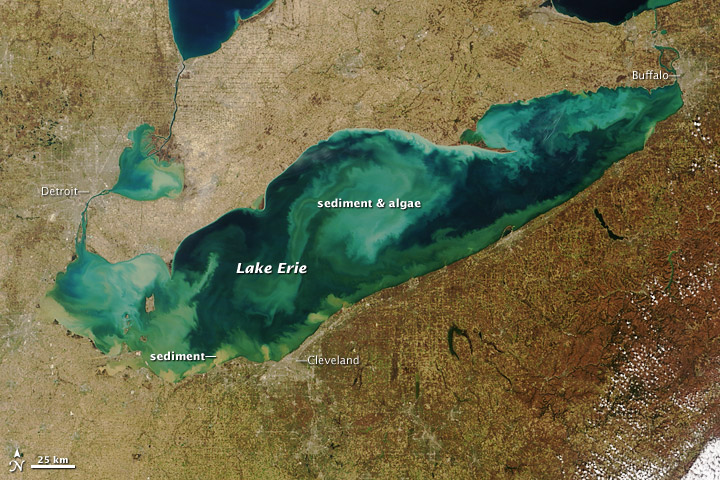
“Lake Erie is facing its worst toxic algae bloom since the 60’s and somehow it is going unnoticed…” ~ JoeOH111 *
According to Mr. Obama, you don’t have a fair shot right now, and it’s all because millionaires aren’t paying enough income tax. If millionaires would just give the federal government its fair share, then you, I, and everyone else would have a fair shot…, and a glass of algae.
The best definition I can surmise is “a lawful chance at odds.” But don’t we all have this already? For example, the odds of winning the recent $640 million Mega Millions jackpot were 1 in 176 million. In order to guarantee a win, one would have had to spend $176 million buying up every combination. So if some nefarious millionaire had purchased all 176 million combinations, would he or she have had an unfair advantage?
Well, perhaps, but what millionaire would be dumb enough to blow $176 million on lottery tickets? What are the odds of that ever happening? The odds of one person buying all 176 million winning combinations, across multiple States, would probably be 1 in ∞ (infinity). In other words, a guaranteed win is impossible, at least when it comes to the Mega Millions lottery. But a fair shot is open to anyone who plays the game. “You gotta be in it to win it.”
According to CBS News, one person purchased $2,600 worth of lotto tickets, and another threw down $55, while the more frugal played their usual dollar or two. Did the one who blew $2,600 have an unfair advantage over $55 and $1 players? I will concede that the $2,600 player had an advantage, but I would hesitate to call it unfair. The poor sap simply had more to lose, yet not a dime more to gain. Not one dime. Now let’s flip over to the Mega Trillions Federal Debt Lotto.
Mega Trillions Federal Debt Lotto
If a taxpayer earns $176 million in taxable income and pays $29.9 million in federal taxes (a rate of 17%), while another earns $50,000 and pays $8,500 in taxes (also a rate of 17%), and yet another earns $25,000 and pays $0, does either have an unfair advantage? Since both the millionaire and the $50,000 wage earner pay the exact same tax rate (17%), the non-taxpayer has an advantage. But is it an unfair advantage? I would say so, especially since in the recent past we all pitched in at every level of income. Yet the one paying $29.9 million in taxes has a lot more to lose than both the $8,500 payer, and the non-taxpayer.
But who wins in this crapshoot? With the federal government borrowing and spending hundreds of billions of dollars, in advance, and squandering it to produce test-tube sewage-fed algae biomass for fuel, while Lake Erie and other U.S. lakes are full of “free” blue-green scum, the answer is no one. You’d have to be an idiot to waste hundreds of billions of dollars manufacturing something that’s sitting right in front of your face, wouldn’t you? Hindsight is 20/20, foresight is priceless.
When it comes to the national debt, those who don’t pay federal income taxes make out like bandits, they have nothing to lose. And those who already pay more than their “fair share” (i.e. taxed enough already) have nothing to gain. It’s not the 2% of top earners that worry me, they generally pay their bills on time, but rather the federal government which has already borrowed more than 100% of our entire economy, an amount estimated to reach $16.3 Trillion by September 30th of this year.
Only a depraved leader would have his nose in other peoples finances while ignoring his own debt laden, broken, overspent, and soon to be bankrupt enterprise. The federal government is not the solution to our problems; it’s the $16.3 Trillion in the hole, deadbeat, money squandering, largest debtor-nation in the Universe, leach, which is forever in the way and constantly on our collective back.
The moral of this story: Never confuse motion with action.
In other words, quit giving speeches and fix the problem. No one is going to vote for a tax increase in the middle of an election cycle, no matter how many speeches are enounced and dribbled. Especially not the one proffered, which in the end will barely cover one day’s worth of current deficit spending. No not a one! We don’t have a revenue problem; no, no, no, what we have is a deadbeat, money squandering, and largest debtor-nation in the Universe, ass-backwards, leach of a federal government problem. Get a clue!
Rather than paying more taxes, or spending multi-millions on lottery tickets to become multi-millionaires all over again, our well-to-do brethren would do better by investing in their own casinos, creating jobs and fair shot opportunities for others. And that leads us back to square one all over again: cut taxes, cut spending, and get out of our way and off our backs.
Photo Credit: Lake Erie, Stirred Up | Via: NASA Earth Observatory (March 21, 2012)

* By: Larry Walker, Jr. *
“Our economy’s now created more than 4 million private sector jobs over the past 2 years. And more than 600,000 in the past 3 months alone,” Mr. Obama boasted to a forum at the White House on women and the economy, on Friday (CBS News).
And in related news, on the previous evening, Egan-Jones Ratings Co. cut the U.S.A.’s credit rating one step to AA, the second downgrade in nine months and two levels below its highest grade, with a negative outlook citing the nation’s increasing debt burden (Bloomberg).
Most of us are well aware of the nation’s impending debt implosion, but the real employment situation has been distorted beyond reason. I understand how badly Mr. Obama is fighting against returning to the obscure existence he led prior to 2008, but if he was at all capable, he would at least tell us the truth about where we stand. I’m frankly weary from all the sugarcoating and distortion of facts. So what’s the real employment situation?
In order to know the truth, we must examine not so much monthly trends in employment, but rather changes which have occurred from the end of January 2009 through March 2012. When we examine the entire record, we find that our economy hasn’t created any jobs at all over the past 3 ¼ years, on a seasonally adjusted basis. Instead the unemployment rate has risen from 7.8% to 8.2%, the number of nonfarm jobs has declined by 740,000, the number of unemployed persons has increased by 624,000, and total employment has declined by 153,000. Meanwhile, the working age population has grown by 7,865,000, while the civilian labor force has only managed an increase of 471,000, causing the number of persons no longer counted in the labor force to balloon by 7,395,000.
The truth is that our economy hasn’t created any new jobs since Obama’s policies took effect. The total number of jobs peaked at an all time high of 146,595,000 in November of 2007, and through March of 2012 the number stands at 142,034,000, more than 4.5 million off the mark. If we had more jobs than existed in November of 2007, then Obama would have something to brag about, although not much. But since the truth is somewhat inconvenient, we are supposed to ignore the fact that we are more than 4 million jobs in the hole, and submit to repeated media brainwashing and succumb to the belief that we have somehow moved ahead by over 4 million. Phooey! Here are the facts.
Unemployment Rate
The unemployment rate rose from 7.8 percent in January of 2009 to 8.2 percent as of March 2012, according to the U.S. Bureau of Labor Statistics (Employment Situation 4/6/2012). (See table A-1 / Seasonally Adjusted)
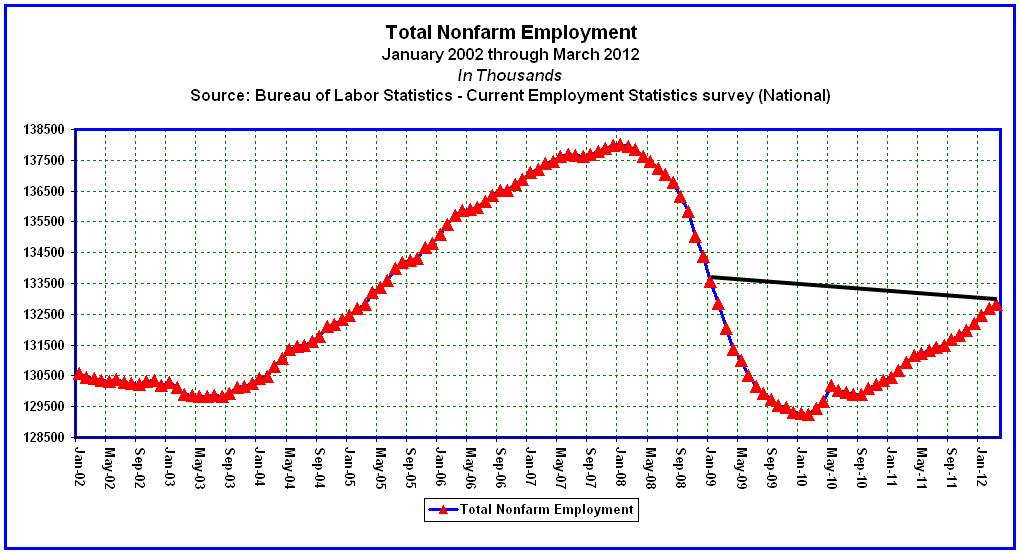
Nonfarm Employment
Nonfarm payroll employment declined by 740,000 through March of 2012, from 133,561,000 in January of 2009 to 132,821,000. (See table B-1 / Seasonally Adjusted)
Unemployed Persons
The number of unemployed persons increased by 624,000 through March of 2012, from 12,049,000 in January of 2009 to 12,673,000. (See table A-1 / Seasonally Adjusted)

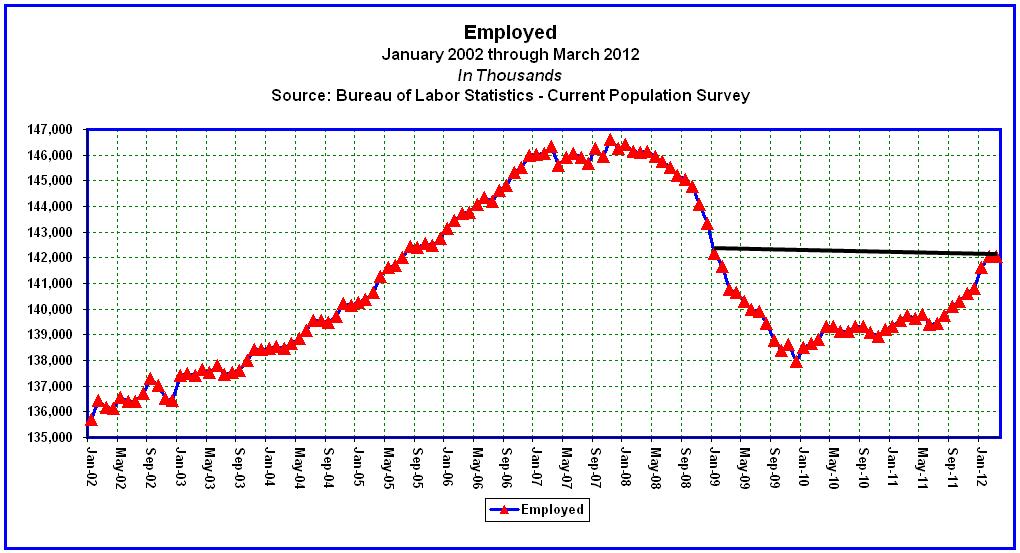
Total Employment
The number of persons employed declined by 153,000 through March of 2012, from 142,187,000 in January of 2009 to 142,034,000. (See table A-1 / Seasonally Adjusted)
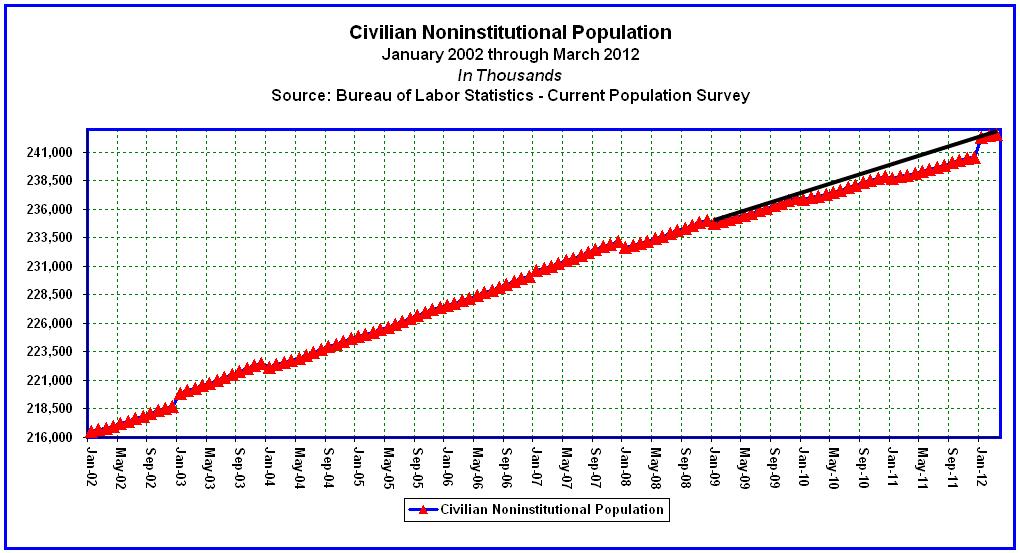
Civilian Noninstitutional Population
The Civilian Noninstitutional Population (working age population) increased by 7,865,000 through March of 2012, from 234,739,000 in January of 2009 to 242,604,000. (See table A-1 / Seasonally Adjusted)
Civilian Labor Force
The labor force increased by 471,000 through March of 2012, from 154,236,000 in January of 2009 to 154,707,000. The labor force hasn’t grown at all since October of 2008. (See table A-1 / Seasonally Adjusted)

Not in Labor Force
The number of persons not in the labor force increased by 7,395,000 through March of 2012, from 80,502,000 in January of 2009 to 87,897,000. (See table A-1 / Seasonally Adjusted)
To make the claim of having created more jobs than Mr. Bush, which we all know was Mr. Obama’s insinuation; he must first match Mr. Bush’s all-time-high of 146,595,000. If the number of persons who involuntarily dropped out of the labor force (7.3 million), since Mr. Obama’s policies took effect, had instead been jobs created, Mr. Obama might go down in history as the all-time greatest. However, since we presently have 4.5 million fewer jobs than existed at Mr. Bush’s peak, and since, under the direction of Mr. Obama, 7.3 million new working age persons have been pushed straight into joblessness and generational dependency, Mr. Obama’s policies should perhaps be branded as the most ineffective in U.S. history.
Since employment is a lagging economic indicator, and because economists are calling for recession in 2012, and since the statistics above represent the sum total of Obama’s economic accomplishments, we’re in for serious troubles ahead. To reiterate, Mr. Obama’s policies of Inordinate Stimulus, Undue Debt and Global Warming Foolishness caused the Looming Recession.
Photo Credit: A swarm of Western Toad tadpoles eating algae. Photo: Kristiina Ovaska
Reference: Bureau of Labor Statistics, Employment Situation Summary
Data: Worksheets
