Manipulation 401 : U-3 vs Real Unemployment


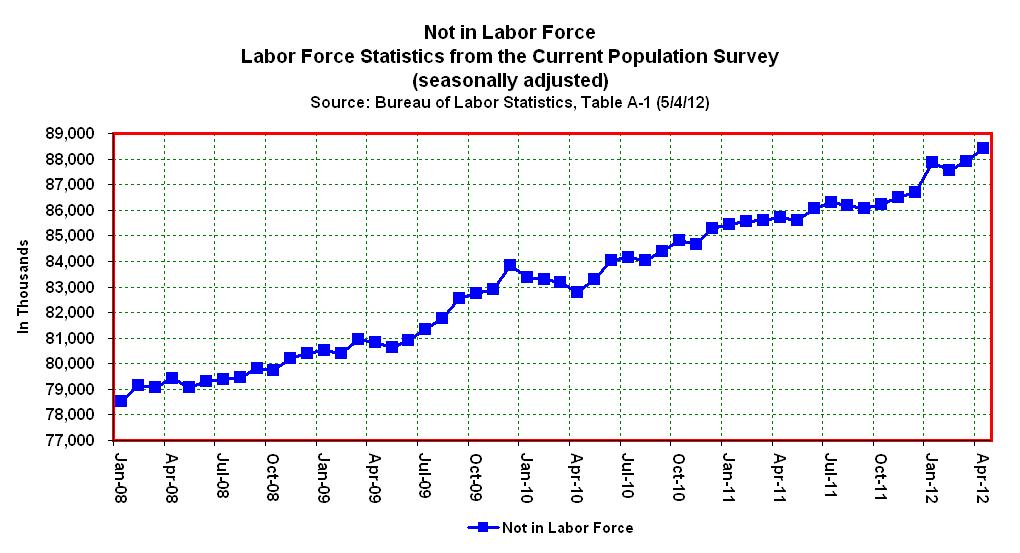
Another 522,000 left the labor force in April 2012.

April’s Bogus Unemployment Rate

* By: Larry Walker, Jr. *

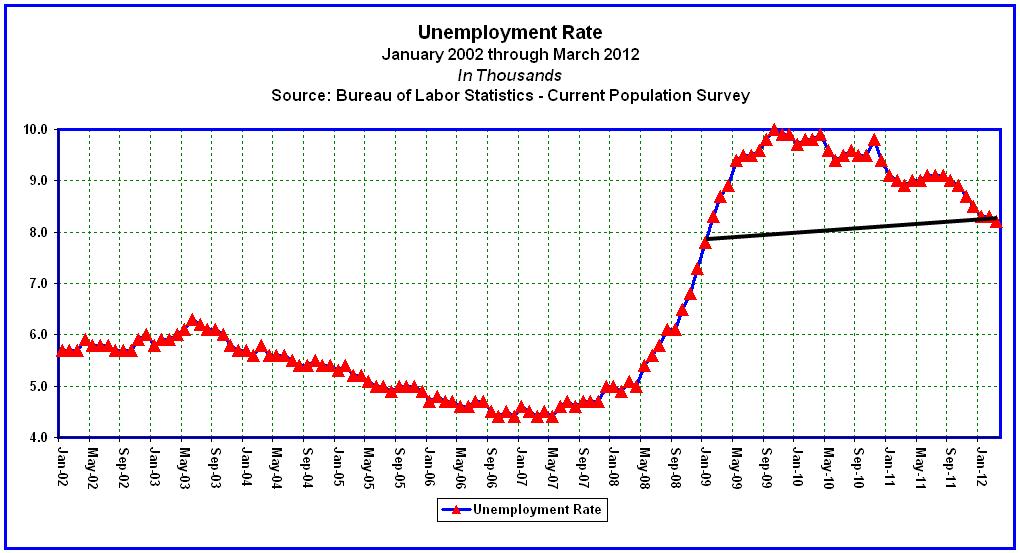
Now that economists, media pundits, and the Obama administration have weighed in with half-hearted and inaccurate theories respecting April’s decline in the U.S. unemployment rate, it’s time to set the record straight. We learned yesterday, that the official rate declined from 8.2% in March to 8.1% in April, but what’s really beneath the decline? To know, one must have an understanding of how the unemployment rate is calculated, and how to access the appropriate reports. From there it’s just a matter of simple mathematics. After poring through the numbers, I have concluded that the official unemployment rate actually rose to 8.3% in April, while the real unemployment rate ticked up to 11.1%.

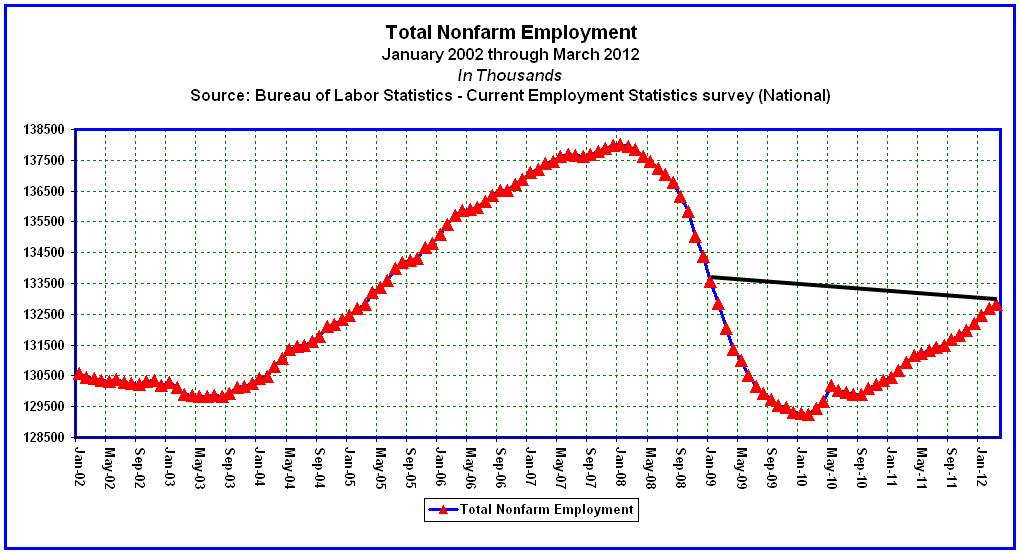
According to the U.S. Bureau of Labor Statistics (BLS), as of May 4, 2012, “Nonfarm payroll employment rose by 115,000 in April, and the unemployment rate was little changed at 8.1 percent.” What’s wrong with this pronouncement? The quandary is that nonfarm payroll employment comes from Establishment Data, reported in Table B-1, and has nothing to do with the official unemployment rate. The official unemployment rate is completely derived from Household Data, which is found in Table A-1.

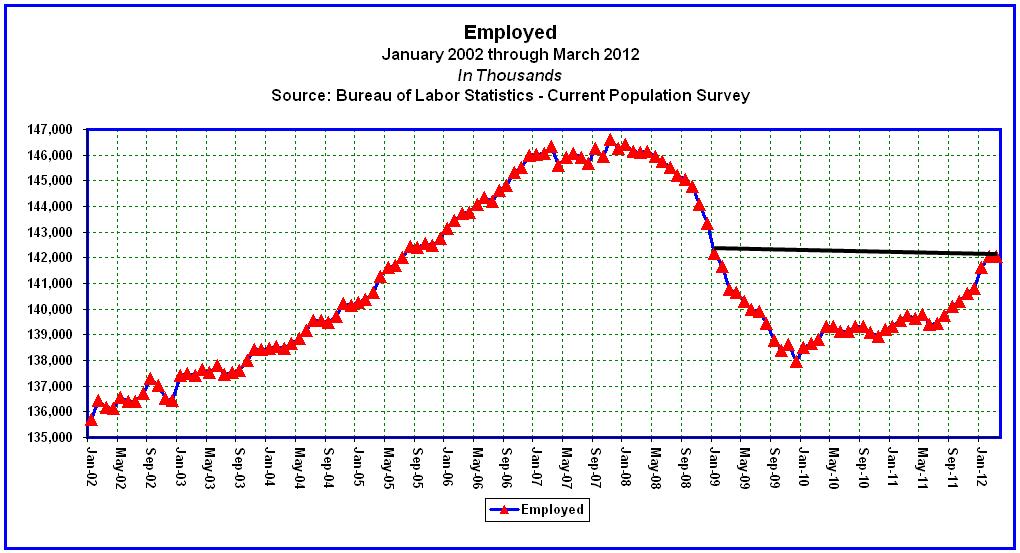
Nonfarm payroll employment and the official unemployment rate are inapposite (one has nothing to do with the other). In fact, if you take a gander at Table A-1, from which the unemployment rate is officially derived, you will notice that the number of employed persons actually declined by 169,000 from March to April of 2012. Does it make sense that establishments reported the creation of 115,000 jobs, while households reported losing 169,000 jobs? Which data set are we to trust? Well, since most of the hoopla surrounds the decline in the unemployment rate, we shall focus on Household Data.

As I outlined in Manipulation 101: The Real Unemployment Rate, the Labor Force is comprised of those who are either Employed or Unemployed, and the Unemployment Rate is calculated by dividing the number of unemployed persons by the size of the labor force, as follows:

[ (A) Total Unemployed / (B) Labor Force = (C) Unemployment Rate ]

Thus, the official unemployment rate of 8.2% in March, as reported by the Bureau of Labor Statistics on April 6, 2012, was calculated as follows:

[ 12,673,000 / 154,707,000 = 8.2% ]

As shown in the table below, at the end of March 2012, 12,673,000 persons were officially unemployed, out of a labor force totaling 154,707,000, equaling an unemployment rate of 8.2%. Got it?

To take it a step further, if 12,673,000 persons were unemployed, out of a labor force of 154,707,000, then it should follow that the remaining 142,034,000 were employed. I found this to be consistent with BLS data and labeled the number of employed as item (D) in the table above. Next, in order to determine whether or not the decline in the unemployment rate is completely bogus, we must take into account some additional statistics from Table A-1, so I included the number of persons “Not in the Labor Force” (E), and the “Civilian Noninstitutional Population” (F). Now we will compare the March statistics to April’s calculation.

The April Employment Situation Summary concluded that a total of 12,500,000 persons were unemployed, out of a labor force totaling 154,365,000, equaling a decline in the official unemployment rate to 8.1%, from 8.2% in March. So what changed?

Comparing the monthly changes in the table below, you will note that from March to April, the number of unemployed persons (A) declined by 173,000. This would be a good thing, if they were all able to find jobs, right? So how many found jobs? Well, none. As you can see, according to Table A-1, the number of employed persons (D) also fell by 169,000. Since the number of employed and unemployed persons both declined, where did they go? As you can see the entire labor force declined by 342,000. Is it a coincidence that 173,000 plus 169,000 equals 342,000? No, it’s not.

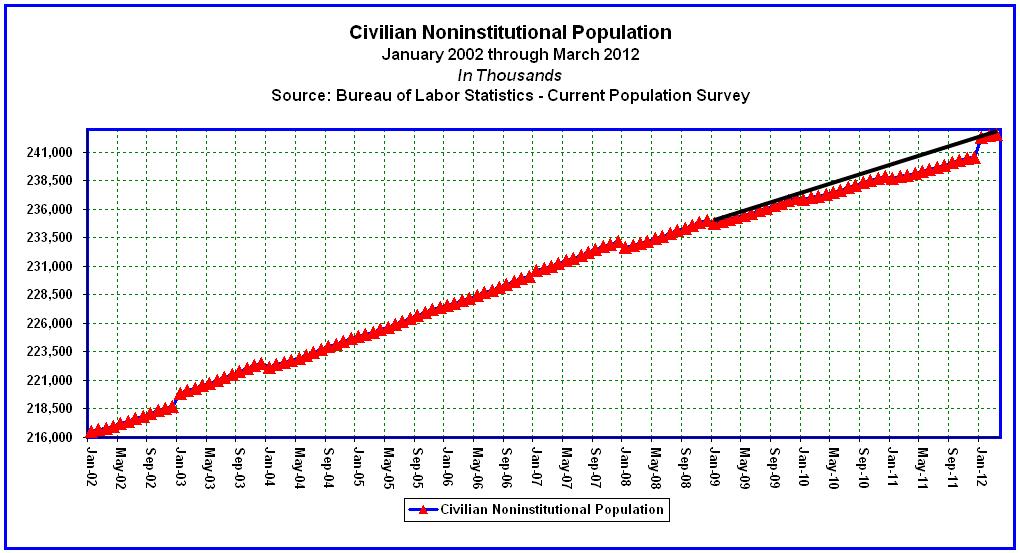
The number of unemployed persons declined by 173,000, not because they were able to find work, the BLS merely removed them from the labor force. The BLS also removed an additional 169,000 persons from the labor force, who were considered employed just a month prior. Thus, 169,000 persons were ushered directly from a status of employed in March, to completely out of the labor force by the end of April. Does this raise any eyebrows? Also noteworthy are changes in the number of persons “Not in the Labor Forcewhich increased by 522,000, and the “Civilian Noninstitutional Population” which increased by 180,000. How de we reconcile this?

Reconciliation

The table below summarizes the truth behind the decline in the official unemployment rate.

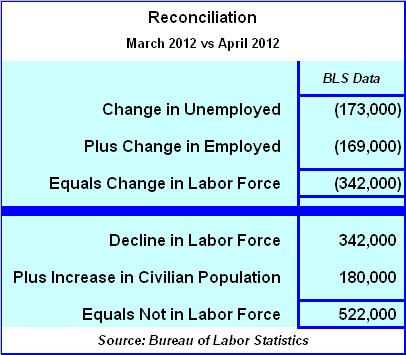
Here’s what happened.

  1. The number of unemployed persons declined by 173,000 in April.

  2. The number of employed persons declined by 169,000 in April.

  3. The labor force declined by 342,000 in April, which is the sum of #1 plus #2.

  4. The 342,000 persons in #3, who officially dropped out of the labor force in April, were added to those considered “Not in the Labor Force”.

  5. The Civilian Noninstitutional Population (working age population) increased by 180,000 in April, but none entered the labor force.

  6. The number of persons counted as ”Not in Labor Force” increased by 522,000 in April, which is the sum of the 342,000 persons who were previously counted as unemployed (173,000) and employed (169,000), plus the 180,000 new working age persons who were swept under the rug.
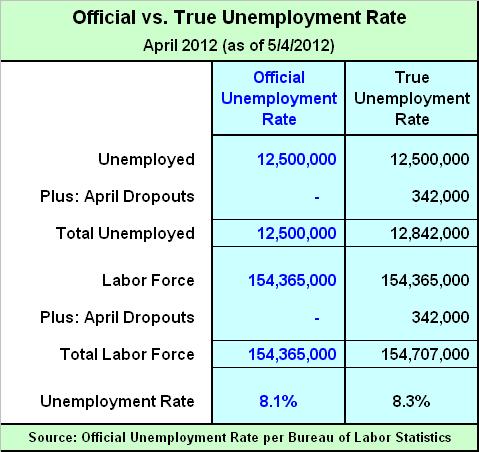
Sequitur

To sum it up, in April, 342,000 persons dropped out of the labor force, while another 180,000 new entrants fell by the wayside. In effect, a total of 522,000 persons were removed from the labor force. So what would the official unemployment rate have been had the 342,000 April dropouts been instead left in the labor force and counted as unemployed? The answer is 8.3%, as shown below. Thus, the true unemployment rate ticked up by 1 basis point, from 8.2% in March to 8.3% in April, rather than down by 1 basis point as the BLS reported.

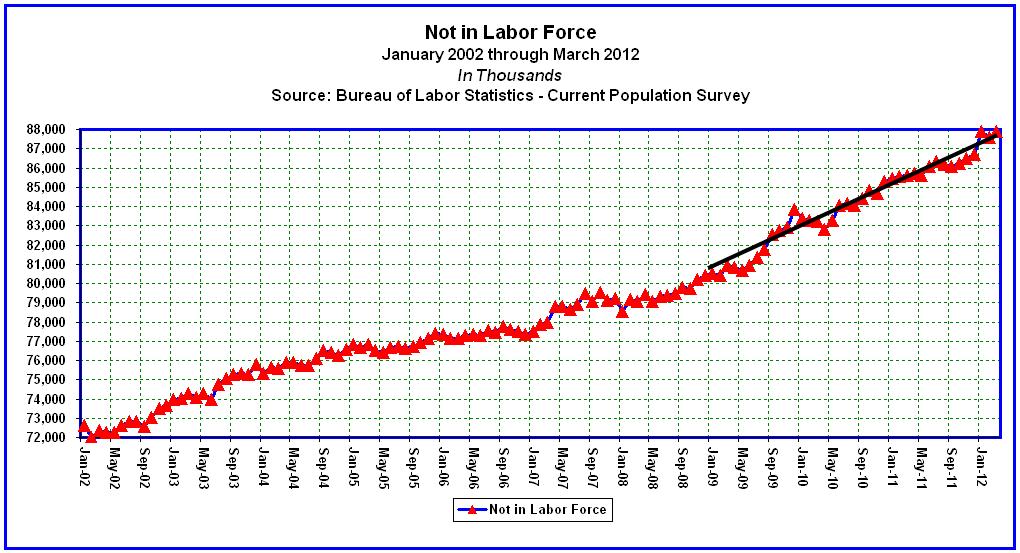
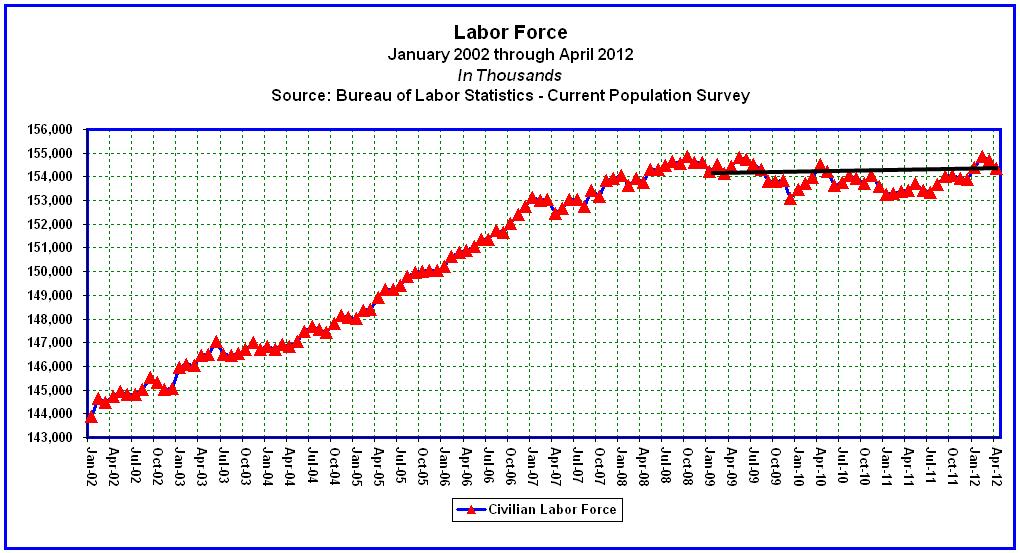
The labor force has historically grown at an annual rate of 1.0% (mirroring population growth), but looking back to December of 2008, it is safe to state that the labor force stopped growing altogether since Obama’s inauguration (see chart below). [Note: The labor force participation rate has likewise declined from 65.8% to 63.6% over the same period, or by 220 basis points.]

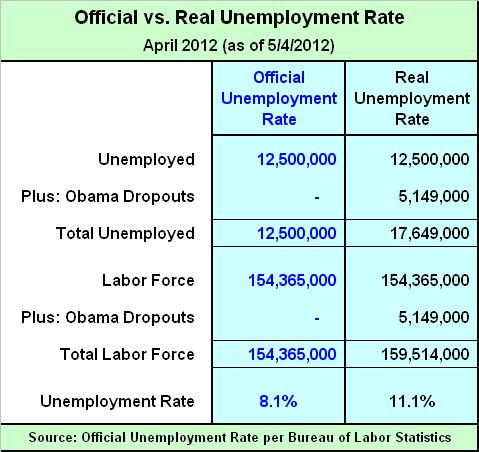
Final question: What would the unemployment rate be if the 1.0% per annum shortfall in the labor force, since January of 2009, was restored? Well, since 40 month’s have passed, the labor force should have grown by 3.33% ((1.0% / 12) * 40). And since the labor force stood at 154,626,000 in December of 2008, it should have grown to 159,775,000 by April of 2012, a difference of 5,149,000. Thus, the real unemployment rate is 11.1%, not 8.1%, as shown below.

Are we really moving the right direction? That depends on ones definition of the word “right”. Is manipulating the truth right?

“Anyone who doesn’t take truth seriously in small matters cannot be trusted in large ones either.” ~ Albert Einstein

Data:

Spreadsheets

Passing the Buck and Taking Names | Obama’s GSA

* By: Larry Walker, Jr. *

“Ultimately the buck stops with me… I’m going to be accountable.” ~ Barack Obama *

What a load of bull! Harry Reid’s U.S. Senate hasn’t passed a budget resolution since April 29, 2009. Barack Obama hasn’t presented a budget, at least not one acceptable to either Democrats or Republicans, since the day he set foot in office. Yet he thinks he should keep his job. But that’s not how it works in America. Obama was given a fair shot; he had his fair share of opportunities, but he chose to pass the buck, running his mouth instead of governing, and now it’s time to give someone else a shot.

U.S. Gross Domestic Product has grown by a mere 7.59% from 2007 to 2011, or at an average annual growth rate of a pathetic 1.90%. But Federal Agency spending has increased by 32.04% over the same period, or at an average annual growth rate of 8.01%. Does the fact that Agency spending outpaced the economy by 322% sound any alarms? Well if we had a chief executive who was paying attention it would. This is an outrageous, hair-raising, mind-boggling, egregious, statistical fact, yet all U.S. taxpayers have heard for the last three plus years are threat after threat of higher taxes.

The Bush tax cuts are out, no they’re in. The payroll tax cut is gone, no it’s back. The AMT Patch is dead, no it’s still breathing.’

And now we have to contend with yet another threat, Taxmageddon. Taxmageddon is a $494 billion tax increase that strikes at the beginning of 2013. This time it’s the largest tax increase in U.S. history, scheduled to hit us smack in the face on January 1, 2013. Under current law, tax policies in seven different categories will expire, including the Bush Tax Cuts, payroll tax cut, the AMT Patch, plus five of the 18 new tax hikes from Obamacare will begin, see Taxmageddon: Massive Tax Increase Coming in 2013.

Unusual uncertainty remains unusually uncertain.

With Taxmageddon looming, the GSA scandal is well-timed. It has undeniably exposed the truth. And the truth is that the federal government has been living large through its discretionary spending, throwing our future to the wind, while we’ve been left sitting on pins and needles. Since the economy is practically at zero growth, where do these morons think the money to pay higher taxes will come from? I find it amazing, simply amazing, that no one has been in charge of the national purse for the last three-plus years. Absolutely no one has kept tabs on how our tax dollars were spent. We deserve better.

With an estimated $6.3 Trillion borrowed and squandered on Obama’s watch, and red flags abounding, it makes me sick to my stomach that politicians are suddenly concerned. You would have to be blind or not paying any attention to federal spending whatsoever to not notice the humongous 6,896.30% increase in the GSA’s expenditures from 2007 to 2011. Why blame the GSA? Blame yourselves, or blame Obama. The buck stops with Obama, right? So fire him. Put Obama on trial.

Maybe if someone wasn’t on the golf course, on vacation, or campaigning every other week (at our expense), and instead actually took time to study the budget “line by line”, and to work with Congress on cutting and capping spending, the GSA incident wouldn’t have occurred. I call it not doing the job you were elected to do. But hindsight is 20/20; foresight is not reelecting someone who has proven he can’t handle the job.

Does the following condensed OMB table, Outlays by Agency, which compares government spending growth from 2007 to 2011, raise any flags? If you ask me, the entire record is a red flag. The General Services Administration is an obvious bell ringer, its expenditures having grown from $27 million in 2007, to over $1.8 billion in 2011, or by 6,896.30%. But it’s not the only agency that should concern us, frankly they all should.

As you scan through the following highlights, keep in mind that the entire U.S. economy grew by a mere 7.59% over the four-year period, or at average annual growth of 1.90%.

  • The Department of Agriculture’s four-year spending growth was 65.11%, with average annual growth of 16.28%. You would think they were actually growing crops or raising livestock, but we know that’s not the case, so why have annual expenditures increased by $54.9 billion? Cut it.

  • The Department of Commerce’s four-year spending growth was 53.36%, with average annual growth of 13.34%. You would think they were actually manufacturing products or providing services, but we know that’s not the case, so why have annual expenditures increased by $3.5 billion? Cut it.

  • The Department of Energy’s four-year spending growth was 55.95%, with average annual growth of 13.99%. You would think they were actually producing electricity, mining coal or drilling for oil, but we know that’s not the case, so why have annual expenditures increased by $11.3 billion? Cut it.

  • The Department of Labor’s four-year spending growth was 177.58%, with average annual growth of 44.40%. You would think they were actually performing job placement services, but we know that’s not the case, so why have annual expenditures increased by $84.4 billion? Cut it.

  • The Department of State’s four-year spending growth was 77.29%, with average annual growth of 19.32%. You would think they were annexing nations and granting Statehood, in order to increase GDP, but we know that’s not the case, so why have annual expenditures increased by $10.6 billion? Cut it.

  • The Department of Veterans Affairs’ four-year spending growth was 74.36%, with average annual growth of 18.59%. Is this sustainable on average annual GDP growth of just 1.90%? Not hardly. So why have annual expenditures increased by $54.1 billion? Cut it.

  • The Corps of Engineers–Civil Works’ four-year spending growth was 158.75%, with average annual growth of 39.69%. You would think they were actually building roads and bridges, but we know that’s not the case, so why have annual expenditures increased by $6.2 billion? Cut it.

  • The Small Business Administration’s four year spending growth was 424.51%, with average annual growth of 106.13%. You would think they were actually making loans directly to small businesses, but we know that’s not the case, so why have annual expenditures increased by $4.9 billion? Cut it.

  • The Social Security Administration’s (On-Budget) four-year spending growth was 182.82%, with average annual growth of 45.70%. On-budget spending isn’t mandated, it’s not the entitlements portion in which Social Security Taxes offset payments to retirees and those with disabilities. No, this is interest and principal repayments of previously looted funds, and coverage of shortfalls due to the payroll tax cut and other gimmicks. You would think they were actually increasing benefit checks or lowering Medicare premiums, but we know that’s not the case, so why have annual expenditures increased by $100.4 billion? Cut it.

  • Total Federal Outlays experienced four-year spending growth of 32.04%, with average annual growth of 8.01%. With that kind of spending, you would think our economy would have grown by more than 7.59% over the four-year period, and achieved far more than average annual growth of 1.90%, but we know that didn’t happen, so why have annual expenditures increased by $874.4 billion? Has the economic stimulus program of 2009 become permanent? Cut it.

  • And last but far from least, the General Services Administration’s four-year spending growth was a whopping 6,896.30%, with average annual growth of 1,724.07%. You would think they were throwing some really wicked parties, or something. Oh, it turns out that was the case! No wonder annual expenditures increased by $1.9 billion. Just cut it.

Our government is spending at a rate which is 322% greater than the underlying economy. We call this “unsustainable”. What do you call it? The egregious growth of the GSA’s expenditures should have been caught long before it became a public scandal. Has anyone in the District of Columbia been paying attention for the past three years? You would think Obama would have caught this with his vast experience running companies, governing States, and all. Oh that’s right, he doesn’t have any experience.

I just gave you $340.2 billion of simple budget cuts, while Obama refuses to acknowledge the problem. If you still don’t get it, here’s the wrap.

The economy isn’t growing. The government is spending at a rate which is 322% greater than its underlying economy. Every additional dollar of tax revenue sucked out of our stagnant economy will cause the economy to decline further, while government continues to live the high life. Since there is no additional revenue to garner, government spending must be cut. The economy was on fire in 2007 on dramatically less government spending. Therefore, returning to the budget of 2007 damages nothing, other than Obama’s plan to bankrupt the nation. If Obama isn’t trying to bankrupt the USA, then what is he doing?

Fire Obama! Cut government spending. Cut the B.S. Cut it big. And cut it now!

References:

Table 4.1—Outlays by Agency: 1962–2017

BEA—Gross Domestic Product and Personal Income

Spreadsheets

Fair Shot, Fair Share and a Glass of Algae

* By: Larry Walker, Jr. *

“Lake Erie is facing its worst toxic algae bloom since the 60’s and somehow it is going unnoticed…” ~ JoeOH111 *

According to Mr. Obama, you don’t have a fair shot right now, and it’s all because millionaires aren’t paying enough income tax. If millionaires would just give the federal government its fair share, then you, I, and everyone else would have a fair shot…, and a glass of algae.

What, pray tell, is a fair shot?

The best definition I can surmise is “a lawful chance at odds.” But don’t we all have this already? For example, the odds of winning the recent $640 million Mega Millions jackpot were 1 in 176 million. In order to guarantee a win, one would have had to spend $176 million buying up every combination. So if some nefarious millionaire had purchased all 176 million combinations, would he or she have had an unfair advantage?

Well, perhaps, but what millionaire would be dumb enough to blow $176 million on lottery tickets? What are the odds of that ever happening? The odds of one person buying all 176 million winning combinations, across multiple States, would probably be 1 in (infinity). In other words, a guaranteed win is impossible, at least when it comes to the Mega Millions lottery. But a fair shot is open to anyone who plays the game. “You gotta be in it to win it.”

According to CBS News, one person purchased $2,600 worth of lotto tickets, and another threw down $55, while the more frugal played their usual dollar or two. Did the one who blew $2,600 have an unfair advantage over $55 and $1 players? I will concede that the $2,600 player had an advantage, but I would hesitate to call it unfair. The poor sap simply had more to lose, yet not a dime more to gain. Not one dime. Now let’s flip over to the Mega Trillions Federal Debt Lotto.

Mega Trillions Federal Debt Lotto

If a taxpayer earns $176 million in taxable income and pays $29.9 million in federal taxes (a rate of 17%), while another earns $50,000 and pays $8,500 in taxes (also a rate of 17%), and yet another earns $25,000 and pays $0, does either have an unfair advantage? Since both the millionaire and the $50,000 wage earner pay the exact same tax rate (17%), the non-taxpayer has an advantage. But is it an unfair advantage? I would say so, especially since in the recent past we all pitched in at every level of income. Yet the one paying $29.9 million in taxes has a lot more to lose than both the $8,500 payer, and the non-taxpayer.

But who wins in this crapshoot? With the federal government borrowing and spending hundreds of billions of dollars, in advance, and squandering it to produce test-tube sewage-fed algae biomass for fuel, while Lake Erie and other U.S. lakes are full of “free” blue-green scum, the answer is no one. You’d have to be an idiot to waste hundreds of billions of dollars manufacturing something that’s sitting right in front of your face, wouldn’t you? Hindsight is 20/20, foresight is priceless.

When it comes to the national debt, those who don’t pay federal income taxes make out like bandits, they have nothing to lose. And those who already pay more than their “fair share” (i.e. taxed enough already) have nothing to gain. It’s not the 2% of top earners that worry me, they generally pay their bills on time, but rather the federal government which has already borrowed more than 100% of our entire economy, an amount estimated to reach $16.3 Trillion by September 30th of this year.

Only a depraved leader would have his nose in other peoples finances while ignoring his own debt laden, broken, overspent, and soon to be bankrupt enterprise. The federal government is not the solution to our problems; it’s the $16.3 Trillion in the hole, deadbeat, money squandering, largest debtor-nation in the Universe, leach, which is forever in the way and constantly on our collective back.

The moral of this story: Never confuse motion with action.

In other words, quit giving speeches and fix the problem. No one is going to vote for a tax increase in the middle of an election cycle, no matter how many speeches are enounced and dribbled. Especially not the one proffered, which in the end will barely cover one day’s worth of current deficit spending. No not a one! We don’t have a revenue problem; no, no, no, what we have is a deadbeat, money squandering, and largest debtor-nation in the Universe, ass-backwards, leach of a federal government problem. Get a clue!

Rather than paying more taxes, or spending multi-millions on lottery tickets to become multi-millionaires all over again, our well-to-do brethren would do better by investing in their own casinos, creating jobs and fair shot opportunities for others. And that leads us back to square one all over again: cut taxes, cut spending, and get out of our way and off our backs.

Photo Credit: Lake Erie, Stirred Up | Via: NASA Earth Observatory (March 21, 2012)

The Real Employment Situation – January 2009 through March 2012

* By: Larry Walker, Jr. *

“Our economy’s now created more than 4 million private sector jobs over the past 2 years. And more than 600,000 in the past 3 months alone,” Mr. Obama boasted to a forum at the White House on women and the economy, on Friday (CBS News).

And in related news, on the previous evening, Egan-Jones Ratings Co. cut the U.S.A.’s credit rating one step to AA, the second downgrade in nine months and two levels below its highest grade, with a negative outlook citing the nation’s increasing debt burden (Bloomberg).

Most of us are well aware of the nation’s impending debt implosion, but the real employment situation has been distorted beyond reason. I understand how badly Mr. Obama is fighting against returning to the obscure existence he led prior to 2008, but if he was at all capable, he would at least tell us the truth about where we stand. I’m frankly weary from all the sugarcoating and distortion of facts. So what’s the real employment situation?

The Truth Shall Set You Free!

In order to know the truth, we must examine not so much monthly trends in employment, but rather changes which have occurred from the end of January 2009 through March 2012. When we examine the entire record, we find that our economy hasn’t created any jobs at all over the past 3 ¼ years, on a seasonally adjusted basis. Instead the unemployment rate has risen from 7.8% to 8.2%, the number of nonfarm jobs has declined by 740,000, the number of unemployed persons has increased by 624,000, and total employment has declined by 153,000. Meanwhile, the working age population has grown by 7,865,000, while the civilian labor force has only managed an increase of 471,000, causing the number of persons no longer counted in the labor force to balloon by 7,395,000.

The truth is that our economy hasn’t created any new jobs since Obama’s policies took effect. The total number of jobs peaked at an all time high of 146,595,000 in November of 2007, and through March of 2012 the number stands at 142,034,000, more than 4.5 million off the mark. If we had more jobs than existed in November of 2007, then Obama would have something to brag about, although not much. But since the truth is somewhat inconvenient, we are supposed to ignore the fact that we are more than 4 million jobs in the hole, and submit to repeated media brainwashing and succumb to the belief that we have somehow moved ahead by over 4 million. Phooey! Here are the facts.

Unemployment Rate

The unemployment rate rose from 7.8 percent in January of 2009 to 8.2 percent as of March 2012, according to the U.S. Bureau of Labor Statistics (Employment Situation 4/6/2012). (See table A-1 / Seasonally Adjusted)

Nonfarm Employment

Nonfarm payroll employment declined by 740,000 through March of 2012, from 133,561,000 in January of 2009 to 132,821,000. (See table B-1 / Seasonally Adjusted)

Unemployed Persons

The number of unemployed persons increased by 624,000 through March of 2012, from 12,049,000 in January of 2009 to 12,673,000. (See table A-1 / Seasonally Adjusted)

Total Employment

The number of persons employed declined by 153,000 through March of 2012, from 142,187,000 in January of 2009 to 142,034,000. (See table A-1 / Seasonally Adjusted)

Civilian Noninstitutional Population

The Civilian Noninstitutional Population (working age population) increased by 7,865,000 through March of 2012, from 234,739,000 in January of 2009 to 242,604,000. (See table A-1 / Seasonally Adjusted)

Civilian Labor Force

The labor force increased by 471,000 through March of 2012, from 154,236,000 in January of 2009 to 154,707,000. The labor force hasn’t grown at all since October of 2008. (See table A-1 / Seasonally Adjusted)

Not in Labor Force

The number of persons not in the labor force increased by 7,395,000 through March of 2012, from 80,502,000 in January of 2009 to 87,897,000. (See table A-1 / Seasonally Adjusted)

To make the claim of having created more jobs than Mr. Bush, which we all know was Mr. Obama’s insinuation; he must first match Mr. Bush’s all-time-high of 146,595,000. If the number of persons who involuntarily dropped out of the labor force (7.3 million), since Mr. Obama’s policies took effect, had instead been jobs created, Mr. Obama might go down in history as the all-time greatest. However, since we presently have 4.5 million fewer jobs than existed at Mr. Bush’s peak, and since, under the direction of Mr. Obama, 7.3 million new working age persons have been pushed straight into joblessness and generational dependency, Mr. Obama’s policies should perhaps be branded as the most ineffective in U.S. history.

Since employment is a lagging economic indicator, and because economists are calling for recession in 2012, and since the statistics above represent the sum total of Obama’s economic accomplishments, we’re in for serious troubles ahead. To reiterate, Mr. Obama’s policies of Inordinate Stimulus, Undue Debt and Global Warming Foolishness caused the Looming Recession.

Photo Credit: A swarm of Western Toad tadpoles eating algae. Photo: Kristiina Ovaska

Reference: Bureau of Labor Statistics, Employment Situation Summary

Data: Worksheets

The Malaise of 2012 | Part IV

* Inordinate Stimulus, Undue Debt and Global Warming Foolishness Caused the Recession

* By: Larry Walker, Jr. *

“With few exceptions no educated person in the history of Western Civilization from the 3rd Century B.C. onward believed that the earth was flat… No one before the 1830’s believed that medieval people thought that the earth was flat.” ~ Jeffrey Burton Russell (The Myth of the Flat Earth)

Global Warming Foolishness

In an article entitled, “Algae for Waste Water Treatment and BioFuel Production: A Double Winner,” Dr. John Kyndt and Dr. Aecio D’Silva discuss the process known as phycoremediation, which is short for treating waste water with micro algae, for the purpose of producing low cost algae biofuels and other biomass products.

Biofuel is a type of fuel whose energy is derived from biological carbon fixation. The advantage of algae is that it will supposedly consume more CO2 than is released in the process. Unfortunately, and unbeknownst to many, this has not been the case with previous generations of biomass. So how did scientists arrive at the recent pronouncement that algae-biomass is the answer to our future fueling needs?

In 2008, two groups of US researchers independently concluded that most biofuels commonly thought of as solutions for reducing greenhouse gases, turned out instead to increase greenhouse gas emissions. Clearing grassland or forests to plant them released more carbon dioxide than could be saved in the process. The analyses proved that large amounts of trapped carbon are released into the atmosphere when vegetation burns or decays as land is cleared. This up-front ‘carbon debt’ could take centuries to break even with emissions gradually avoided by substituting biofuels in place of fossil fuels. Many studies subsequently arrived at the same conclusion.

For example, sugarcane ethanol grown on the converted Brazilian savannah would need to replace petrol emissions for 17 years just to repay the carbon released when the savannah was converted. Other examples, such as soybean biodiesel from cleared Amazonian rainforest, took centuries to break even. The studies concluded that, only biofuels made from waste products, or grown on abandoned lands would do less harm than good. Thus the algae boom was born. The same line of reasoning eventually lead to the latest craze: treating waste water with algae for biofuel production. A double winner loser!

Ironically, fossil fuels have their origin in ancient carbon fixation, a similar process to that realized through detoxifying sewer water with algae. However, green scientists don’t recognize fossil fuel as a biofuel because it contains carbon that has been out of the carbon cycle for a very long time (which might actually be a good thing). Thus, we have green fuel, manufactured through synthetic carbon fixation, versus black gold, created through naturally aged carbon fixation.

Here’s how the algae fad works. Instead of waiting on Mother Nature to naturally form fossil fuels, mankind is now capable of producing the same effect in a fraction of the time. We have arrived. The idea is that as you flush your toilet, instead of the waste flowing to costly, energy consuming, waste water treatment facilities; it will instead be treated with algae before returning to your tap. In turn, the algae will be converted into biodiesel, green diesel, bio-jet and chemicals. The residual biomass, which is high in proteins and carbohydrates, will be used in aquaculture, animal feed, and food ingredients. Did I say food ingredients? Yes. And that makes algae a triple loser!

In fact, one particular algae biofuel manufacturer, Solazyme, boasts of its ability to create renewable oil – for fuel, and for food. Among its primary inputs are waste streams. When I recently learned that one of my favorite frozen food companies, which I won’t name here, was using the residual biomass from Solazyme in its food-line, I immediately discontinued its use. The thought of diesel fuel, and food coming from the same sewage fed algae-brew was more than I could take, as I alluded to in, Ends of the Green Agenda – Costs of Algae Biofuel.

The U.S. Navy has announced the objective of operating at least 50% of its fleet on clean, renewable fuel by 2020. According to Marine Corps Times, in 2009 the Navy paid $424.00 per gallon for 20,055 gallons of biodiesel made from algae, which set a world record at the time for the cost of fuel. Solazyme was the recipient of this lucrative contract. In the midst of the worst recession since the Great Depression, the U.S. Navy presumed that paying $424.00 per gallon for algae biodiesel (while petroleum based diesel was selling for an average of $2.50 per gallon) was somehow not a foolish waste of taxpayer’s money.

How has the company fared since the stimulus well ran dry? Solazyme (symbol: SZYM) opened on the NASDAQ Exchange at $20.71 in May of 2011, peaked at $27.03 in July of 2011, then tanked to $8.29 by October of 2011. Although it recently closed at $15.05 on March 21, 2012, and its total revenue for the fiscal year ended December 31, 2011 was $39.0 million compared with $38.0 million in the prior year, its fiscal year 2011 GAAP net loss attributable to its common stockholders was $(54.0) million, compared with $(16.4) million in the prior year.

So since Solazyme had $39 million in revenue but wound up losing $54 million in 2011, it appears to be a huge boondoggle. It’s quite a feat for a company to lose more than 100% of its total revenues. Were it not for the government’s inordinate stimulus coupled with undue debt, this foolish endeavor, along with a myriad of others, wouldn’t exist.

Yes, it’s true, global warming foolishness is a major cause of the looming recession. Instead of focusing on root causes of the previous recession, the Obama Administration has gone awhoring after science fiction myths and bowed itself to strange gods. And because of this we must all pay a price.

Economist Raymond Richman of Ideal Taxes sums it up:

The growth of state-subsidized bio-fuels, windmills and solar panels, hybrid vehicles, electric cars, and lithium battery manufacturers has highly negative effects on employment and regressive effects on the distribution of income.

We estimate that about $100 billion in grants and tax credits have been extended by the federal and state governments to the proprietors of those establishments, making many of them rich and eager to take advantage of the free capital and guaranteed loans.

Tax rebates and tax credits do not appear in our federal budget.

American economists are at a loss to explain the continuing high level of unemployment in the face of the $800 billion Recovery Act expenditures, the $1.5 and $1.8 trillion budget deficits in 2010 and 2011, and “green” energy subsidies, federal and state.

Moreover, none of the “global warming” could compete with fossil fuels without huge government subsidies. The states and federal government provided about 60 percent of the capital of the green enterprises and got nothing in return. The government made sure that wind and solar plants got a high enough price for the electricity they produced by requiring electric utilities to buy their electricity output regardless of price. The subsidies are so costly that Spain had to end the wind and solar subsidies to avoid bankruptcy and we shall have to as well.

Recently, while attempting to defend his global warming panic policies, Barack Obama made the following humorous remark, “If some of these folks were around when Columbus set sail, they probably must have been founding members of the flat earth society. They would not believe that the world was round.” Apparently everyone but Obama knows that, with few exceptions, no educated person in the history of Western Civilization from the 3rd Century B.C. onward believed that the earth was flat.

Am I supposed to trust a man who is roaming around the countryside proclaiming that the world will turn into a giant incinerator within a couple of years, unless we start making our food and fuel out of our own feces?

I simply refuse to believe that the World will turn into a ball of fire through our continued, prudent use of natural, God-given, carbon based fossil fuels. However, I do believe that the U.S.A. is headed for a cliff. If this nation keeps on borrowing and spending like it is today, we might be forced into bankruptcy within a couple of years, a concept which is apparently beyond Mr. Obama’s grasp.

The U.S. is sitting on a 200-year supply of oil. If the idea is to break free from our dependence on foreign oil, I’m game, and we can start doing that right now, with our God-given natural resources. But if the idea is some foolish Doomsday notion, based on panic and fear, then Obama should be removed from the White House, and returned to the nearest urban street corner, cardboard sign and all. Global warming foolishness is the third and final element contributing to the Malaise of 2012.

Continued from: The Malaise of 2012 | Part I | Part II | Part III

——————————————————————————————————

Other references:

http://en.wikipedia.org/wiki/Biofuel#cite_note-Science2-51

Unilever’s new Durban plant a model of sustainable savoury dry food production – Well alrighty then!

11 Great Things to Do With Sewage

Algae Meal Performs as Dairy Cattle Feed

The Malaise of 2012 | Part III

* Inordinate Stimulus, Undue Debt and Global Warming Foolishness Caused the Recession

* By: Larry Walker, Jr. *

It is impossible to calculate the effect of deficit-financed government spending on demand without specifying how people expect the deficit to be paid off in the future. ~ The Theory of Rational Expectations

Undue Debt

Obama’s three-point plan for deficit reduction can be summed up in three words, “Spend Baby Spend.” In fact, Obama will have borrowed more than $6.3 trillion during his four-year term, which is more than the first 42 and 1/4 presidents combined. And what do we have to show for it? Nothing! The only thing that his profligate spending has accomplished is to effectively stifle any chance of recovery from the December 2007 recession.

The total debt outstanding, from the inception of the United States through George W. Bush’s second year in office was $6.2 trillion. Since Obama has borrowed $6.3 trillion in four years, that’s more than the total debt incurred in the first 226 years of American history. Now that this is clear, there is really only one question:

Have we recovered yet?

To answer this, all one has to do is look at employment. The number of jobs reached an all-time high of 138,023,000 in January of 2008, but today, we are still 5.3 million jobs short of this mark.

As of the February 2012 Employment Situation Report, employers logged in a total of 132,697,000 jobs. Well great, but that’s only 170,000 more jobs than there were in February of 2001. In fact over the same 11-year period, the civilian non-institutional population grew by 29,692,000 persons. So since the working age population has grown by over 29 million, while the number of jobs has grown by a mere 170,000, the answer to that question is negative. The handwriting is on the wall.

So what was Obama’s three-point deficit plan, again? Step one was to borrow, step two to spend, and step three to repeat step one. As you may recall, “We have to spend more to keep from going broke.” It’s Endless Stimulus! Spend baby spend! As far as when principal repayments will begin, well, even with a second term, that would be never, since Obama failed to produce a budget during his first term.

As we discussed in War on Wealth III | National Debt Review, since the gross public debt as a percentage of GDP has skyrocketed from 69.9% in 2008, to 104.8% in 2012, and is projected to reach 107.8% by 2014, our ability to repeat the mistakes of the Obama administration is over. This means there won’t be a second term. The Era of Obamanomics is over.

Obama prematurely increased spending to DEFCON 1 levels, yet World War III isn’t here yet. And in spite of this undue debt, we are now heading directly into another recession, this year, in 2012. The Economic Cycle Research Institute (ECRI) reiterated its recession call on March 15, 2012, in a detailed report entitled, Why Our Recession Call Stands.

Honey baby, when the federal government borrows and spends $6.3 trillion dollars, as it has done between fiscal years 2009 and 2012, that’s 6.3 trillion fewer dollars the private sector has had access to. Having trouble qualifying for a loan? Did your local bank go belly up while you waited for approval? Small wonder; for even lenders are rational beings.

Shall we lend more money to homeowner’s who are already upside down on their mortgages, to small businesses owners who lack guarantees, or shall we instead lend to the federal government which has a guaranteed ability to repay? A printing press, that is. Undue Debt is the biggest factor contributing to the Malaise of 2012.

“When people do not accept divine guidance, they run wild. But whoever obeys the law is joyful.” ~ Proverbs 29:18

To be continued …

Continued from: The Malaise of 2012 | Part I and Part II

The Malaise of 2012 | Part II

* Inordinate Stimulus, Undue Debt and Global Warming Foolishness Caused the Recession

* By: Larry Walker, Jr. *

“… an unprecedented degree of federal government spending and intervention vis-à-vis the $787 billion dollar economic stimulus package, the $81 billion dollar bailouts of GM and Chrysler, and the enactment of health care and financial regulatory and reform bills have done nothing to stimulate our anemic recovery and have fundamentally failed at creating private sector jobs, or generating economic growth necessary for a sustainable, healthy recovery.” ~ Douglas Schoen via: The Daily Beast

Inordinate Stimulus

According to Economist Raymond Richman of Ideal Taxes Association, “The recession of 1937-38 indicated that there was no Keynesian multiplier.” That is to say, as soon as the stimulus of the preceding four years was reduced, the economy tanked. Nevertheless, Keynesians believe that the Roosevelt administration reduced stimulus spending too soon. The same argument has been made by Nobel Prize winner Prof. Paul Krugman and former Chairman of the Council of Economic Advisers, Prof. Christina Romer, and many others, after the failure of the $787 billion Recovery Act of 2009.

If four years of government stimulus isn’t enough, how long should it take, until the nation declares bankruptcy? The truth is it really doesn’t matter how long a stimulus program lasts, whether it endures for a day, a week, a month or a century; as soon as the program ends, so does all of the propped up economic growth. Is there any proof to the contrary? No, not unless hot air can be likened to proof. Let’s us ponder the stimulus theory.

For example, if the government were to give each citizen a $40 per month advance out of their future Social Security retirement entitlement, such stimulus may provide a small boost to personal consumption, or private savings. Why a family of four might even be able to purchase an extra half-tank of gasoline, at today’s prices. But will the ability to buy an extra half-tank of gas lead to a permanent $40 per month pay raise?

Not unless the extra mileage is used to obtain either a second, or higher paying job. Short of that, once the stimulus ends, so will the temporary boost to disposable monthly income. The point is that unless a stimulus program results in a permanent increase to future income, when the program ends, the recipient is demoted back to square one, or in the current economy, square zero.

With inflation soaring as it is today, an extra $40 per month will, if one is lucky, afford the same amount of gasoline that could have been purchased three years ago, at half the cost. And what’s the trade off? Well, one can either look forward to a smaller retirement annuity in the future or a tax hike in the near-term in order to make up the difference.

Green wasn’t as green as we thought!

To further drive home the point, if the government were to identify certain promising green energy companies, and to grant them billions of dollars in loan guarantees; would this represent the kind of stimulus capable of permanent growth? Well, that would depend on whether such companies produced marketable products. We know the U.S. Department of Energy has already engaged in precisely such activity. And what were the results?

As soon as the funds were disbursed, the companies purchased buildings, equipment, hired workers, and began to manufacture. But in most cases, the products in question have turned out to be overpriced and unmarketable. Since there was no unsubsidized present day demand for imaginary 22nd Century products, once the stimulus well ran dry, most of these grand endeavors collapsed. The remainder will soon follow suit.

Dr. Valerie Ramey, Professor of Economics at the University of California, San Diego recently published a Working Paper Series in the National Bureau of Economic Research (NBER) entitled, “Government Spending and Private Activity,” in which she drew the following conclusions:

  • Private spending falls significantly in response to an increase in government spending.

  • Increases in government spending lower unemployment, but in most cases virtually all of the effect is through an increase in government employment, not private employment.

  • And that on balance, government spending does not appear to stimulate private activity.

Although in early 2010 the economy received a jolt, the bump in the road we all felt was nothing but a speed bump on the way to another recession. The sheer size of the injection propelled us upward for a fleeting moment, but in the aftermath, GDP declined from a year-over-year growth rate of 3.0% in 2010, to a year-over-year growth rate of just 1.7% in 2011. Alas, once the stimulus subsided, economic growth was cut nearly in half. Inordinate stimulus is a major contributor to the Malaise of 2012.

No matter how you slice it, deficit-financed government stimulus doesn’t provide the requisite spark essential to permanent economic growth, it never has, and it never will. There is no Keynesian multiplier. So what else is new?

To be continued …

Continued from Part I

Related:

Tax Simplification, Part II – Saving $1,756 Billion, Overnight

Why Our Recession Call Stands – Economic Cycle Research Institute (3/15/12)

The Malaise of 2012 | Part I

* Inordinate Stimulus, Undue Debt and Global Warming Foolishness Caused the Recession

* By: Larry Walker, Jr. *

Despite Obama’s optimism, the Economic Cycle Research Institute (ECRI), the same organization which successfully predicted the last recession, and which over the last 15 years has gotten all of its recession calls right while issuing no false alarms, has recently opined that a 2012 recession is now inevitable.

According to ECRI, the four basic metrics that define an economy are gross domestic product (GDP), personal income, broad sales and employment. GDP peaked in the 2nd quarter of 2010, and has since been cut in half. Personal income and broad sales have closely tracked GDP. And although there has been a firming in jobs growth, when the four are taken together, the data confirm that the economy is slowing. We are heading into recession.

Employment is a lagging indicator.

Many mistakenly believe that if jobs growth gets a little better, then consumption, production and income will all improve; but in the real world jobs follow consumption, production and income. In other words, as consumption, production and income improve higher levels of employment follow. But since consumption, production and income are all on the decline, the jobs market will soon follow.

Case in point: During the recession of 2001, which lasted from March until November of 2001, employment peaked at an all-time high of 132,529,000 jobs in February, a month ahead of the recession. Six years later, during the recession of 2007, which lasted from December of 2007 through June of 2009, the number of jobs hit a new all-time high of 138,023,000 in January of 2008, the month following the start of the recession.

At the other ends of the spectrum, during the former recession (March 2001 – November 2001), the number of jobs didn’t reach a bottom of 129,840,000, until June of 2003, some 19 month’s after the recession ended. While during the latter malaise (December 2007 – June 2009), the jobs market hit a bottom of 129,244,000, but not until February of 2010, a full 8 month’s after the recession ended.

So which came first, the chicken or the egg? In other words, does a slow down in hiring lead to a slow down in hiring? Or does the tanking of GDP, personal income and broad sales lead to recession, and recession to the loss of jobs? I think we know the answer.

What’s sad is that the U.S. never fully recovered from the recession of December 2007, yet here we go again. Just look at employment. As of the February 2012 Employment Situation Report, employers logged in a total of 132,697,000 jobs, which is just 170,000 more than we had in February of 2001. Yet over the same period of time, the civilian non-institutional population has grown by some 29,692,000 persons. So as the working age population has grown by over 29 million, the number of jobs has grown by a mere 170,000. The handwriting is on the wall.

The point is that any improvement we are seeing in today’s employment situation isn’t necessarily cause for celebration, at least not for Mr. Obama, as it is likely the end of his (temporary) stimulus based, debt laced, global warming panic induced, anemic recovery. If you still don’t get it, go back to the top and re-read paragraphs 1 through 3, and it might help if you follow the links.

To be continued…

U.S. Economic Growth at 21-Month Low

* Recession Due by November of 2012 *

* By: Larry Walker, Jr. *

“Are you cut out to live a lie? If you don’t mind skulking around, leading a double life and constantly having to look over your shoulder to make sure you don’t get found out, you may have just what it takes.” ~ How to Live a Lie (eHow.com)

As I pointed out in War on Wealth, Part II | Keeping Our Foot on the Gas, Barack Obama, the unopposed Democrat presidential nominee, has been out on the campaign trail spreading the following wildly inaccurate cliff-hangers. He says, “Manufacturing is coming back. Companies are starting to bring jobs back. The economy is getting stronger. The recovery is speeding up. We’re moving in the right direction. And now we have to do everything in our power to keep our foot on the gas.”

But according to the Economic Cycle Research Institute (ECRI), the same crew that predicted the last recession, U.S. economic growth is at a 21-month low, and we are heading straight into another recession, this year, in 2012.

ECRI is a private forecasting firm based in Manhattan which was founded by Geoffrey H. Moore, the economist who helped originate the practice of using leading indicators to predict business cycles. Over the last 15 years, ECRI has gotten all of its recession calls right, while issuing no false alarms.

In the institute’s view, the United States, which under the leadership of Barack Obama has failed to recover from the last downturn, is currently plummeting into a new one. On September 30, 2011, Lakshman Achuthan, the institute’s chief operations officer, said,” If the United States isn’t already in a recession now it’s about to enter one.” Mr. Achuthan maintains this position to this day. Here he is in a February 24, 2012 interview on CNBC:

http://plus.cnbc.com/rssvideosearch/action/player/id/3000075118/code/cnbcplayershare

In fact, if you carefully study the table below, courtesy of the National Bureau of Economic Research, what should stand out is the fact that, ever since 1945, the United States has averaged an economic recession once every 59-month’s. Therefore, it is logical to infer that since the last recession began in December of 2007, the next recession should be arriving by November of 2012.

After the way Mr. Obama has divided and driven the federal government and our nation into the ground over the last 37 month’s, can you imagine how he would act under the duress of a self-imposed recession? More bailouts, never-ending stimulus, trillions more in crushing debt, bigger deficits, numberless regulations, higher taxes, continued covering of his tracks with a vast array of alibis and excuses, and more lies. Oops! Did I say lies?

It’s been real though, I mean the loss of almost a million manufacturing jobs since 2008; the decline in economic growth from a peak annual rate of 3.0% in 2010, to just 1.7% in 2011; the national debt as a percentage of GDP skyrocketing from 69.9% in 2008 to 104.8% in 2012, and projected to reach 107.8% by 2014; and lest we forget, gasoline prices rising from an average price of $1.61 in the week ending December 29, 2008, to $3.79 as of the week ending March 5, 2012. However, anyone who’s still considering Mr. Obama’s re-election should take the time to study not only ECRI’s economic indices, but also the eHow.com article, “How to Live a Lie” – because if you still believe in Obama there’s no sense in beating around the Bush.

Ends of the Green Agenda

Costs of Algae Biofuel

* By: Larry Walker, Jr. *

Detective Thorn: It’s people. Soylent Green is made out of people. They’re making our food out of people. Next thing they’ll be breeding us like cattle for food. You’ve gotta tell them. You’ve gotta tell them! ~ Memorable quotes from Soylent Green *

The U.S. Energy Information Administration (EIA) reported that gasoline prices have risen from an average price of $1.61, in the week ending December 29, 2008, to $3.72, as of the week ending February 27, 2012 (see chart above). So with gasoline prices on a tear having risen by 131% just since December 29, 2008, biofuel enthusiasts have once again arisen from the sludge, this time proclaiming that algae biofuel is the answer to our energy needs.

According to Marine Corps Times, in 2009 the U.S. Navy paid $424.00 per gallon for 20,055 gallons of biodiesel made from algae, which set a world record at the time for the cost of fuel. Are you kidding me? In the midst of the worst recession since the Great Depression, the Navy thought that paying $424.00 per gallon for algae biodiesel while petroleum based diesel was selling for an average of $2.50 per gallon was somehow smart?

Then, in December of 2011, according to Defense News, the U.S. Defense Department signed a contract to buy 450,000 gallons of biofuel – the largest purchase ever by the federal government – to power the U.S. Navy’s “green” carrier strike group. The blend of used cooking oil and algae will be mixed with traditional fuels to help power the carrier strike group during military exercises this summer in the Pacific Ocean. The $12 million purchase works out to about $26.00 per gallon.

More recently, on February 27, 2012, House Armed Services Committee member Randy Forbes had harsh words for Navy Secretary Ray Mabus, saying he was focusing too much on alternative fuel development and not enough on sailors and ships. Forbes says biofuel costs four times as much to manufacture as fossil fuel, and that’s something the Navy can’t afford now. “That’s why I said ‘Mr. Secretary, with all due respect, you’re not the Secretary of Energy, you’re the Secretary of the Navy,'” stated Forbes.

Although, in the second purchase, no breakdown was provided for the cost of algae biofuel by itself, it’s obvious that the cost per gallon has dropped dramatically over a two year period. But it’s doubtful that this would have occurred without massive government stimulus through agency purchases such as by the U.S. Navy, as well as loan guarantees and grants from the U.S. Department of Energy. But with the price of petroleum based diesel fuel currently selling at around $4.00 per gallon, does it make sense for our military to be purchasing fuel which costs six-and-one-half times more? Well, let’s just hope we don’t get involved in major war anytime soon.

A peek at the algae biofuels production process. [Image Source: Solix Biofuels]

The Cost of Converting to Algae Biofuel

In his paper entitled, “Widescale Biodiesel Production from Algae,” Michael Briggs, of the University of New Hampshire, Physics Department, lays out some of the costs of replacing our dependence on oil with algae biofuel.

“First, consider if you will, a treaty between the United States and Mexico, where Mexico grants the U.S. a permanent right-of-way to the Gulf of California for the purpose of building a seawater canal that will transport a large and continuous flow of seawater from the Gulf of California into the USA. For the sake of discussion, let us assume that a canal has already been built between the Gulf of California and the Salton Sea; and that the Salton Sea will serve as a transfer reservoir.

Now, visualize a large aqueduct between the Salton Sea and Death Valley where a second inland sea has formed, approximately the size of the Salton Sea. From these two inland seas, several aqueducts extend out into the deserts of the Southwestern United States; Reaching into Arizona and Nevada.

Of the many and various desert farms, ranches and communities served by the aqueducts, there will be forty-thousand algae farms, having a total water surface area of 250 acres each. Two-hundred and fifty acres multiplied by forty-thousand farms equals a total of ten million acres of shallow water algae ponds, dedicated for the purpose of growing non-food renewable biomass for the production of transportation fuels.”

Sure Mr. Briggs, I am trying to envision the federal government building a canal from the Gulf of California to the Salton Sea, but I’m having a little trouble because I’m wondering why it hasn’t been able to secure our Southern border, and I’m also pondering the $16 trillion federal debt, pending construction of California’s $53 billion Bullet Train to nowhere, and the government’s unwillingness to move forward with the privately funded Keystone XL pipeline.

Note: The costs of constructing the necessary seawater canal, aqueducts and reservoir outlined above are not included in Mr. Briggs’ cost estimates which follow.

Capital Requirements

  • 1 hectare = 2.47 acres. Michael Briggs gave an estimate of $80,000 per hectare for the construction costs to build the algae ponds.
  • $80,000 divided by 2.47 = 32,390 rounded. We will say $32,500 per acre.
  • $32,500 times 250 acres = $8,125,000 construction costs for a 250 acre algae farm.
  • $8,125,000 times 40,000 farms = $325,000,000,000 to construct ten million acres of algae ponds.

Note: That’s a total of $325 Billion to construct the required 10 million acres of algae ponds. This does not include the costs of building a seawater canal from the Gulf of California to the Salton Sea, or the costs of constructing an aqueduct from there to an inland reservoir in Death Valley. Neither does it include the costs of constructing the many distributed biorefineries that will be needed to process the algae into biodiesel.

Operating Expenses

Mr. Briggs also provided an estimate of $12,000 per hectare for operating costs (including power consumption, labor, chemicals, and fixed capital costs).

  • $12,000 divided by 2.47 = 4,860 rounded. We will say $5,000 per acre for operating costs.
  • $5,000 times 250 acres = $1,250,000 annual operating costs for a 250 acre algae farm.

Annual Production

The University of New Hampshire Biodiesel Group also provided the following information on their Algae ponds:

“Micro algaes present the best option for producing biodiesel in quantities sufficient to completely replace petroleum. While traditional crops have yields of around 50-150 gallons of biodiesel per acre per year, algaes can yield 5,000-20,000 gallons per acre per year. Algaes grow best off of waste streams. Agricultural, animal, or human. Some other studies have looked into designing raceway algae ponds to be fed by agricultural or animal waste. We are now pursuing funding to investigate redesigning wastewater treatment plants to use raceway algae ponds as the primary treatment phase. With the dual goal of treating the waste and growing algae for biodiesel extraction. We also plan to investigate the possibility of using the algae mush (what is left after extracting the oil) as a fertilizer.”

An estimate of 5,000 to 20,000 gallons per acre per year is a rather wide discrepancy. Apparently seawater doesn’t provide enough nutrients to grow micro algae. Algaes grow best off streams of human, animal and agricultural waste. Wait; did he just say human waste?

In his paper, under the section titled: “How much biodiesel,” Mr. Briggs concluded that 140,800,000,000 (140.8 billion) gallons of biodiesel could replace 100% of the petroleum transportation fuels consumed in the United States annually, without requiring a big change in driving behavior or automotive technology. Although he did assume everyone would switch to diesel engines because of the superior efficiency of diesel compared to gasoline engines.

  • 140.8 billion gallons divided by ten million acres = 14,080 gallons per acre (per year). We will say 15,000 gallons per acre (per year).

Note: The costs of converting all gasoline powered engines to diesel were also omitted from Mr. Briggs’ cost estimates.

Operating and Capital Costs

Based on Michael Briggs’ estimates, an algae farm with 250 acres of pond surface area would have $1,250,000 in annual operating expenses.

  • 15,000 gallons per acre times 250 acres = 3,750,000 gallons per algae farm per year.
  • $1,250,000 divided by 3,750,000 gallons = 33.3333 cents per gallon in operating costs.

How much will it cost to pay off the $32,500 per acre loan for the initial construction costs (the $80,000 per hectare)? That is: $32,500 times 250 acres = $8,125,000 construction costs for a 250 acre algae farm.

Let us assume a zero Interest federally insured loan spread over 20 years with a single payment of 1/20th of the principle due each year.

  • $8,125,000 divided by 20 years = $406,250 cost of debt per year per 250 acre algae farm.
  • $406,250 divided by 3,750,000 gallons = 10.8333 cents per gallon cost of debt (at 15,000 gallons per acre).

If the annual yield is 15,000 gallons per acre, then the cost of producing algae biodiesel feedstock would be .442 cents (10.8333 + 33.3333) per gallon. Multiplying this by 42 = $18.56 per barrel of oil equivalent.

Finally, if each farm earned .10 cents per gallon profit, then:

  • 15,000 gallons times 250 acres times 10 cents = $375,000 per year net earnings.

This would bring the total cost of algae crude to .542 (.442 + .10) cents per gallon, or $22.76 per barrel of oil equivalent.

Summary

Although a cost of $22.76 per barrel of oil equivalent sounds great, it doesn’t include the following costs:

  • Building a massive seawater canal from the Gulf of California to the Salton Sea, and then constructing a series of aqueducts from there into a reservoir in Death Valley. How much will that cost, and who will foot the bill?

  • Constructing the many distributed biorefineries that will be needed to process the algae into biodiesel, without which this scheme is all for naught. How much will this cost? Who’s going to put up the capital?

  • Converting all gasoline powered engines to diesel. Who’s going to cover this?

Aside from the above omissions, who will front the $325 Billion initial capital expenditure for construction of the algae farms? And what’s going to happen if production estimates per acre fall short of the required 15,000 gallons?

Since the federal government is officially broke, and unable to fund construction of a massive seawater canal, system of aqueducts, and the necessary reservoir, it sounds like the least costly and most efficient scenario for algae biofuel lies in finding a way to pump all of our raw sewage – human, animal and agricultural – directly to the proposed algae farms.

It turns out that using raw sewage is the best way to ensure the most bang-for-the-buck out of each algae farm. But won’t raw sewage attract rodents and create other ecological problems? Perhaps, but who cares about that? Just toss the looming hordes of tadpoles and sewer rats into the refining vats as well.

While everyone has been focusing on the means of the green agenda, don’t its ends lead to the recycling of all things, including eventually human beings? That’s been pretty clear since the 1972 production of Soylent Green. Anyways, for now, Green energy enthusiasts may have to settle for converting renewable human waste into algae biofuel.

I can imagine, sometime in the near future, a Charlton Heston type (Detective Thorn in Soylent Green) crying out with his last breath, “It’s poo-poo. Algae Biofuel is made out of poo-poo. They’re making our fuel out of poo-poo. You’ve gotta tell them. You’ve gotta tell them!” Yeah, yeah, we know, just follow the sewer rats.

In the meantime, for me anyway, a little more gasoline production will suffice. Can we please, please, exhaust America’s God-given natural resources before we start breaking out the Soylent Green? And no Mr. Obama, Step one is “Drill”, Step two is “Baby”, and Step three is “Drill”. You got that?