High Gasoline Prices and the 2012 Recession, Part I

Truth is not easily hidden.

– By: Larry Walker, Jr. –

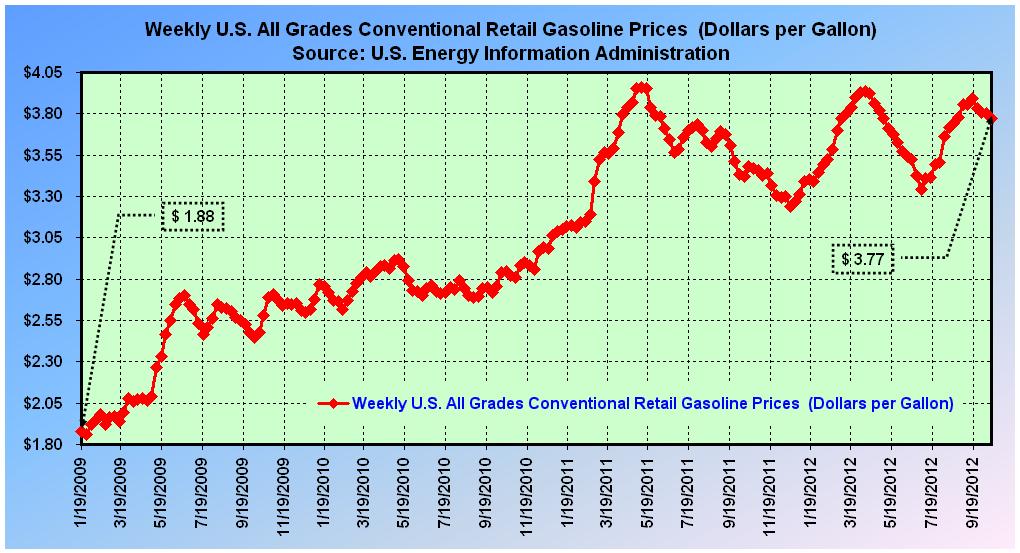
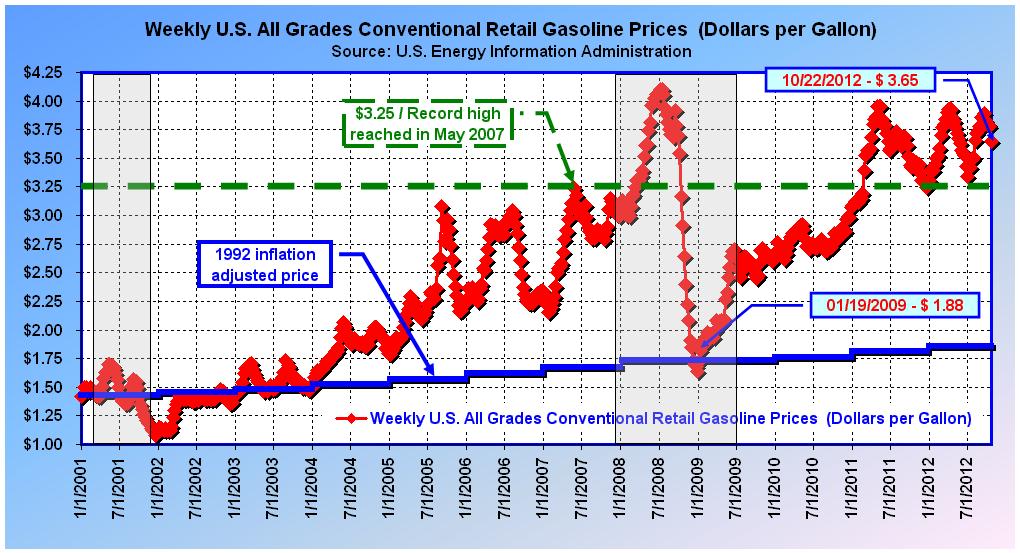
Conventional retail gasoline averaged $3.65 a gallon in the most recent week ended October 22, 2012, yet when Barack Obama was sworn into office the price averaged $1.88. When questioned about the 94.2% increase which occurred on his watch, Mr. Obama remarked that the reason gasoline prices were so low when he entered office was because the U.S.was “in the middle of an economic depression.” However, the question wasn’t why prices were so low when he entered office, but rather why they ballooned by 94.2% on his watch. We’re still awaiting his answer.

In the second presidential debate, Barack Obama stated that, “oil imports are at the lowest levels in 16 years.” But as I pointed out in Debate 2 | Obama’s Oil & Gas Rhetoric, the gasoline I need to fill my tank only cost an average of $1.23 a gallon in 1996, the equivalent of $1.81 today. And later in the same debate, Obama proclaimed that, “oil imports are down to the lowest levels in 20 years.” Well, which is it Mr. President? I pointed out in the same post, that the 1992 price of regular unleaded averaged $1.13 per gallon, the equivalent of $1.86 today. Is the price of gasoline $1.81 to $1.86 today? No. So then what was Obama’s point?

Are we supposed to believe that it took an economic depression to bring gasoline prices down to $1.88 in the week ended January 19, 2009, when that would actually have been higher than the average inflation adjusted price of $1.73 at that time? I don’t know what that tells you, but it tells me that gas prices were in a bubble before the Great Recession, a bubble which finally burst during month 8 of the 19-month downturn. High gasoline prices were actually one of the factors leading to the Great Recession, the subsequent decline merely brought prices in-line with the historic norm.

If this is true, then hasn’t the price of gasoline been in the midst of another bubble since 2011 (see chart below)? And if a bubble currently exists, does that mean the U.S. is either in or near recession? To know the answers, we must venture back in time and analyze what actually took place prior to the Great Recession. The following analysis focuses on all grades of conventional retail gasoline.

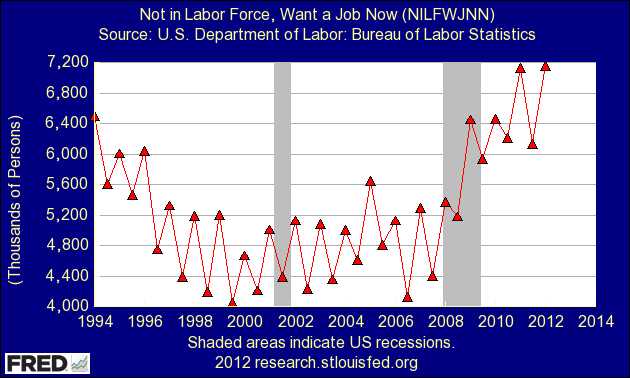
Gasoline Prices and the 2001 Recession

Gasoline prices generally rise during the first six months of the year, and fall during the remainder. The 2001 recession began in March and ended in November, as indicated by the first shaded area in the chart above. Going back to January 1, 2001, according to the U.S. Energy Information Administration, we find that conventional grades were selling for an average of $1.42 per gallon. Once the recession commenced prices peaked at $1.70 in May, before the normal seasonal decline. But due to the recession, followed by a post-911 reduction in demand, prices continued to fall reaching a low of $1.08 by the week ending December 18, 2001. This represented a decline from the peak of roughly 36%, over 32 weeks.

Based on the 1992 price per gallon of $1.13, the 2001 equivalent price should have been $1.43 (as represented by the solid blue line). Due to the recession, gasoline prices temporarily declined below the inflation adjusted level, but would eventually regain equilibrium, reaching $1.46 towards the end of 2002. All in all, gasoline prices remained at or near equilibrium between 2001 and 2003. It was in 2004 when prices began to spin hopelessly out of control. The reason for the subsequent price hike was initially blamed on a significant number of refineries being offline, and later by rising crude oil prices.

Prior to the Great Recession, a record high of $3.25 per gallon was set in the week ended May 21, 2007. The chart above contains a green dashed-horizontal line at the breaking point, the pre-Great Recession record of $3.25 a gallon. The solid blue line represents the annual inflation adjusted price of 1992 gasoline. Although gas prices may currently be on the decline, until they dip below $3.25 a recession threat remains. At the same time, any price above $1.86 is not optimal. So where are we today?

Gasoline Prices and the Great Recession

The Great Recession commenced in December of 2007. At the time, gasoline was averaging $3.03 per gallon, but within the first eight months the price would set a new record of $4.10 per gallon in the weeks ending July 7 and July 14, 2008 (see chart above). But then something phenomenal happened. From the peak, prices declined to $3.17, or to below the $3.25 breaking point within just 14 weeks. And prices continued to fall all the way to a low of $1.64 by the week ending December 29, 2008, within another 11 weeks. So from peak to trough, gasoline prices declined by 60% in just 25 weeks, a notable difference from the 36% decline over 32 weeks at the end of the 2001 recession.

After the 2001 recession prices remained relatively stable for two years, but that wasn’t the case with the Great Recession. This time, when prices hit bottom the recession wasn’t over. It probably should have been over at that point, and perhaps it would, had it not been for artificial demand, induced by an unprecedented amount of deficit-financed government intervention. By the time the Great Recession ended, the price of conventional gasoline had risen from a bottom of $1.64 to $2.64. So from an early Great Recession surge to $4.10, prices finally flushed out at $2.64.

To summarize, during the Great Recession, gasoline prices rose by 35% before declining by 36%. By comparison, during the 2001 recession, prices rose by 20% before declining by 36%. That seems fairly harmless on its own, but what’s missing is the fact that gasoline prices doubled, from $1.50 to $3.08, during the previous recovery, between January 2004 and December 2007. That’s the key. There’s the bubble. So what was the cause?

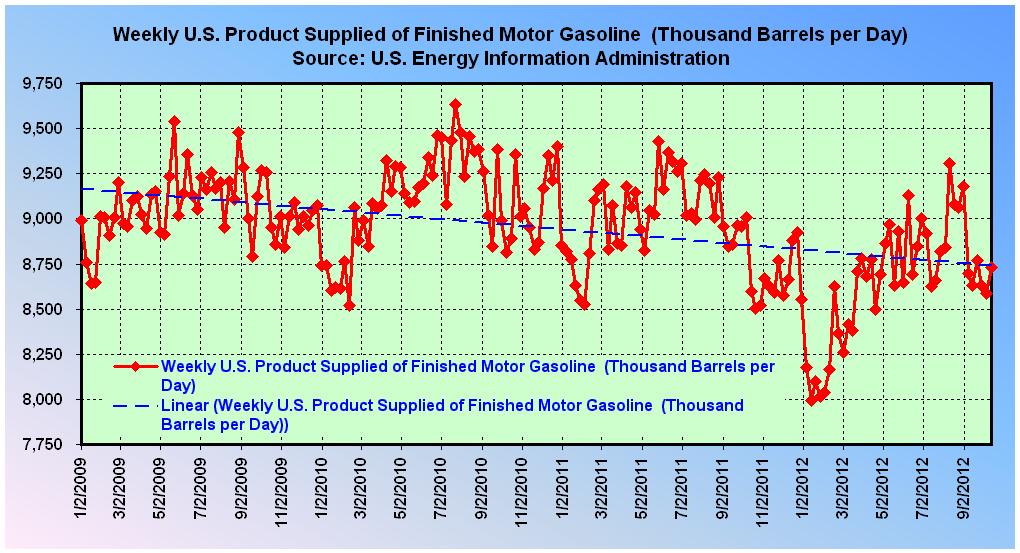
According to information from the U.S. Energy Information Administration, there was a notable rise in U.S. petroleum demand, and a corresponding decline in U.S. supply from 2004 to 2007, as indicated by the shaded area in the chart below. In fact, the phenomenon of rising demand and declining supply actually commenced in 1986.

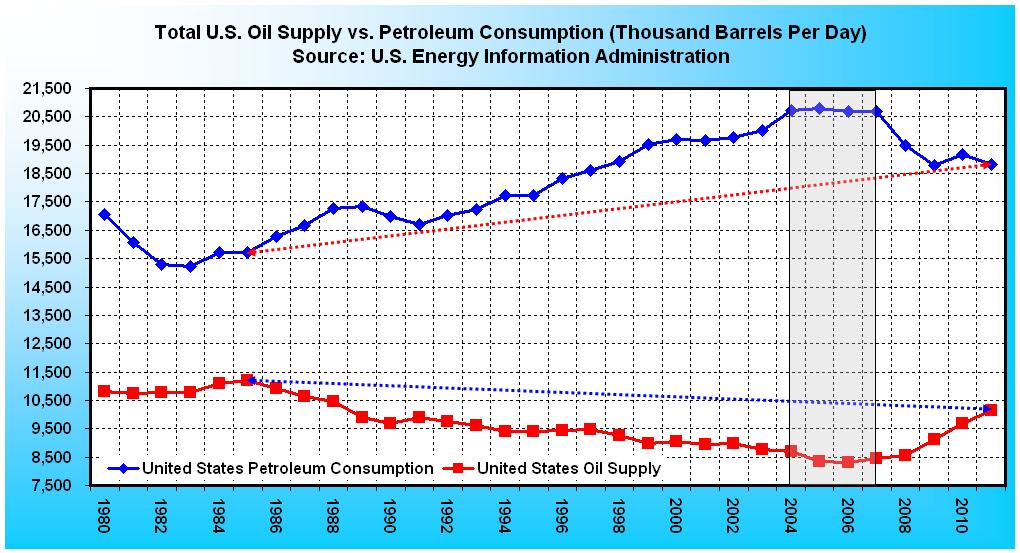
A quick study of the chart leads to two questions. Is the U.S. currently producing more oil than it did in 1985? The answer is no. Is the U.S. consuming more petroleum than it did in 1985? The answer is yes. Yet in 2009 there was a noticeable decline in demand and a corresponding uptick in supply, the combination of which contributed to lower prices at the pump. And, it appears that U.S. oil supply is continuing to trend upward, while demand has leveled off. So since demand is stable and supply is increasing, gasoline prices should be dropping like a rock, but instead we have witnessed a 94.2% price increase since January 20, 2009.

So was Obama right to blame the 94.2% price hike, on what he refers to as the extraordinarily low prices he inherited as a result of an economic depression? No, because by inauguration day the price of gasoline had settled right about where it should have, on an inflation adjusted basis. Recall that in 1992 the price of regular unleaded gasoline was $1.13 per gallon, which would have been equivalent to $1.73 in 2009; and the national average was $1.64 on December 29, 2008, and $1.88 on January 19, 2009. Thus, at that time, the price of gasoline was barely above its inflation adjusted value (see the first chart).

Going back to the original question, the reason prices have risen on Obama’s watch has nothing to do with supply and demand. The root cause is unprecedented government intervention vis-à-vis his $832 billion stimulus plan (see Part II). The stimulus program merely re-inflated a price bubble that existed prior to the recession, the first caused by lack of supply, and the second by devaluation of the dollar. It was this artificial deficit-financed demand that caused gasoline prices to rise from the $1.88 he inherited to $2.64 by the end of the recession, so that by June of 2009, gasoline was only 19% below its pre-recession record of $3.25.

Gasoline would remain below $3.00 from June 2009, until the week ending December 27, 2010. It was during this period that the economy showed its most promising signs of recovery. But ever since then, the price of gasoline has never fallen below $3.00. Instead, in the week ended February 28, 2011 the price once again accelerated past the $3.25 breaking point, where it has remained for the last 86 consecutive weeks.

With regard to 2010 being the end of the Obama recovery, the proof is that Real Gross Domestic Product (GDP) contracted by -3.1% in the year 2009, as gasoline prices surged from $1.64 to $2.62. Then in 2010, GDP grew by 2.4% as prices stabilized and remained below $3.00. But economic growth again slowed to a rate of 1.8% in 2011, as prices climbed above $3.25. GDP further slowed to a growth rate of just 1.3% through the second-quarter 2012, as gas prices remained above $3.25.

Note: The third-quarter 2012 advance estimate that GDP grew by 2.0% is just that, an estimate. In fact, according to the Bureau of Economic Analysis, “the third-quarter advance estimate released today is based on source data that are incomplete or subject to further revision by the source agency. The “second” estimate for the third quarter, based on more complete data, will be released on November 29, 2012.”

Continued: High Gasoline Prices and the 2012 Recession, Part II

Reference:

Weekly U.S. All Grades Conventional Retail Gasoline Prices | U.S. Energy Information Administration

The 2012 Recession: Are We There Yet? | Economic Cycle Research Institute

The Malaise of 2012 | Part IV

Photo Via: Midwest Energy News

Debate 2 | Obama’s Oil & Gas Rhetoric

Forget Fact Checking: Where’s the Logic?
– By: Larry Walker, Jr. –
In a real town hall meeting, the person asking a question gets to follow up. What we saw Tuesday night wasn’t a town hall meeting at all. The readers appeared to be simply mouthing someone else’s prearranged questions. There wasn’t any passion. But what if the public was allowed to retort? Following are my thoughts on the lecture Barack Obama provided in response to the second question, a rather simple one which he has yet to answer.
QUESTION: Your energy secretary, Steven Chu, has now been on record three times stating it’s not policy of his department to help lower gas prices. Do you agree with Secretary Chu that this is not the job of the Energy Department?

OBAMA: The most important thing we can do is to make sure we control our own energy. So here’s what I’ve done since I’ve been president. We have increased oil production to the highest levels in 16 years.
Natural gas production is the highest it’s been in decades. We have seen increases in coal production and coal employment. But what I’ve also said is we can’t just produce traditional source of energy. We’ve also got to look to the future. That’s why we doubled fuel efficiency standards on cars. That means that in the middle of the next decade, any car you buy, you’re going to end up going twice as far on a gallon of gas. That’s why we doubled clean — clean energy production like wind and solar and biofuels.
So by the middle of the next decade, or around the year 2025, if I’m in the new car buying market at the time, I’ll be able to go twice as far on a gallon of gas. But, since a gallon of gas today costs more than twice what it did four years ago, we’re already at net zero. Mr. President, I was talking about today, right now, not 13 years from now or sometime after I’m dead and gone. And what exactly do coal, wind and solar have to do with the price of gasoline? Retail gasoline prices are sitting at a national average of $3.77 a gallon, just $0.33 off the all time high of $4.10 set in July 2008 (see chart above).
And all these things have contributed to us lowering our oil imports to the lowest levels in 16 years. Now, I want to build on that. And that means, yes, we still continue to open up new areas for drilling. We continue to make it a priority for us to go after natural gas. We’ve got potentially 600,000 jobs and 100 years worth of energy right beneath our feet with natural gas.
Oil imports may be at the lowest levels in 16 years, but the gasoline I need to fill up my tank only cost an average of $1.23 a gallon in 1996, which would be equivalent to around $1.81 today, yet I’m paying around $4.00. Is the reason gasoline cost so much today perhaps the result of fewer imports? And as far as natural gas goes, can I fill up my tank with that tomorrow morning?
And we can do it in an environmentally sound way. But we’ve also got to continue to figure out how we have efficiency energy, because ultimately that’s how we’re going to reduce demand and that’s what’s going to keep gas prices lower.

We can drill for oil in an environmentally sound way? What does that mean? And what do you mean by ultimately reducing demand? How far away is that, longer than four years? Although it’s true that less demand can result in lower prices, it only works if supply remains constant or increases. But if both supply and demand are cut at the same time, then consumers won’t realize any price change at all. And if demand declines too rapidly, then many suppliers may be forced out of business. And then what will we do?
[The price P of a product is determined by a balance between production at each price (supply S) and the desires of those with purchasing power at each price (demand D). The diagram shows a positive shift in demand from D1 to D2, resulting in an increase in price (P) and quantity sold (Q) of the product.]
Now, Governor Romney will say he’s got an all-of-the-above plan, but basically his plan is to let the oil companies write the energy policies. So he’s got the oil and gas part, but he doesn’t have the clean energy part. And if we are only thinking about tomorrow or the next day and not thinking about 10 years from now, we’re not going to control our own economic future. Because China, Germany, they’re making these investments. And I’m not going to cede those jobs of the future to those countries. I expect those new energy sources to be built right here in the United States.
Mr. President, I don’t need you to tell me what Governor Romney’s plan is, he can do that himself. The question was: Do you agree with Secretary Chu that it’s not the job of the Energy Department to help lower gas prices? So it seems your answer is that I need to be thinking about 10 years from now, and forget about how I’m going to get to and from work today, tomorrow, next week, or even four years from now. I see. And you’re willing to cede the jobs of the present in hopes that jobs of the future will be based on your present day policies, which for all we know might be considered archaic a month from now.
That’s going to help Jeremy get a job. It’s also going to make sure that you’re not paying as much for gas.
What’s going to help Jeremy get a job, a policy geared to kick in by the middle of the next decade? In the meantime I guess poor Jeremy will have to get by on two or three McJobs, and hope he makes enough to cover the cost of getting to and from work. So is that it? Are you finished?
CROWLEY: Mr. President, let me just see if I can move you to the gist of this question, which is, are we looking at the new normal? I can tell you that tomorrow morning, a lot of people in Hempstead will wake up and fill up and they will find that the price of gas is over $4 a gallon. Is it within the purview of the government to bring those prices down, or are we looking at the new normal?

OBAMA: Candy, there’s no doubt that world demand’s gone up, but our production is going up, and we’re using oil more efficiently. And very little of what Governor Romney just said is true. We’ve opened up public lands. We’re actually drilling more on public lands than in the previous administration and my — the previous president was an oil man.
Wait, so world oil demand and our production are going up? But you just said that our ultimate goal is to reduce demand in order to keep gas prices lower. So if the supply and demand of oil is going up, and you’re drilling more than the last administration, then how is this achieving your goal? And actually very little of what you just said is true. According to the U.S. Energy Information Administration production of finished motor gasoline is trending downward, not up (see chart above). Maybe this is why gasoline prices are hovering near historic highs? After all, we’re not talking about jet fuel and diesel, are we?
And natural gas isn’t just appearing magically. We’re encouraging it and working with the industry.
Can I fill up my car with natural gas tomorrow morning? Because if I could, that would truly be magical.
And when I hear Governor Romney say he’s a big coal guy, I mean, keep in mind, when — Governor, when you were governor of Massachusetts, you stood in front of a coal plant and pointed at it and said, “This plant kills,” and took great pride in shutting it down. And now suddenly you’re a big champion of coal.
Maybe Romney’s a big champion of jobs, unlike you Mr. President. At least he’s got a plan to create 12 million jobs in four years to eliminate the current jobs deficit. Where’s yours?

So what I’ve tried to do is be consistent. With respect to something like coal, we made the largest investment in clean coal technology, to make sure that even as we’re producing more coal, we’re producing it cleaner and smarter. Same thing with oil, same thing with natural gas.
Yeah, consistently wrong. The question wasn’t about coal, clean coal or natural gas, you we’re specifically asked to comment on the Energy Departments role in keeping gasoline prices affordable.
And the proof is our oil imports are down to the lowest levels in 20 years. Oil production is up, natural gas production is up, and, most importantly, we’re also starting to build cars that are more efficient.
So now you’re saying that oil imports are down to the lowest levels in 20 years. A minute ago you said 16 years. Let’s see, so that would be 1992, right? In 1992 the price of regular unleaded gasoline averaged $1.13 per gallon, which would be equivalent to $1.86 today. So if oil production is up, oil imports are down, and they’re building more efficient cars, then why am I still paying close to $4.00 a gallon at the pump?
And that’s creating jobs. That means those cars can be exported, ’cause that’s the demand around the world, and it also means that it’ll save money in your pocketbook.
So by producing more efficient cars, America will someday be able to export them to Libya, Egypt, Iraq, Iran, Greece, Spain and such, and this will create jobs and save money in my pocketbook. Well, that’s interesting, albeit illogical.
First of all, switching over from the production of less efficient to more efficient cars doesn’t add any net jobs, because as new jobs are created, old ones are destroyed. It’s at best a zero sum game, and perhaps even worse looking at the latest green energy failure. The electric-car battery producer, A123 Systems, Inc. filed for bankruptcy just hours ahead of your wishful thought. How many is that? Looks like around 16 so far, see

Obama’s List Of Failed Green Energy Jobs & Companies.

Secondly, as far as saving money in my pocketbook, what’s a pocketbook? It seems that you’re either talking about something way off in the distant future, or the archaic past, but the question pertains to right now, today, within my lifetime.
OBAMA: That’s the strategy you need, an all-of-the-above strategy, and that’s what we’re going to do in the next four years.
No Mr. President, that’s not the strategy I need. What I need is for gasoline prices to drop by at least half of where they are today. So do you agree with Secretary Chu that it’s not the job of the Energy Department to help lower gasoline prices or not? Will gasoline prices be half what they are today if you get reelected, or twice as high? Oh never mind, I’m leaning heavily towards the other guy anyway. I can make sense out of Romney’s policies, but as for yours, the record speaks for itself.
References:

Austerity Matrix

Excerpt from: Krugman’s Anti-Austerity Madness

– By: Larry Walker, Jr. –

In economics, austerity refers to a policy of deficit-cutting by lowering spending via a reduction in the amount of benefits and public services provided. Austerity policies are often used by governments to try to reduce their deficit spending and are sometimes coupled with increases in taxes to demonstrate long-term fiscal solvency to creditors. However, austerity policies don’t have to include tax hikes, and in fact as we shall see the optimal austerity policy actually involves a combination tax cuts paired with deficit reduction.

The key phrase above is “to demonstrate long-term fiscal solvency to creditors”. If there were no creditors, then politicians and government officials wouldn’t have to worry about austerity. If there were no creditors, nations could simply print their own currencies on an unlimited basis, and spend without consequence. But in the real world, since creditors exist, some measure of austerity is required no matter what emotions dictate. Besides, history itself teaches us that printing money without restraint is the surest path to the vicious spiral of hyperinflation, a large increase in the money supply not supported by gross domestic product (GDP) growth, which leads to rapid erosion of a nation’s currency and ultimately to ever more pain.

In the table below, I have summarized all the possible fiscal austerity combinations available to the United States and Europe. When viewed graphically the optimal policy choice should be clear.

Although many Americans, including the President, think the way forward should involve some combination of spending cuts and tax hikes, credit ratings agencies disagree. For example, according to Fitch Ratings Co., “Fiscal Indecision Threatens US ‘AAA’ – Under current law, tax increases and spending cuts equivalent to about 5% of GDP will take effect in 2013 – if permanent, such a “fiscal cliff” could derail the US economic recovery…” Yet it’s not the spending cuts that are problematic, deficit reduction is a must, but rather the combination of tax hikes and spending cuts.

Following the Austerity Matrix, it turns out that:

  1. Tax hikes lead to the fiscal cliff no matter what happens with spending. Why? Because tax hikes lead to private sector austerity, resulting in job and benefit cuts, which leads to lower tax revenues and less economic output. So tax hikes should be off the table. The only reason they’re still being discussed in the United States is because of Obama’s “fairness doctrine”, which if you ask me is total nonsense. Besides, raising taxes on 1% of taxpayers won’t change anything for the other 99%, where the main problem is the lack of opportunities.

  2. Maintaining current tax rates can work, but only in conjunction with spending cuts. However, this only leads to slow growth, which is basically what we have now. Our current real gross domestic product (GDP) annual growth rate of 1.3% is not enough to change the trajectory of our ever increasing jobs deficit. If tax rates are maintained while spending levels are maintained or raised, we still wind up plunging over the fiscal cliff.

  3. The optimal fiscal austerity policy involves a combination of tax cuts and deficit reduction, which leads to rapid growth, or exactly what is needed following an economic crash. But, cutting taxes while maintaining or increasing spending levels only hurtles us over the fiscal cliff.

So there is only one viable fiscal austerity alternative: Cut taxes and reduce government spending. But this always brings up the same old moth-eaten question from faithless do nothings. How will you pay for the tax cuts? The apparently not so obvious answer is — with jobs.

Did you get that? Cutting tax rates across the board, which incidentally is included in the Romney-Ryan Plan, is not a way of giving anyone anything, since the government is merely enabling everyone to keep more of their own money. The dirty little secret is that this is how you grow an economy. When the government confiscates less money from the private sector, the economy eventually finds its footings and will dig its own way out of any hole. I challenge anyone to show me when this form of austerity has ever been implemented and failed to deliver greater revenues and higher levels of economic growth.

At this point you’re probably thinking, “Well, Bill Clinton raised taxes and cut spending and everything was copacetic.” But according to history, that’s actually incorrect. Although it’s true that President Clinton raised taxes during his first term, government spending also increased, that is until 1995 when his Democratic party lost control of both Houses of Congress.

It was actually during his second term when the austerity policy I’m talking about took place. That’s when Republicans passed the Taxpayer Relief Act of 1997, a reconciliation bill that reduced taxes and hence increased the deficit, paired with the Balanced Budget Act of 1997 (H.R. 2014 and H.R. 2015 respectively), each signed by President Clinton. Thus, it was actually tax cuts in conjunction with deficit reduction which produced the boom of the 1990’s, not the Clinton tax hikes.

The only differences between 1997 and today are that the United States wasn’t teetering on the edge of a fiscal cliff, and Republicans don’t currently control both Houses of Congress, but the solution to greater revenues, less spending and higher economic growth is the same.

Photo Credit:

Covertress | From Riches to Rags: Inflation & Poverty in Zimbabwe

U.S. Jobs Deficit Improves by 1,000 in September

Measuring Relevance

:: The U.S. Jobs Deficit declined by 73,000 in September, however since it increased by 72,000 just one month prior, the result was a net improvement of an entire 1,000 jobs since July.

– By: Larry Walker, Jr. –

The ever elusive jobs deficit rose from 11,760,000 in July to 11,832,000 in August, and then pulled back to 11,759,000 based on yesterday’s Employment Situation Report. Employers added 114,000 jobs for the month, while the July and August figures were revised upward by 86,000. Thus, the U.S. realized a net gain of an even 200,000 Nonfarm jobs in September. And, since the U.S. needs to create a minimum of 127,000 jobs a month solely to keep pace with population growth; this results in an overall improvement to the jobs deficit of 73,000, as compared to the prior report. However, since the deficit increased by 72,000 in August, it really amounts to a net improvement of a mere 1,000 jobs since July.

Here’s the big picture. Today 12,088,000 Americans are officially unemployed (down from 12,544,000 in August). Another 6,427,000 are unemployed and want jobs, but have dropped out of the labor force and are not officially counted (down from 7,031,000 in August). Still another 8,613,000 are employed part-time for economic reasons (up from 8,031,000 in August). What this means is that 27,128,000 American’s are still unemployed or underemployed, an amount essentially unchanged since August. The truth is that if Barack Obama’s trickle-down-government approach had worked, then the jobs deficit wouldn’t be worse today than it was in December 2009, when it registered in at 11,479,000, yet it is.

In light of September’s minuscule improvement, how many jobs must now be created each month in order to reach full-employment? How long will this take? And, in light of the answer, is another four years of Obamanomics the cure? But first here’s a quick synopsis.

Synopsis

What is the jobs deficit? — It’s a measure of how far the United States has strayed from full-employment during the current economic recovery. More specifically, it tracks the shortfall in the number of jobs needed to keep up with population growth, and to recover those lost since the Great Recession.

Basically, the U.S. has needed to add 127,000 jobs a month since December 2007, the month the recession commenced, simply to keep up with population growth. Thus, a minimum of 7,366,000 new jobs have been needed since the recession began (58 months times 127,000). However, instead of adding jobs, the U.S. has instead lost 4,393,000 (see related table). So since we needed to add a minimum of 7,366,000, but instead lost 4,393,000, the sum of the two equals the current jobs deficit of 11,759,000 (see chart above). Got it?

Who initiated the benchmark, some right-wing economist? — No. The idea was actually initiated by Economist Paul Krugman. Here’s a quote from his December 2009 column: “Even if we add 300,000 jobs a month, we’re looking at a prolonged period of suffering — a huge cost from the Great Recession. So that’s kind of a minimal definition of success. Anything less than that, and it’s bad news.” But sadly, since December 2009, the U.S. has only averaged about 127,000 jobs a month. So in other words, we’ve basically been treading water since the measure was first established. For more, see Paul Krugman’s New York Times opinion piece entitled, The Jobs Deficit.

Updated Jobs Benchmark

Updating Mr. Krugman’s benchmark with the latest figures, we discover that to be meaningful, the number of jobs needed to return to more or less full employment by December of 2014 (the original target date), or within the next 27 months, is now 562,518 jobs a month, as follows:

In order to keep up with population growth, we would need to create 127,000 jobs times 27 months, or 3,429,000. Add in the need to make up for the jobs deficit and we’re at around 15,188,000 (3,429,000 + 11,759,000) over the next 27 months — or 562,518 jobs a month.

Since this isn’t going to happen under the evanescent policies of Barack Obama, we might as well extend the time frame. But, even if we extend the target date to 5 years from today, which will be more than 8 years from the time the recession ended, then the number of jobs needed to return to more or less full employment by September of 2017, or within the next 60 months, is now 322,983 jobs a month, as follows:

In order to keep up with population growth, we would need to create 127,000 jobs times 60 months, or 7,620,000. Add in the need to make up for the jobs deficit and we’re at around 19,379,000 (7,620,000 + 11,759,000) over the next 60 months — or 322,983 jobs a month.

Did the U.S. add 562,518 jobs last month? Nope. In fact we haven’t come anywhere close during the entire Obama recovery. Did U.S. employers add 324,200 jobs last month? Nope. We haven’t even come close to that, with the exception of the single month of May 2010, but those were just temporary Census jobs which disappeared in subsequent months.

Le Coup de Grâce

When averaged, the number of Nonfarm jobs created since the end of January of 2009 comes to a loss of -20,000 jobs a month. Well, that doesn’t work. So if we average the number of jobs created over the last 9 months, we arrive at 146,000 a month. That’s better. And when we divide this into the 4,393,000 jobs lost since the recession began, it tells us that at the current pace we should recover the jobs lost to the recession in another 30 months, or 2.5 years. That’s fantastic! It means it will only have taken 6.5 years to get back to square one!

The only problem with this less than rosy scenario is that since we still need to create a minimum of 127,000 jobs a month, in order to keep up with population growth, based on the 9-month average, the jobs deficit is only declining by 19,000 jobs a month (146,000 – 127,000). Thus, full-employment is more like 619 months away, or another 52 years. So four more years of the trickle-down-government approach places us on track to reach full-employment by around the year 2064. Huh? Sorry Democrats but, we can’t wait.

No matter how you spin the numbers, they aren’t good. Until we see the number of Nonfarm jobs expanding by a minimum of 322,983 a month, for a sustained period of at least five years, anything short is just bad news. The addition of 114,000 jobs in September was 65% short of the mark required to reach the long-term target. And with the national debt hovering above $16 trillion, and beginning its ascent towards $20 trillion, there’s really no good reason to consider a second Obama term. None!

The Obama-Biden program establishes a goal of creating 1,000,000 new manufacturing jobs over the next four years, which would be an improvement, considering their policies have thus far resulted in a loss of 610,000, since January 2009. But that only accounts for a potential of 250,000 jobs per year, or around 21,000 a month. What about the other 300,000 jobs?

In stark contrast, the Romney-Ryan Plan includes a goal of creating more than 12,000,000 jobs over the next four years, or more than 250,000 a month. So which plan is most likely in the best interests of the United States? The one we’ve already witnessed for the last four years, or something different? Vote Romney-Ryan for real change. Hey, it’s math! It’s arithmetic! It’s all about relevance! You can’t fool the jobs deficit.

“You can fool some of the people all of the time, and all of the people some of the time, but you can not fool all of the people all of the time.” ~ Abraham Lincoln

Data: Worksheet on Google Drive

Photo Credit: Direct Relevance | University of Miami, Department of Computer Science

Krugman’s Anti-Austerity Madness

Kicking Common Sense Down the Road

– By: Larry Walker, Jr. –

When one of today’s most brilliant liberal economists recently mentioned the European fiscal crisis, he said, “Spain is suffering the hangover from a huge housing bubble, which caused both an economic boom and a period of inflation that left Spanish industry uncompetitive with the rest of Europe. When the bubble burst, Spain was left with the difficult problem of regaining competitiveness, a painful process that will take years.”

Yet, when far less knowledgeable left-wingers, including the President, speak of America’s economic woes, they routinely regurgitate the meaningless thread, “We are suffering from 8 years of failed Bush policies.” But what does that mean? Aside from a flawed monetary policy which bails out cronies while treading on everyone else, and an out of control government which has become accustomed to borrowing and spending 50% more than its revenue, are we not also suffering the hangover from a huge housing bubble, which caused both an economic boom and a period of inflation that has left us uncompetitive with the rest of the world?

If it were possible for left and right to agree on our most pressing problems, perhaps we would have a chance of solving them, but when one ideology slovenly blames everything on the sum total of one man’s policies without distinguishing between what works and what doesn’t, we are condemned to the same infinite loop occurring in Europe. The only difference being that their fate ends with austerity, while ours ends with a plunge into a hyperinflationary abyss.

When referring to Europe’s current morass, economist Paul Krugman says, “But the truth is that the protesters are right. More austerity serves no useful purpose; the truly irrational players here are the allegedly serious politicians and officials demanding ever more pain.” Wait, austerity serves no useful purpose? It sounds like Mr. Krugman is saying that the protestors, fire bombers, and destroyers of personal property are the rational players, while serious politicians and officials seeking austerity are among the irrational. So what is austerity, and why would anyone in their right mind side with the protestors while deeming such measures irrational?

Austerity

In economics, austerity refers to a policy of deficit-cutting by lowering spending via a reduction in the amount of benefits and public services provided. Austerity policies are often used by governments to try to reduce their deficit spending and are sometimes coupled with increases in taxes to demonstrate long-term fiscal solvency to creditors. However, austerity policies don’t have to include tax hikes, and in fact as we shall see the optimal austerity policy actually involves a combination tax cuts paired with deficit reduction.

The key phrase above is “to demonstrate long-term fiscal solvency to creditors”. If there were no creditors, then politicians and government officials wouldn’t have to worry about austerity. If there were no creditors, nations could simply print their own currencies on an unlimited basis, and spend without consequence. But in the real world, since creditors exist, some measure of austerity is required no matter what emotions dictate. Besides, history itself teaches us that printing money without restraint is the surest path to the vicious spiral of hyperinflation, a large increase in the money supply not supported by gross domestic product (GDP) growth, which leads to rapid erosion of a nation’s currency and ultimately to ever more pain.

In the table below, I have summarized all the possible fiscal austerity combinations available to the United States and Europe. When viewed graphically the optimal policy choice should be clear. Although many Americans, including the President, think the way forward should involve some combination of spending cuts and tax hikes, credit ratings agencies disagree. For example, according to Fitch Ratings Co., “Fiscal Indecision Threatens US ‘AAA’ – Under current law, tax increases and spending cuts equivalent to about 5% of GDP will take effect in 2013 – if permanent, such a “fiscal cliff” could derail the US economic recovery…” Yet it’s not the spending cuts that are problematic, deficit reduction is a must, but rather the combination of tax hikes and spending cuts.

Following the Austerity Matrix, it turns out that:

  1. Tax hikes lead to the fiscal cliff no matter what happens with spending. Why? Because tax hikes lead to private sector austerity, resulting in job and benefit cuts, which leads to lower tax revenues and less economic output. So tax hikes should be off the table. The only reason they’re still being discussed in the United States is because of Obama’s “fairness doctrine”, which if you ask me is total nonsense. Besides, raising taxes on 1% of taxpayers won’t change anything for the other 99%, where the main problem is the lack of opportunities.

  2. Maintaining current tax rates can work, but only in conjunction with spending cuts. However, this only leads to slow growth, which is basically what we have now. Our current real gross domestic product (GDP) annual growth rate of 1.3% is not enough to change the trajectory of our ever increasing jobs deficit. If tax rates are maintained while spending levels are maintained or raised, we still wind up plunging over the fiscal cliff.

  3. The optimal fiscal austerity policy involves a combination of tax cuts and deficit reduction, which leads to rapid growth, or exactly what is needed following an economic crash. But, cutting taxes while maintaining or increasing spending levels only hurtles us over the fiscal cliff.

So there is only one viable fiscal austerity alternative: Cut taxes and reduce government spending. But this always brings up the same old moth-eaten question from faithless do nothings. How will you pay for the tax cuts? The apparently not so obvious answer is — with jobs.

Did you get that? Cutting tax rates across the board, which incidentally is included in the Romney-Ryan Plan, is not a way of giving anyone anything, since the government is merely enabling everyone to keep more of their own money. The dirty little secret is that this is how you grow an economy. When the government confiscates less money from the private sector, the economy eventually finds its footings and will dig its own way out of any hole. I challenge anyone to show me when this form of austerity has ever been implemented and failed to deliver greater revenues and higher levels of economic growth.

Because strait is the gate, and narrow is the way, which leads to life, and few there be that find it. ~ Matthew 7:14

At this point you’re probably thinking, “Well, Bill Clinton raised taxes and cut spending and everything was copacetic.” But according to history, that’s actually incorrect. Although it’s true that President Clinton raised taxes during his first term, government spending also increased, that is until 1995 when his Democratic party lost control of both Houses of Congress. It was actually during his second term when the austerity policy I’m talking about took place. That’s when Republicans passed the Taxpayer Relief Act of 1997, a reconciliation bill that reduced taxes and hence increased the deficit, paired with the Balanced Budget Act of 1997 (H.R. 2014 and H.R. 2015 respectively), each signed by President Clinton. Thus, it was actually tax cuts in conjunction with deficit reduction which produced the boom of the 1990’s, not the Clinton tax hikes.

The only differences between 1997 and today are that the United States wasn’t teetering on the edge of a fiscal cliff in the late 1990’s, and Republicans don’t currently control both Houses of Congress, but the solution to greater revenues, less spending and higher economic growth is the same.

Sophism

Austerity measures are the only way to avoid the bitter lessons of the Weimar Republic, and Zimbabwe. In this sense, serious politicians and government officials recommending the correct form of austerity, a combination of tax cuts and deficit reduction, are among the World’s most rational. But where are they? I actually agree with Mr. Krugman when he infers that the brand of austerity being practiced in Spain, tax hikes in conjunction with spending cuts, is detrimental, but that’s only one of nine possible fiscal austerity combinations, and as shown above — it’s one that doesn’t work. But, although Mr. Krugman has rightly identified the problem, his solution — printing money, and continuing to borrow and spend — is even more irrational.

Not all austerity programs are bad. Tax cuts paired with deficit reduction is the only austerity plan that works, and the only one any nation will ever need. Egging on protestors and attempting to create rifts between Germans and Spaniards solves nothing, nor does begging creditors to pour billions of dollars into a bottomless pit. Thus madmen like Mr. Krugman and those swigging from the same jar of Kool-Aid may be viewed as nothing more than facetious enablers of irrational whiners, crybabies and in some cases common criminals.

On June 7, 2012, Fitch Ratings downgraded Spain’s credit rating by three notches from A to BBB, or to just above junk bond status. So Spain skipped A (-), BBB (+) and sank straight to BBB with a negative outlook. This means that its borrowing costs went up, as investors demand higher and higher interest rates to compensate for the increased risk of default. It also means that fewer and fewer investors are inclined to funnel their savings into such improvidence, at least not until they see the fruits of a serious and meaningful austerity plan.

In the meantime, Spain’s loan delinquencies as a percentage of all loans continues to spike, its housing prices continue to deteriorate adding to the spike in loan delinquencies, and its unemployment remains at 24.63% further adding to its woes and the stressed loan market. If Spain follows the advice of Mr. Krugman, and rejects some form of austerity, it will continue on the course of a fourth-rate, junk bond servant, destined to borrow more and more simply to cover its debt service until it is eventually toppled by an adversary, plunges back into the Stone Ages, or otherwise succumbs to extinction.

Wrap

On September 14, 2012, Egan-Jones Ratings Co. downgraded its United States sovereign rating to AA (-) from AA on concerns that the Fed’s new round of quantitative easing, or QE3, will hurt the U.S. economy. In a note, the ratings agency said, “From 2006 to present, the US’s debt to GDP rose from 66% to 104% and will probably rise to 110% a year from today under current circumstances; the annual budget deficit is 8%. In comparison, Spain has a debt to GDP of 68.5% and an annual budget deficit of 8.5%.”

Technically, the United States is worse off than Spain; the only consolation being a lower unemployment rate. But then again we don’t count all of our unemployed. In the United States persons are classified as unemployed if they do not have a job, have actively looked for work in the prior 4 weeks, and are currently available for work. Thus, when someone is unemployed but wants to work, if they have not looked for work in the last 4 weeks they are no longer counted (i.e. not in labor force). In fact, according to the Bureau of Labor Statistics – Table A-16, a total of 7,018,000 working age persons have dropped out of the labor force since January of 2009. If they were counted, the number of unemployed would be 19,562,000, and the official unemployment rate would be 12.1% (19,562,000 / 161,663,000).

From my perspective, despite all of the distractions, the Romney-Ryan ticket is more serious about tackling the nation’s deteriorating debt and employment trajectories, than the Obama-Biden road show, which continues to make promises it knows it can’t deliver. Obama-Biden had a fair shot and only made our fiscal situation worse than it was four years ago. It was on Obama’s watch that, the United States sovereign credit rating was downgraded for the first time in history (with a negative outlook). Although not every ratings agency participated in the downgrade, those that haven’t are simply waiting for the outcome of the November elections.

What should be clear is that another four years of irrational fiscal policies won’t make things better. There are only so many combinations of fiscal austerity measures, and only one leads to rapid economic growth. The Romney-Ryan Plan, which involves a combination of across-the-board tax cuts paired with deficit reduction fits the bill. In contrast, the Obama-Biden script, which by law is already fixed on a Grecian-Spaniard style combination of tax hikes and spending cuts doesn’t. Vote Romney-Ryan for serious-minded fiscal leadership, or vote Obama-Biden for irrational, Weimarian, sophistic, subordination.

References:

Paul Krugman: Europe’s Austerity MadnessHere’s why the protesters in Spain and Greece are right that inflicting more and more pain serves no useful purpose.

Anthony B. Sanders: Spain’s Loan Delinquency Spike as House Prices, Unemployment Continue to Deteriorate

Photo Credit:

Mount Holyoke College – The Weimar Republic and Revolt 1918-23The photograph shows children playing with bundles of worthless money.

From AAA to AA- in Four Years

The New National Curse

– By: Larry Walker, Jr. –

In the year 2009 double-dealing returned to Washington, DC. Shortly after his inauguration, President Barack Obama pledged to cut the nation’s annual budget deficit in half by the end of his first term. At the time, he identified exploding health-care costs as the chief culprit behind rising federal deficits. He warned that the country could not continue its current rate of deficit spending without facing dire economic consequences. He said, “I refuse to leave our children with a debt they cannot repay. … We cannot and will not sustain deficits like these without end. … We cannot simply spend as we please.” Yet within four short years, the USA’s sovereign credit rating has been downgraded three times, from AAA to AA(+) on August 5, 2011, to AA on April 15, 2012, and again to AA(-) on September 14, 2012.

Talk is cheap. By September 20, 2012, after 44 month’s of empty words, health care costs have continued to rise. Having risen by 3.9% in 2010, health care costs are expected to rise by another 7.5% in 2013, or more than three times the projected rates for inflation and economic growth. As if this wasn’t bad enough, the national debt has exploded by $5,387,546,974,859 in the last 44 months, resulting in an average annual increase of $1.5 trillion, versus an average of $612.4 billion during the presidency of George W. Bush (see chart below). And there are still four month’s to count until inauguration day.

National Debt: The National Curse

“I am one of those who do not believe that a national debt is a national blessing, but rather a curse to a republic; inasmuch as it is calculated to raise around the administration a moneyed aristocracy dangerous to the liberties of the country.”Andrew Jackson

On Jan. 8, 1835, all the big political names in Washington gathered to celebrate what Democratic President Andrew Jackson had just accomplished. The national debt had been paid. It was the only time in history when the U.S. was debt free, and it lasted exactly one year. Back then like today, it wasn’t easy for politicians to slash spending — that is until Andrew Jackson came along.

During the election of 1828, Jackson’s opponents referred to him as a “jackass”. Jackson liked the name and used the jackass as a symbol for a while, but it died out. However, it later became the symbol for the Democratic Party when cartoonist Thomas Nast popularized it. But based upon the growth of the national debt over the past 44 months, the symbol no longer fits, or does it?

“For Andrew Jackson, politics was very personal,” says H.W. Brands, an Andrew Jackson biographer at the University of Texas. “He hated not just the federal debt. He hated debt at all.” Before he was president, Jackson was a land speculator in Tennessee. He learned to hate debt when a land deal went bad and left him with massive debt and some worthless paper notes. Ah, so unlike Barack Obama, Andrew Jackson brought some practical business experience to the White House, just like Mitt Romney will.

When Jackson ran for president, he knew his enemy: banks and the national debt. He called it the national curse. People ate it up. In Jackson’s mind, debt was “a moral failing,” Brands says. “And the idea you could somehow acquire stuff through debt almost seemed like black magic.” Yet if you listen closely to today’s Democratic Party, the national debt is no longer its enemy, but rather the anti-debt, fiscally responsible Tea Party.

Andrew Jackson pledged to pay off the debt. In order to do so, he took advantage of a huge real-estate bubble that was raging in the Western U.S. The federal government owned a lot of Western land — so Jackson started selling it off. He was also ruthless on the budget. He blocked every spending bill he could. “He vetoed, for example, programs to build national highways,” Brands says. “He considered these to be unconstitutional in the first place, but bad policy in the second place.” But nowadays, we hear repeatedly from Barack Obama stuff like, “The House should put aside partisan posturing and pass the measure authorizing $109 billion in spending over two years. So much of America needs to be rebuilt right now. We’ve got crumbling roads and bridges…” In other words, forget about the credit downgrade, borrow and spend now, pay later.

When Jackson took office in 1829, the national debt was about $58 million. Six years later, it was paid in full, and the government was running a surplus. This created a new problem: What to do with all that surplus money? So Jackson decided to divide it among the states. By the way, the phrase “the government was running a surplus” doesn’t mean the same thing as Bill Clinton’s four consecutive annual budget surpluses. Although that was a step in the right direction, the national debt was still over $5.7 trillion when he left office.

Andrew Jackson was a stand up guy, he fulfilled his pledge. But unfortunately, the debt would only remain at zero for one year. By January 20, 2001, the national debt had grown to $5,727,776,738,305. From the time Andrew “Jackass” Jackson paid it off, until the inauguration of Republican President George W. Bush, the national debt grew at an annual average of $34.7 billion over the ensuing 165 years.

Forward: To Insolvency

In the year 2000, George W. Bush was elected on a pledge to cut income taxes. By the end of his term, the national debt had grown by another $4.9 trillion — to $10.6 trillion or at an annual average of $612.4 billion over 8 years. Although in retrospect, most of the Republican Party finds his fiscal record detestable, it is notable that Bush never once pledged to pay down the national debt or cut the federal deficit. In fact the federal government was running at a slight surplus at the time of his election, so the federal budget wasn’t an election year issue. Nevertheless, the USA’s sovereign credit rating remained intact at AAA throughout both of his terms, and its debt-to-GDP ratio averaged around 62.4%.

Finally in the year 2008, under the banner of Hope and Change, along came Barack H. Obama, portending to be all things to everybody. After making a solemn promise to cut the federal deficit in half by the end of his first term, many thought he represented the second coming of old Jackass himself. But instead, from the time of his inauguration the national debt has grown by an additional $5.4 trillion, not only exceeding the Bush presidency, but in double-time. That’s a fact! The national debt now stands at just over $16.0 trillion, having grown at an annual average of $1.5 trillion over the last 4 years. To top it off, the U.S. sovereign credit rating has been downgraded three times on his watch, from AAA to AA(+) on August 5, 2011, to AA on April 15, 2012, and again to AA(-) on September 14, 2012. Meanwhile, the U.S. debt-to-GDP ratio has risen to 104% and is projected to reach 110% a year from today.

Conclusion

As Andrew Jackson put it, the national debt is “the national curse.” In the first 165 years after the debt was paid off in 1835, it rose by an average of $34.7 billion per year. And although it would increase by an average of $612.4 billion over the next eight years, during President Bush’s term, that doesn’t excuse President Obama. Besides, how can we hold Bush accountable for something he never pledged to do? Nonetheless, Barack Obama is on the ballot this year, not Bush. And he pledged to cut the deficit in half during his first term, but it has instead doubled. Your word is your bond.

You might be thinking, “So what? We can’t afford to go back to the failed policies of George W. Bush, because that’s what caused health care costs to spiral out of control, and that’s the reason the debt was so high to begin with.” Yeah, like that makes sense. Stop listening to far-left lies and think for yourself. As a consequence of Barack Obama’s shortsightedness, the USA’s sovereign credit rating has been downgraded three times, from AAA to AA(+) on August 5, 2011, to AA on April 15, 2012, and again to AA(-) on September 14, 2012. Another downgrade or two and U.S. backed securities will no longer be suitable for many bond investors. And what happens when there are more sellers of U.S. backed debt than buyers? Interest rates will skyrocket. And what happens when interest rates rise? Everyone’s borrowing costs will increase, as will the USA’s annual budget deficits.

Now it’s election time, and thus time to decide. Who’s to blame for Obama’s improvidence, Bush, the Republican Party, the Tea Party, or perhaps simply Obama himself? Well, allow me to spell out the American way. If you make a pledge and fail to deliver, there’s no one to blame but yourself. Not only did Obama fail to cut the deficit in half by the end of his first term, but the USA’s annual deficits have more than doubled, and its credit reputation has been trashed. Barack Obama has cursed the nation, and now is the time to cut his career short. And here’s my pledge, if we elect Mitt Romney and he screws up, I will personally help to expel the bum four years from now. But just for today, the ‘jackass’ in chief has got to go.

_____________________________________________________________

Addendum: Ratings History

Egan-Jones rating history for United States Government:

  • 9/14/2012 AA to AA(-)

  • 4/15/2012 AA(+) to AA (Negative outlook)

  • 7/16/2011 AAA to AA(+)

Standard & Poor’s rating history for the United States Government:

  • 08/05/2011 AAA to AA(+) (Negative outlook)

_____________________________________________________________

Photo Credit Via: Greetings Jackass

Labor Force Stagnation Concealed by Obama

25 More Terms

– By: Larry Walker, Jr. –

Forget about four more years. Based on the USA’s current trajectory, it would take another 25 terms, or 98 years, for Barack Obama’s bizarre economic policies to restore the U.S. Labor Force to where it should be in the next four years, when compared to the growth rates achieved under the policies of George W. Bush. And then once that’s been achieved, based on the trajectory of the USA’s 11,832,000 Jobs Deficit, it will take something on the order of infinity to reach full-employment. So what’s the point of another Obama term, to fundamentally destroy the Global economy?

Earlier this month micro-journalists were roused over the fact that 368,000 additional workers dropped out of the labor force during the month of August. For the first time many were awakened to the fact that this was the only reason the official unemployment rate declined from 8.3% to 8.1%, but that’s about as far as they ventured. A handful went on to extrapolate that the real unemployment rate is actually 11.2% when based on the same labor force participation rate in place when Obama entered office, but hindsight is 20/20. A more substantive analysis would involve utilizing this information in order to project where we are headed.

Backwards

Last Friday, Egan-Jones Ratings Co. downgraded its U.S. sovereign rating to AA- from AA on concerns that the Fed’s new round of quantitative easing, or QE3, will hurt the U.S. economy. The ratings agency said the Fed’s plan of buying $40 billion in mortgage-backed securities a month and keeping interest rates near zero does little to raise GDP, reduces the value of the dollar, and raises the price of commodities. In a note Egan-Jones said, “From 2006 to present, the US’s debt to GDP rose from 66% to 104% and will probably rise to 110% a year from today under current circumstances; the annual budget deficit is 8%. In comparison, Spain has a debt to GDP of 68.5% and an annual budget deficit of 8.5%.”

Topping this, according to the Economic Cycle Research Institute, the federal government’s release of overstated preliminary data is obscuring real-time evidence of recession. For example, the Obama Administration is purposefully overstating preliminary labor statistics in order to give a boost to his re-election bid, but this is a dangerous practice, because by the time economists are able to determine that we are in recession, it will be too late to issue a warning. In contrast, under the Bush Administration preliminary statistics were typically understated, and thus we had warning several month’s prior to the Great Recession.

Based on the August Employment Situation Report, the economy added a mere 96,000 jobs, while June and July’s numbers were revised downward by 41,000. Thus, the U.S. realized a net gain of just 55,000 Nonfarm jobs in the month of August. But micro-journalists ran with the 96,000 figure, basically ignoring a history of 42 consecutive months of subsequent downward revisions, as though this figure won’t also be revised downward next month. Nevertheless, since the economy needs to create 127,000 jobs a month just to keep up with population growth, the result led to an increase in the jobs deficit, which currently stands at 11,832,000.

As outlined in the last post, U.S. Jobs Deficit Increases by 72,000 in August, to be meaningful, the number of jobs needed to return to more or less full employment by December 2014, or within the next 28 months, is now 549,571 jobs a month. And even if we extend the target date to 5 years from today, which will be more than 8 years from the time the recession ended, the number of jobs needed to return to more or less full employment by August 2017, or within the next 60 months, is now 324,200 jobs a month. So even though micro-journalists ignored the fact that only 55,000 jobs were added in August, and instead sought to convince the public that 96,000 were added, it really doesn’t matter. What should be made clear is the point that we will never reach full-employment at the current trajectory.

Labor Force Stagnation

According the Bureau of Labor Statistics, the labor force grew by 10,436,000 during George W. Bush’s term, which encompassed two recessions (see chart below). During the first recession, which lasted from March 2001 to November 2001, the labor force grew by 539,000. And even during the first 13 months of the Great Recession (end of the Bush term), from December 2007 through January 2009, the labor force continued to expand by 401,000. In contrast, during Barack Obama’s full term to-date, the labor force has grown by a mere 409,000. In other words during Obama’s entire term the labor force has grown at a recession pace.

Even worse, the Great Recession ended in June 2009, yet from July 2009 to August 2012 the labor force actually shrank by 85,000. This means that, under the policies of Barack Obama, the U.S. labor force has performed worse than during the most recent recessions – way worse. Thus, the economy is not growing, it’s shrinking. So what about that?

  • Labor Force Growth During Bush Term (+)10,436,000

  • Annual Labor Force Growth Rate During Bush Term 0.907%

  • Labor Force Growth During Obama Term (+)409,000

  • Annual Labor Force Growth Rate During Obama Term 0.076%

  • Labor Force Contraction Since June 2009 (-)85,000

The Labor Force grew at an annual rate of 0.907% during both Bush terms, which is close to the rate of population growth, while annual growth has been almost immeasurable during Obama’s term, at just 0.076%. So what does this mean? It means that under Barack Obama’s trickle-down-government, borrow-and-spend economic policies, and based on the USA’s current trajectory, it will take approximately 25 more terms (98.1 years) for the labor force to grow to where it should be in the next four years. So perhaps instead of crying “four more years,” Obama loyalists should be shouting “98 more years,” because four more just won’t cut it.

Aside from the Constitution, the only other problem with anointing Barack Obama as our first Dictator is that even if all 7,031,000 Americans who have dropped out of the labor force during his term, those who still want jobs now, suddenly decided to return to the labor market, there’s no guarantee they would find work, because of the Jobs Deficit which currently stands at 11,832,000. In fact, based on the USA’s current trajectory, it will take something on the order of infinity to reach full-employment. Thus, hardcore Obama loyalists might as well be shouting, “Obama forever”.

But fortunately, most of us don’t have forever to wait, which is precisely why we need to end this ridiculous charade right now. There’s only one Plan on the ballot this November, and only one man capable of turning things around. And by turning things around, no, I don’t mean going back to the same policies which caused the last recession. That would be lame. I mean returning our government to some semblance of honesty and integrity. A POTUS who ignores his own jobs council, and then inundates the nation with lies and distortions, while concealing the truth about the economy, isn’t a problem solver; he is the problem of our day, the present, right now, today.

The first step in repairing the Republic is to vote this deceiver out of office. The second step involves hiring a turnaround guy, someone who doesn’t know how to fail, and then trusting in God to help him get us back on the right track.

Data: Worksheet on Google Drive

U.S. Jobs Deficit Increases by 72,000 in August

Obama’s Cure – More Jokes

– By: Larry Walker, Jr. –

The U.S. Jobs Deficit increased by 72,000 in August, rising from a deficit of 11,760,000 in July to 11,832,000, based on Friday’s Employment Situation Report. The economy added a mere 96,000 jobs in August, while June and July’s numbers were revised downward by 41,000. Thus, the U.S. realized a net gain of 55,000 Nonfarm jobs in the month of August. But since the economy needs to create 127,000 jobs a month in order to keep up with population growth, this resulted in an overall increase to the jobs deficit of 72,000, as compared to the previous report.

Having been informed of the news prior to his DNC acceptance speech, that the hopes and dreams of another 72,000 Americans had been decimated, along with those of an estimated 27 million who were already unemployed or underemployed, Barack Obama slid into his quotidian comedy routine, ridiculing conservative economic policies, stating that, “They want your vote, but they don’t want you to know their plan. And that’s because all they have to offer is the same prescription they’ve had for the last thirty years: ‘Have a surplus? Try a tax cut.’ ‘Deficit too high? Try another.’ ‘Feel a cold coming on? Take two tax cuts, roll back some regulations, and call us in the morning!’”

Here’s the big picture. We had a recession which lasted for the last 12 month’s of the Bush term through the first 6 month’s of Obama’s, not for the last 30 years. Today 12,544,000 Americans are counted as officially unemployed. Another 7,031,000 are unemployed and want jobs, but have dropped out of the labor force and are thus not officially counted. And still another 8,031,000 are employed part-time for economic reasons. The truth is that if Barack Obama’s government-down, borrow-and-spend policies worked, then the jobs deficit wouldn’t be worse-off today than it was in December 2009, yet it is. So enough with the jokes, how many jobs need to be created each month in order to reach full-employment, and how long will it take? And in light of the answer, is four more years of Obama’s deficit spending and light-mindedness the cure?

Obama Got Jokes

No Mr. President, it’s not a surplus, or a cold that we feel coming on, it’s something much more fatal. You see, the U.S. National Debt surpassed the $16 trillion mark before Obama took to the podium. And why is this problematic? Well for one, the USA’s credit rating was already downgraded once on Obama’s watch, on August 5, 2011, the first such occurrence in American history. And secondly, because Barack Obama’s prescription for all that ails our economy is the same one he’s offered for the last 4 years: ‘Debt too high? Borrow and spend some more.’ ‘Entitlement spending bankrupting the nation? Add a new entitlement (Obamacare), then borrow and spend even more.’ ‘Job creation numbers insufficient? Tell more jokes, then borrow and spend a little bit more.’

Yet while Barack Obama has elected to waste the last four years of our lives running up the national debt, while capping on conservative economic policies, the U.S. jobs deficit has increased from 5,165,000 in December 2008 to 11,832,000, an increase of 6,667,000 (see chart below). Essentially, what this means is that since Obama implemented his $831 billion Stimulus plan, the economy has been unable to create a sufficient number of jobs for 6,667,000 new entrants, many of whom have been ushered straight out of high school or college into hopelessness and generational dependency. Do you think this is funny? I don’t. Exactly where have four years of Barack Obama’s borrow-and-spend prescription refills landed us?

Updated Jobs Benchmark

Updating Economist Paul Krugman’s job creation benchmark with the latest figures, we discover that to be meaningful, the number of jobs needed to return to more or less full employment by December of 2014, or within the next 28 months, is now 549,571 jobs a month, as follows:

  • In order to keep up with population growth, we would need to create 127,000 jobs times 28 months, or 3,556,000. Add in the need to make up for the jobs deficit and we’re at around 15,388,000 (3,556,000 + 11,832,000) over the next 28 months — or 549,571 jobs a month.

If we extend the target date to 5 years from today, which will be more than 8 years from the time the recession ended, then the number of jobs needed to return to more or less full employment by August of 2017, or within the next 60 months, is now 324,200 jobs a month, as follows:

  • In order to keep up with population growth, we would need to create 127,000 jobs times 60 months, or 7,620,000. Add in the need to make up for the jobs deficit and we’re at around 19,452,000 (7,620,000 + 11,832,000) over the next 60 months — or 324,200 jobs a month.

Did the U.S. add 549,571 jobs last month? Nope. In fact we haven’t come anywhere close in any month during the entire Obama recovery. Did employers add 324,200 jobs last month? Nope. In fact, we haven’t even come close to this number in any month during the entire Obama recovery, except for the single month of May 2010, but those were just temporary Census jobs that went away in subsequent months (see the related table).

The sad truth is that the U.S. only added 55,000 Nonfarm jobs in August (+96,000 minus 41,000 of previous overstatements). And because the jobs deficit increased by 72,000, we are currently on track towards a permanent decline. In other words, it is impossible to reach full-employment while the jobs deficit is increasing. Thus, we are NOT moving in the right direction, we are moving towards another recession. We have wasted 44 months coping with the unreasonable economic policies of Barack Obama, and what did we get in return? We are worse off today than before he started.

Incomplete or Deficient?

At this point, we either need to create 549,571 jobs each and every month to be on a track towards full employment within the next 28 months, or 324,200 jobs each and every month to be on track towards full employment within the next 5 years (which will be more than 8 years from the end of the recession). And although Barack Obama has orated a plan which would add 600,000 new jobs in Natural Gas by 2020 (or over the next 8 years), and 1,000,000 new Manufacturing jobs over the next four years, we are forced to give his plan a grade of “D” for deficient. Under Obama’s government-down, borrow-and-spend economic policies, most of us will indeed be in “a better place” by the time the U.S. reaches full-employment.

A lot of my friends, neighbors, and clients lost their jobs, lost their homes, divorced or filed for bankruptcy over the last 3 years and eight months. My neighborhood has been decimated, as our homes have lost a third of their value. Our business revenues have declined and leveled off at a lower tier. And as far as I can see, only one political party offers any hope of turning things around. The Obama-Biden plan includes a goal of creating 1,000,000 new manufacturing jobs over the next four years, which would be great, because their policies have thus far resulted in a loss of 582,000 manufacturing jobs since January 2009. In stark contrast, the Romney-Ryan Plan includes a goal of creating more than 12,000,000 jobs in the next four years, which is entirely doable.

I don’t care what the policies are as long as they lead to the desired result. The Obama-Biden goal is deficient. Even if the plan works, it won’t result in a sufficient number of new jobs to even keep pace with population growth (127,000 a month / 1,524,000 per year). In fact, Obama has set the bar so low that his plan is incapable of eliminating the jobs deficit, even if granted a second term. So what’s the point? Based on our current trajectory, Obama’s plan never comes close to full-employment, ever.

If you think that adding $5.3 trillion to the national debt over four years, establishing a goal of 1,000,000 new jobs when more than 12,000,000 are needed, and sprinkling it over with meaningless ramblings of a far-left gagman is a plan, then you might need to get your head examined. But if the cure for what ails America today really does involve reducing the growth of government spending, reducing income taxes and capital gains taxes, reducing the number of government regulations, and creating more than 12,000,000 new jobs in the next four years, and you reject it in favor of the former, then God help us all. If you’re still sane after filtering through all the nonsense, then you know what you have to do. Vote for the Plan, there’s only one.

Data: Worksheet on Google Drive

Obama’s Jobs Recovery — In Temporary Help Services

One Term Wonder

Symptoms of Government-Down, Borrow-and-Spend Economics

– By: Larry Walker, Jr. –

According to Barack Obama, “We tried this trickle-down fairy dust before. And guess what — it didn’t work then, it won’t work now. It’s not a plan to create jobs.” But only the most gullible members of the Democratic Party would find such words edifying. What really matters to the majority of Americans, a point all but ignored by the Obama-Biden Entourage, is the fact that since the beginning of the Great Recession, a total of 4,778,000 Nonfarm Jobs have been entirely wiped out, and what we have been waiting to hear is a coherent plan whereby they might be recovered, not the comedic rhetoric of a left-wing jester.

In reality what Mr. Obama’s words describe are his own government-down, borrow-and-spend, loot-and-plunder policies, which have not only failed to add a single net Nonfarm Job (see chart below), but have instead added more than $5 trillion to the National Debt in just four years, resulting in the first credit rating downgrade in U.S. history. Instead of inundating the nation with more empty rhetoric, what every American deserves to know is the truth regarding where we stand, and how furthering Mr. Obama’s government-down, borrow-and-spend policies would help to restore both America’s credit rating and American jobs.

An analysis of real facts and figures, supplied by the U.S. Bureau of Labor Statistics, finds that during the Obama-Biden Administration a total of 316,000 Nonfarm Jobs have been lost, and regarding Private Sector Jobs, out of a mere 332,000 which have been recovered during the Obama-Biden Dynasty, every single one can be traced directly to the Temporary Help Services Industry. So when it comes to jobs, the pomposity we’ve all heard repeated over and over again by the Obama-Biden Crew and its cheerleading squad, including those prone to media-bias, is just that. A more substantive analysis begins.

Total Nonfarm Jobs

Examining the growth (decline) in Total Nonfarm Jobs [Private Sector + Government] since January 2001, it is clear that job creation is not something the Obama-Biden Administration should be bragging about. Here’s why (see chart below).

Total Nonfarm Jobs

  • From the end of January 2001 through the end of January 2008, a total of 5,557,000 Nonfarm Jobs were gained, during the Bush Administration.

  • During the last year of the Bush Administration, as a result of the Great Recession, from the end of January 2008 to the end of January 2009, a total of 4,462,000 Nonfarm Jobs were lost.

  • Thus, a total of 1,095,000 Nonfarm Jobs were gained during the Bush Administration.

  • During the Obama Administration, from the end of January 2009 through July 2012, a total of 316,000 Nonfarm Jobs have been lost.

  • Overall, we are still 4,778,000 Nonfarm Jobs in arrears, from a record high established by the Bush Administration at the end of January 2008.

Thus, in terms of Total Nonfarm Jobs, 1,095,000 were added during the Bush Administration, a rather pathetic record since we need to create 1,524,000 jobs a year (127,000 per month) just to keep up with population growth. In comparison, after nearly four years, and $5.3 trillion in new federal debt, not a single Nonfarm job has been added by the Obama-Biden Administration, but rather 316,000 have been lost. In spite of the policies of Obama-Biden, Nonfarm Jobs are still 4,778,000 short of the January 2008 peak, so gullible Obama-Biden loyalists need to find something else to showboat.

Total Private Sector Jobs

After cringing at the Total Nonfarm statistics above, gullible Obama-Biden loyalists will say that what they were really bragging about was their record on Private Sector Jobs (exclusive of Government). Okay, so let’s examine the growth (decline) of Private Sector Jobs since January of 2001.

Total Private Sector

  • From the end of January 2001 through the end of January 2008, a total of 4,016,000 Private Sector Jobs were gained, during the Bush Administration.

  • From the end of January 2008 to the end of January 2009, due to the Great Recession, a total of 4,662,000 Private Sector Jobs were lost, during the Bush Administration.

  • Thus, a total of 646,000 Private Sector Jobs were lost, during the Bush Administration.

  • During the Obama-Biden Administration, from the end of January 2009 through July 2012, a total of 332,000 Private Sector Jobs have been recovered.

  • Overall, Private Sector Jobs are still in arrears by 4,330,000 from a record high established by the Bush Administration at the end of January 2008.

So in terms of Private Sector Jobs, we have to hand it to Obama-Biden. While the Bush Administration lost 646,000 Private Sector Jobs over eight years, the Obama-Biden Administration has recovered 332,000 over the last four years. However, since we really need to create 1,524,000 jobs a year (127,000 per month) just to keep up with population growth, and since Private Sector Jobs remain 4,330,000 short of the January 2008 peak, the Obama-Biden Administration’s record isn’t really worth grandstanding. In fact, when government-down supporting, Obama-Biden loyalists discover the subsector in which these jobs were added, they should run as far away from their Party’s chosen platform as they can get.

Which Subsector(s) Gained Jobs?

Which areas of the Private Sector gained jobs during the Obama-Biden Administration? To know the answer, one must comb through all of the various industries detailed by the Bureau of Labor Statistics, in Table B-1, sector by sector. Were jobs gained in Mining and Logging, Construction, or Manufacturing? No. What about in the Wholesale Trade, Retail Trade, or Transportation and Warehousing? Nope. How about Information, Financial Activities, Education and Health Services, Leisure and Hospitality, or Other Services? Nope.

To be precise, the only sector of the economy where you’ll find any net jobs growth during the Obama-Biden Administration is under the Professional and Business Services category, and there only in the subsector named Temporary Help Services (under Professional and Business Services >> Administrative and Waste Services >> Administrative and Support Services >> Employment Services >> Temporary Help Services).

Temporary Help Services (NAICS 56132) – The temporary help services industry comprises establishments primarily engaged in supplying workers to clients’ businesses for limited periods of time to supplement the working force of the client. The individuals provided are employees of the temporary help service establishment. However, these establishments do not provide direct supervision of their employees at the clients’ work sites. So let’s examine the growth (decline) of Temporary Help Service Jobs since January of 2001.

Temporary Help Services Jobs

  • From the end of January 2001 to the end of January 2009, a total of 600,000 Temporary Help Service jobs were lost, during the Bush Administration. [Note: This accounts for nearly all of the 646,000 Private Sector Jobs lost over the period.]

  • During the Obama-Biden Administration, from the end of January 2009 through July 2012, a total of 576,000 Temporary Help Service jobs have been recovered. [Note: This accounts for all of the 332,000 Private Sector Jobs recovered during the period, minus losses in other sectors.]

So 600,000 Temporary Help Service jobs were lost during the Bush Administration, and the Obama-Biden Administration was able to recover 576,000 of them. In effect, since a total of 646,000 Private Sector Jobs were lost during the Bush Administration, among them, 600,000 or almost all were Temporary Help Service jobs. Since then, the Obama-Biden Administration has recovered a total of 332,000 Private Sector Jobs, and every single one of them, 576,000 minus losses in other sectors, were in Temporary Help Services.

Conclusion

From the end of January 2001 to the end of January 2009, a total of 1,095,000 Nonfarm Jobs were gained during the Bush Administration. In contrast, during the Obama-Biden Administration, from the end of January 2009 through July 2012, a total of 316,000 Nonfarm Jobs have been lost. Meanwhile, as Barack Obama, Joe Biden and their gullible loyalists boast about this great accomplishment, we are still 4,778,000 Nonfarm Jobs, and 4,330,000 Private Sector Jobs short of the record highs established by the Bush Administration at the end of January 2008. Even worse, since the population continues to grow, from the start of the Great Recession the real jobs deficit in the U.S. has increased to 11,760,000. That’s the record. Those are the facts. That’s the truth.

Like it or not, the only platform on the ballot this November which includes a plan and a promise to create more than 12,000,000 middle-class jobs over the next four years is the Romney-Ryan platform. In contrast, the plan and promise outlined by the Obama-Biden platform, to-date, includes more gloating, more lofty rhetoric, more special interest tax breaks, more deficit-financed subsidies, more uncertainty, more divisiveness, more government dependency, more government regulation, more borrowing and spending, higher health care costs, higher taxes, and with any luck a few more Temporary Help Service jobs.

It’s time to wake-up. It’s time to care. It’s time to do what’s in your best interests and that of your country. It’s time to stop believing in myths, and time to ‘Believe in America’.

“It is impossible to calculate the effect of deficit-financed government spending on demand without specifying how people expect the deficit to be paid off in the future.” ~ Theory of Rational Expectations

Chart Data | At Google Drive

Has Obama’s Loot-and-Plunder Theory Worked?

A 50-Year Retrospective

– By: Larry Walker, Jr. –

“Socialism is a philosophy of failure, the creed of ignorance, and the gospel of envy, its inherent virtue is the equal sharing of misery.” ~ Winston Churchill ::

Discussing his economic policies at a fundraiser in Oakland, California on July 23rd, Barack Obama, told supporters that, “We tried our plan, and it worked.” Yet, by the end of his first year in office, he had only managed to drag America, kicking and screaming, beyond the point of no return, as our National Debt, on a per capita (per person) basis, surpassed per capita Personal Income for the first time in more than 50 years (see chart above). As of June 30, 2012, after nearly four years of disservice to the nation, under the leadership of Barack Obama, every American now owes $7,958 more in federal government debt, on a per capita basis, than their personal income.

Per Capita National Debt to GDP

Equally alarming, as of June 30, 2012, the U.S. National Debt per capita reached a stunning 101.7% of Gross Domestic Product, an increase of 45.1% since the end of 2008. Looking back over the last half-century, no other President of the United States has done more to destroy our standard of living than Barack Obama. Now if that was his goal, then yes – it worked like a charm. However, this temporary condition will soon meet its demise.

Gross Domestic Product (GDP) is the market value of all officially recognized final goods and services produced within the United States. GDP per capita is considered an indicator of our nation’s standard of living. As of June 30, 2012, U.S. GDP per capita was equal to $49,672. The National Debt is the sum of all previously incurred annual federal deficits. Since deficits are financed by government borrowing, either from the public or from itself, the national debt is equal to all government debt outstanding. As of June 30, 2012, the U.S. National Debt per capita was equal to $50,502.

Thus, it may be stated that, as of June 30, 2012, the standard of living of the United States is negative. In other words, when taken as a whole, on a per capita basis, for the first time in more than a half-century, Americans now owe more in federal government debt than we produce. In effect, there isn’t anything left to address the growing mountain of state and local government, personal and business arrearages.

Granted that Barack Obama and a tiny remnant of gullible far-left loyalists have devised numerous excuses as justification for this atrocity, one way of accurately measuring the validity of such subterfuge is to simply compare the ratio of per capita National Debt to GDP over the last half-century. After all, it was Barack Obama who said of supply-side economics, a theory which has been deployed during most of the 1960’s through 2007, “We tried this trickle-down fairy dust before, and guess what — it didn’t work then, it won’t work now… It’s not a plan to lower the deficit…” Well, let us test this hypothesis on a relative basis, and see just how well his loot-and-plunder theory stacks up.

A quick study of the chart above, Per Capita National Debt to GDP: 1960 through June 2012, tells the whole story.

Testing Obama’s Theory

  1. At the end of 1960 per capita National Debt to GDP was equal to 54.4%.

  2. John F. Kennedy’s Tax Reduction Act of 1964 was signed into Law by his successor Lyndon B. Johnson. Under the ensuing era of lower tax rates, by the end of 1981, per capita National Debt to GDP declined all the way to 31.9%.

  3. Ronald W. Reagan’s Economic Recovery Tax Act went into effect in 1982, and even though government spending was higher than he would have liked, by the end of his term in 1988, per capita National Debt to GDP stood at just 51.0%.

  4. In 1993, Bill Clinton signed the Deficit Reduction Act, which turned out to be nothing more than a tax hike. By the end of 1996, per capita National Debt to GDP had increased to 66.7%.

  5. Then in 1997 the Republican-led Congress passed a tax-relief and deficit-reduction bill that was resisted but ultimately signed by President Clinton. One of the things the 1997 bill did was lower the capital gains tax. It was actually the 1997 tax cut, not the 1993 Clinton tax hike, which produced the boom of the 1990’s. By the end of the year 2000, per capita National Debt to GDP declined to 57.0%.

  6. In 2001, George W. Bush signed the Economic Growth and Tax Relief Reconciliation Act. By the end of 2001, per capita National Debt to GDP decreased to 56.5%, and later increased slightly to 58.5% in 2002.

  7. The following year, George W. Bush signed the Jobs and Growth Tax Relief Reconciliation Act of 2003, which provided the tax rates in effect today. By the end of 2007, per capita National Debt to GDP held at just 64.2%.

  8. In 2009, Barack H. Obama signed the American Recovery and Reinvestment Act (ARRA). The primary objective for ARRA was to save and create jobs almost immediately. Secondary objectives were to provide temporary relief programs for those most impacted by the recession and invest in infrastructure, education, health, and ‘green’ energy. The cost of the economic stimulus package was estimated to be $787 billion at the time of passage, but was later revised to $831 billion. By the end of 2009, per capita National Debt to GDP increased to 85.2%.

  9. The following year, Barack H. Obama signed the Tax Relief, Unemployment Insurance Reauthorization, and Job Creation Act of 2010, which extended long-term unemployment benefits and cut the employee’s portion of the Social Security payroll taxes by 2.0%. By the end of 2010, per capita National Debt to GDP increased to 93.5%. By the end of 2011 the ratio had increased to 101.0%, and by June 30, 2012, per capita National Debt to GDP notched up by another seven tenths of a percent to 101.7%.

Ever since Barack Obama implemented his plan, America’s standard of living has gone straight down the tubes. And since he said, “We tried our plan, and it worked…,” we are forced to conclude that his goal was to destroy America’s standard of living. If for some reason this wasn’t his goal, then a more honest assessment would have been, ‘We tried our plan, and it failed.’

When Barack Obama said, “We tried this trickle-down fairy dust before. And guess what — it didn’t work then, it won’t work now… It’s not a plan to lower the deficit..,” whose policies could he possibly have been referring to? A quick study of U.S. per capita National Debt to GDP ratios and per capita Personal Income to National Debt over the last 50 years leads to only one possible conclusion – his own.

Conclusion

Since per capita National Debt to GDP is at the highest ratio since the unsustainable heights attained during the second World War, and higher than at any time in the last half-century, and since Barack Obama has clocked the highest annual budget deficits in American history ($1,412.7 billion in 2009, $1,293.5 billion in 2010, $1,299.6 billion in 2011, and $1,326.9 billion in 2012), we can only conclude that his loot-and-plunder economic theory has achieved the worst results of any set of economic policies deployed by any American president, ever. The facts speak for themselves.

We tried Barack Obama’s loot-and-plunder theory, and it failed. And not only have Obama’s policies failed, but American’s are now worse off than at any time since the 1940’s. No one has managed our economy more recklessly than Barack H. Obama. Are you still a believer? Isn’t it high time we go back to what we know works, make some improvements, and implement some of the reforms proposed over the years, which were errantly pushed aside? Yes it’s time. And since Barack Obama has proved himself unwilling to bend to the will of the American people, it’s time we gave someone else the opportunity. It’s time to switch teams. It’s time to follow real leadership. It’s time to elect a true Conservative.

References:

Table 7.1 Selected Per Capita Product and Income Series in Current and Chained Dollars | Bureau of Economic Analysis

Debt to the Penny | Treasury Direct

Chart Data | Google Drive