Amtrak: A Lesson in Government Takeovers

Poison Pill

– By: Larry Walker, Jr. –

The Quest for Affordability

“They say it’s a government takeover of health care, a big lie just like Goebbels. You say it enough, you repeat the lie, you repeat the lie, you repeat the lie, and eventually, people believe it.” ~ Rep. Steve Cohen (A Government Employed Psychotic)

“If it ain’t broke, break it, and then when it’s broke, nationalize it.” ~ A Wayward Progressive

When facing a régime hell-bent on government takeovers, one must first understand exactly what a government takeover is, how one occurs, and whether or not a takeover is good for the nation. Once we understand what a government takeover is, how one occurs, and how it will end; and once convinced that a takeover is indeed occurring, we can make up our own minds about how to handle it. Of course, proponents of government takeovers will always deny that one is occurring. Such denial is generally accompanied by calling anyone who would so hint a liar, or Nazi propagandist.

According to advocates of government takeovers, any private entity which makes a profit is bad and worthy of increased regulation, and once bankrupted, in certain cases, worthy of takeover. Under the rules for government takeovers, the objective is government control of everything, from private industry to personal lives, and everyone is a loser. The only thing that matters for most politicians is that they keep their own government backed jobs, retirement security, and benefits; and the best way for them to ensure this is through increased government control.

The Government Takeover of Passenger Railroads

For example, before the National Railroad Passenger Corporation (a.k.a. AmTrak) existed, there was a profitable private passenger rail industry. But profits being deemed a bad thing by both big government and unions, meant that its days were numbered. “Bring them down”, they decried. “Top down, bottom up, inside out.” While unions pushed for higher pay, greater retirement security, and more benefits, big government tightened regulations — limiting the amount railroads could charge for their services. The attack came by big government from the top, and unions from the bottom. The only thing lacking was a thrust from the inside out.

The first line of attack would come from the Interstate Commerce Commission which prevented increases in the amounts that privately owned railroads could charge both shippers and passengers. This meant that the only way in which railroads could become more profitable was through cost-cutting. But the ability to slash costs was greatly hampered by agreements with aggressive employee unions. Eventually, the railroads turned to mergers as the only way of escape. What else can an industry do once it has been obstructed from responding to changing market conditions?

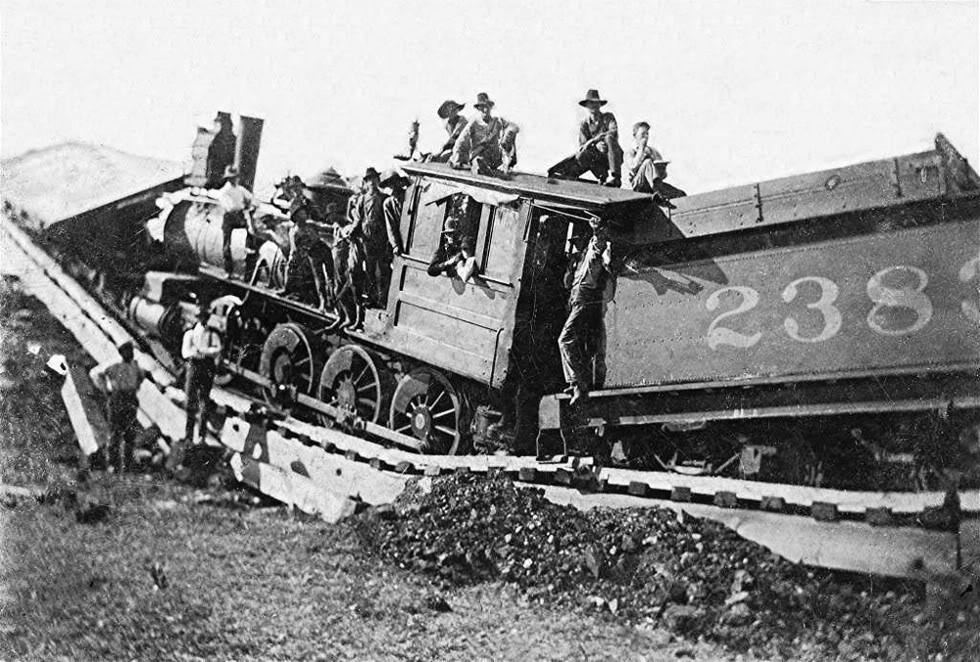
In 1968, the New York Central and Pennsylvania railroads merged creating Penn Central, which would result in a virtual monopoly within the U.S. passenger rail industry. But the nation would be shocked when only two years later, in June of 1970, Penn Central declared bankruptcy. At the time, it was the largest corporate bankruptcy in American history. But this was only the beginning. Behind the scenes a government takeover was being staged from the inside out.

In May of 1967, the National Association of Railroad Passengers (NARP) was founded to lobby for the continuation of passenger trains in the United States. Imagine that, a few months before the railroads were forced to merge, and just three years before they would go bust; a government takeover was already in the works. This was the missing link, an attack from the inside out. It was big government from the top, employee unions from the bottom, and now passengers themselves (at least in name) were demanding continued services, profitability be damned. The man-made crisis was complete and there was now enough force to justify a full blown government takeover.

The NARP’s lobbying efforts were successful at dividing both political parties. The Democrat Party was opposed to any sort of subsidies to privately-owned railroads, and the Republican Party feigned opposition to the nationalization of the industry. Sound familiar? But in the end, both Democrats and Republicans would compromise for fear of being responsible for the extinction of passenger trains. So what did big government do? What they always do, they agreed to both subsidize and nationalize the passenger rail industry.

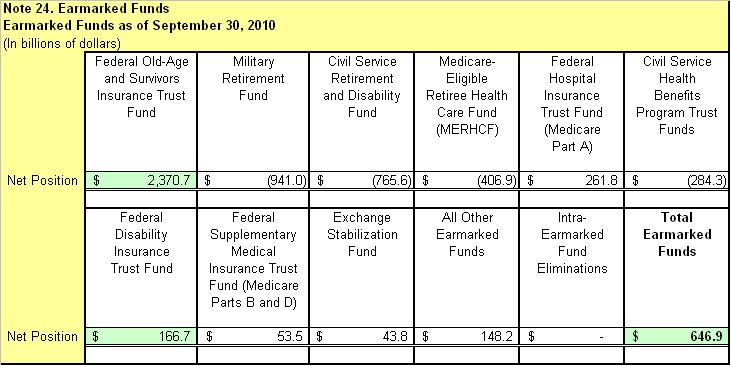
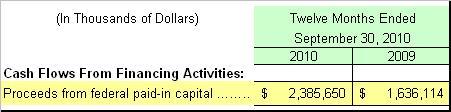
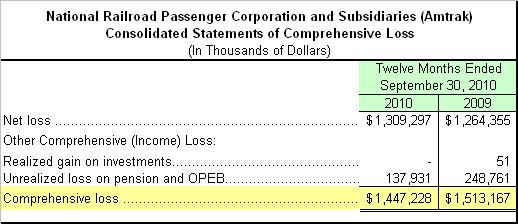
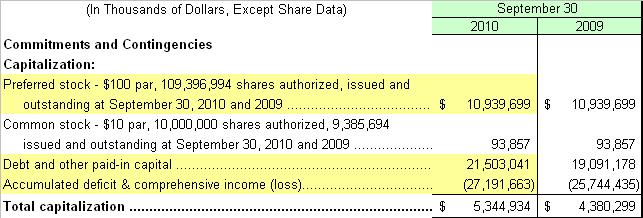
In 1971, the federal government stepped in and created Amtrak, a virtual government agency, which began to operate a skeleton service on the tracks of Penn Central and other U.S. railroads. Today, the federal government owns all of the preferred stock in AmTrak, has invested $32.4 billion of taxpayer’s money into the government owned corporation over the past 40 years, and in return, AmTrak has netted total losses of $27.1 billion. In fiscal year 2010, the federal government pumped in an additional $2.4 billion, and AmTrak promptly lost $1.4 billion of it, before the red ink dried. Besides the federal government, the only other shareholders in AmTrak are the old railroad companies themselves, which are now consolidated into other private companies.

The Fate of Shareholders

AmTrak initially issued 10,000,000 shares of common stock, with a par value of $10 per share, to the bankrupt railroads in exchange for their assets. In fact, American Financial Group (AFG) still owns 5.2 million shares which were acquired directly from Penn Central. Although Congress, in 1997, ordered AmTrak to buy back all of its common shares by the year 2002, AmTrak has yet to have the funds, and has in fact been totally dependent on additional government subsidies just to remain viable.

In 2002, AFG filed suit against AmTrak seeking $52 million, plus interest (5.2 million shares @ $10). Two years prior, AmTrak had offered to buy back all of its common shares for a measly three cents per share. Of course none of the common stock holders accepted such a ridiculous offer. Who in their right mind would settle for $156,000 in return for a $52 million investment made some 40 years prior? This is a fine example of what private stock and bond investors may expect in the wake of a government takeover. The original stockholders would have gotten a better deal through normal bankruptcy proceedings, but because of the government’s takeover, everyone got screwed, including generations of unborn taxpayers. It would be wise to remember this as the government attempts to takeover the health care industry.

The Government Takeover of Health Care

And that brings us to the main point of this post, the government’s attempted takeover of the health care industry. The only difference between what I will call AmHeal, and AmTrak, is that the health care industry isn’t broke (yet). But regulations are coming which will attempt to restrict the amount that health insurance and health care providers may charge their customers, while increasing the burden of services they must provide. These regulations will naturally cripple the industry from the top down and from the bottom up.

Health care insurers and providers will quickly realize that the only way they can remain profitable is through cost-cutting, yet their ability to cut costs will be restricted by the increased amount of services they will be required to provide. With millions more customers having been mandated by the federal government, and with restrictions on the amount which may be charged, companies will begin to consolidate in order to achieve economies of scale. But just like the railroads, their attempts will fail. In the meantime, labor unions and progressive community organizers are seeking to stir up public support by way of demanding that health insurers and providers do more with less, profitability be damned. In the end, we will wind up with government run health care, just like many have warned all along.

Unless a poison pill strategy is implemented to derail this insidious disaster, we will soon see the AmTrak of health care, AmHeal. And AmHeal will be just as disastrous as AmTrak in every way. Over time, AmHeal will not only lose billions of dollars per year, but potentially trillions, and will eventually bankrupt the United States of America. Investors in health care companies will be among the first to get burned, as health care companies begin filing for bankruptcy. This will be the final blow to the $2.3 trillion health care industry, and the end of 1/6 of our free market economy.

So how do we derail AmHeal before it reaches the tarmac? In dealing with a government takeover, a poison pill must be taken from within the government itself. We must takeover the government with a top down, bottom up, and inside out approach. We the people must elect politicians dedicated to defunding all regulatory aspects of the affordable health proposal, and then put pressure on the political system from the bottom up. Then all private industry must place additional pressure on the government by requesting waivers, thereby opting out of the government’s proposed mandates. Tea Party advocates, moderates, centrists, conservatives, State governments, lobbyists, and proponents of the free-market must band together. We know that we must stop the government takeover of health care, and that is precisely what we are doing, and what we will accomplish.

References:

Penn Central Transportation

National Association of Railroad Passengers

Major Acts of Congress – Rail Passenger Service Act

AMTRAK REFORM AND ACCOUNTABILITY ACT OF 1997

History of U.S. Gov’t Bailouts

Amtrak management = worthless Amtrak stock

RAILROADS: Perils of Penn Central

Social Security: A Breach of Trust

Reviewed

– By: Larry Walker, Jr. –

Notes on 2010 Financial Statements of the U.S. Government

“I am a firm believer in the people. If given the truth, they can be depended upon to meet any national crisis. The great point is to bring them the real facts.” ~ Abraham Lincoln

“The ignorance of one voter in a democracy impairs the security of all.” ~ John F. Kennedy

Proponents of a bankrupt federal government continually proclaim that Social Security is solvent. They boast in the Trust Fund’s fictitious surplus balance of $2.6 trillion as proof. But even Note 24, of the United States Government’s Notes to the Financial Statements, for the year ended September 30, 2010 states that while, “In the private sector the term “trust fund” refers to funds of one party held and managed by a second party (the trustee) in a fiduciary capacity” that, “In the Federal budget, the term “trust fund” means only that the law requires a particular fund be accounted for separately, not that funds are actually set aside.” It further states that, “…as far as the federal government is concerned, earmarked funds, including the Social Security Trust Fund are the property of the federal government.”

In other words, as far as the government is concerned, any money it receives on our behalf may be spent in any way it desires, as long as an appropriate book entry is made. The money we have been paying in towards retirement security has already been spent. Note 24 goes on to verify this by stating that, “The government does not set aside assets to pay future benefits or other expenditures associated with earmarked funds (i.e. Social Security).” And further that, “The cash receipts collected from the public for an earmarked fund (i.e. Social Security) are deposited in the U.S. Treasury, which uses the cash for general Government purposes.”

As I explained in “The Social Security Bust Fund”, the federal government has summarily confiscated and spent every dime of the $2.6 trillion surplus, which would have comprised the Social Security Trust Fund, and has replaced it with non-marketable, special-issue, Treasury securities. Since these special-issue securities are an asset to the Trust Fund and a liability to the U.S. Treasury, they therefore cancel each other out and, according to Note 14, “are eliminated in the consolidation of these financial statements”. However, as we shall see later, they actually do appear on the financial statements and are detailed in Note 24.

During any fiscal year, when a trust fund’s disbursements exceed its receipts, then these special-issue securities require redemption. Note 24 warns us that, “Redeeming these securities will increase the Government’s financing needs and require more borrowing from the public (or less repayment of debt), or will result in higher taxes than otherwise would have been needed, or less spending on other programs than otherwise would have occurred, or some combination thereof.” Since less repayment of debt is a non-issue, the only options the government has in order to pay back what it has stolen from the Trust Fund are to borrow more from the public (i.e. increase the debt ceiling indefinitely), raise taxes, or cut spending on other programs.

In effect, there is no Trust Fund. The total amount of Social Security taxes collected within each fiscal year is spent on that year’s benefit payments. If the total receipts exceed the amount of benefit payments, then the surplus is taken by the Treasury and spent on general expenses. However, if the amount of benefit payments exceeds receipts, such as happened in 2010, then the Treasury must borrow more from the public in order to reimburse the Trust Fund. In the fiscal year ended September 30, 2010, the government collected a total of $552.8 billion in Social Security taxes, and paid out $574.9 billion in benefits. The difference was made up by the Treasury paying out some of the accrued interest that it owes on past borrowings. Of course, the interest which was paid out had to be borrowed from the public because, the government has been running trillion-dollar plus budget deficits for the past two years.

You should review the financial statements of the United States Government for the fiscal year ended September 30, 2010 for yourself, and draw your own conclusions. I have and I am sad to report that the Social Security Trust Fund is nothing more than an empty promise. Let’s check the balance sheet.

As of the close of fiscal year 2010, the federal government had total assets of just $2.9 trillion. As you can see above, there is no account named the “Social Security Trust Fund” which contains a balance of $2.6 trillion. The sad truth is that the federal government would have to liquidate nearly all of its assets including property, plant and equipment in order to raise the $2.6 trillion which it owes to the Social Security Trust Fund. So where’s the money, you ask? Like I said from the beginning, “It has already been spent.”

Among the government’s assets, only $428.6 billion was classified as “cash and other monetary assets”. Digging down into Note 2 of the financial statements, we discovered that the actual amount of cash was just $332.0 billion. Further, we discovered that out of this $332.0 billion, only $112.6 billion (103.6 + 9.0) was actually “unrestricted”, meaning available for use on government operating expenses. The remainder, which was listed as “restricted”, included $200 billion which was held by the Federal Reserve in the Supplementary Financing Program (SFP*), $18.6 billion held by the Foreign Military Sales program, and another $0.8 billion which was curiously omitted from explanation.

The other monetary assets listed were International Monetary Assets of $70.4 billion, Gold of $11.1 billion, and Foreign Currency of $15.1 billion. (It’s interesting to note that the government owns 261,498,900 troy ounces of gold, and that its book value is listed at $11.1 billion, or at the statutory value of just $42.22 per ounce. If valued at the fair market value of $1,307 per troy ounce on 9/30/2010, then the value would actually have been $341.8 billion.) A detailed explanation of cash and other monetary assets may be found in the narrative section of Note 2.

The Supplementary Financing Program (SFP)*

It’s worthy of noting that the SFP is a temporary program that deposits cash with the Federal Reserve to support Federal Reserve initiatives aimed at addressing the ongoing crisis in financial markets. It’s interesting to note that the Federal Reserve has control of more of the government’s cash assets than the U.S. Treasury, and that the crisis in the financial markets is deemed to be “ongoing”. Following is a more detailed explanation of the SFP as reported by Bloomberg, on February 25, 2010:

“The Supplementary Financing Program, in which the Treasury Department sells bills and places the proceeds in a Fed account, will be part of the Fed’s strategy for rolling back its extraordinary assistance to the economy and financial markets, the central bank said in its monetary policy report to Congress yesterday. The report also said the program was temporary and wasn’t an essential element of the Fed’s toolkit.”

“The program helped the Fed manage the more than doubling of its balance sheet as it battled the financial crisis and will be part of the central bank’s eventual efforts to withdraw more than $1 trillion in excess bank reserves.”

“The Treasury said the decision to move to $200 billion reflects the program’s outstanding balance between February and September 2009, before concerns about the debt ceiling forced the government to shrink the program. President Barack Obama this month signed a $1.9 trillion increase in the limit to $14.3 trillion.”

Show Me the Trust Funds

Where is the Social Security Trust Fund shown on the government’s financial statements? As you should understand by now, the government borrowed and spent all of the money and owes it back to the Trust Fund, however, you won’t find an entry matching $2.6 trillion on the balance sheet. Per Note 14, “Intragovernmental debt holdings represent the portion of the gross Federal debt held as investments by Government entities such as trust funds, revolving funds, and special funds. This includes trust funds that are earmarked funds. For more information on earmarked funds, see Note 24─Earmarked Funds. These intragovernmental debt holdings are eliminated in the consolidation of these financial statements.” However, the net amount of all of the government’s sacred trust funds does appear in the Net Position section as Earmarked Funds in the amount of $646.9 billion. What this means is that when all of the government’s various trust funds are netted together, the $2.6 trillion Social Security Trust Fund is reduced to a surplus of just $646.9 billion.

I created the following condensed table based on the one shown in Note 24 (the original is too large to be shown here). As you can see, when the $2.6 trillion surplus balances of the Federal Old-Age and Survivors Insurance Trust Fund, and the Federal Disability Insurance Trust Fund are netted against a $941.0 billion deficit in the Military Retirement Fund, a $765.6 billion deficit in the Civil Service Retirement and Disability Fund, a $406.9 billion deficit in the Medicare-Eligible Retiree Health Care Fund, and the rest of the trust funds, the net balance is just $646.9 billion. This is shown as the amount of “Earmarked Funds” which the government owes to itself out of its $14.1 trillion of accumulated deficits. In financial terms, the federal government has accumulated losses of $14.1 trillion since its inception. It may also be the only entity on earth with the audacity to proclaim that the $2.6 trillion, which it borrowed from funds which were supposed to have been held in trust, is somehow secured by its $14.1 trillion in accumulated losses. In reality, both the Federal Government, and the Social Security Trust Fund are insolvent.

Earmarked Funds (click to enlarge)

In conclusion, the only options that the government has of recovering the $2.6 trillion surplus, which our generation has dutifully paid into Social Security, are to either; (1) borrow more money from the public, (2) increase taxes, or (3) reduce spending on other programs.

  1. Borrowing more from the public, in order to pay back that which has already been borrowed from the government, could put the nation’s credit rating at risk, thus jeopardizing not only Social Security, but our National Security.
  2. Increasing taxes on the public in order to make up for what we have already paid in taxes, which should have been set aside for our welfare instead of having been squandered, is not acceptable.
  3. The only viable option is for the federal government to fundamentally restructure, privatize, or discontinue every governmental agency, program, subsidy, enterprise, and special project which does not take in more money than it spends. This includes all Government Sponsored Enterprises, the Postal Service, and Amtrak. If it’s not making money, then it must either be restructured in a way so as to become profitable, sold to the private sector, or terminated. After that comes the selling off of government owned property, plant and equipment, gold and any other non-productive asset held by the federal government.

References:

Financial Statements of the United States Government for the Years Ended September 30, 2010, and 2009 – http://www.fms.treas.gov/fr/10frusg/10stmt.pdf

United States Government Notes to the Financial Statements for the Years Ended September 30, 2010, and 2009 – http://www.fms.treas.gov/fr/10frusg/10notes.pdf

Current Report: Financial Report of the United States – www.fms.treas.gov/fr/index.html

Fed Says Treasury’s SFP Bills Advance Monetary-Policy Goals – http://www.businessweek.com/news/2010-02-25/fed-says-treasury-s-sfp-bills-advance-monetary-policy-goals.html

Derailed by Amtrak: The Money Drain

Train Wreck

40 Years in the Wilderness

– By: Larry Walker, Jr. –

Since 1971, the federal government has invested a total of $32.4 billion into the National Railroad Passenger Corporation (a.k.a. “Amtrak”). In return for this lucrative investment of taxpayer’s dollars, Amtrak has accumulated total net losses of $27.1 billion. If we were to average our investment over the last 40 years, it would equal approximately $810 million per year, yet in 2009 and 2010 U.S. taxpayers have pumped in an additional $1.6 billion and $2.4 billion, respectively. Thus it appears that Amtrak’s drain on our collective pocketbook is increasing. Likewise, if we were to average Amtrak’s losses over the past 40 years they would equal approximately $677 million per year, yet in 2009 and 2010 U.S. taxpayers have incurred losses of $1.5 billion and $1.4 billion, respectively. So it appears that our losses are also accelerating.

Paid In Capital

——

Comprehensive Loss

According to the latest independent auditors’ report, which was issued on December 16, 2010, “The Company has a history of substantial operating losses and is dependent upon substantial Federal government subsidies to sustain its operations…. Without such subsidies, Amtrak will not be able to continue to operate in its current form and significant operating changes, restructuring or bankruptcy may occur. Such changes or restructuring would likely result in asset impairments.” And that is exactly what needs to happen. Any entity which is run-by, backed-by, or subsidized-by the federal government and not able to sustain itself without reliance on the general fund should be either privatized, or shut down. The following excerpts are from the independent auditors’ report:

KPMG LLP
1676 International Drive
McLean, VA 22102

Independent Auditors’ Report
The Board of Directors and Stockholders
National Railroad Passenger Corporation:

{….} The Company has a history of substantial operating losses and is dependent upon substantial Federal government subsidies to sustain its operations. The Company is operating under continuing resolutions through December 18, 2010 as discussed in Note 2 to the consolidated financial statements. The Company expects to receive additional interim Federal government funding under continuing resolutions until the fiscal year 2011 funding is approved. There are currently no Federal government subsidies appropriated for the fiscal year ending September 30, 2012 (“fiscal year 2012”). Without such subsidies, Amtrak will not be able to continue to operate in its current form and significant operating changes, restructuring or bankruptcy may occur. Such changes or restructuring would likely result in asset impairments. {….}

December 16, 2010

{….}

NOTE 1: NATURE OF OPERATIONS

The National Railroad Passenger Corporation (“Amtrak” or the “Company”) is a passenger railroad. The United States government (the “Federal Government”) through the United States Department of Transportation (the “DOT”) owns all issued and outstanding preferred stock. Amtrak’s principal business is to provide rail passenger transportation service in the major intercity travel markets of the United States. The Company also operates commuter rail operations on behalf of several states and transit agencies, provides equipment and right-of-way maintenance services, and has leasing operations.

NOTE 2: BUSINESS CONDITION AND LIQUIDITY
Operations and Liquidity

Amtrak was incorporated in 1971 pursuant to the Rail Passenger Service Act of 1970 and is authorized to operate a nationwide system of passenger rail transportation. The Company has a history of recurring operating losses and is dependent on subsidies from the Federal Government to operate the national passenger rail system and maintain the underlying infrastructure. These subsidies are usually received through annual appropriations. In recent fiscal years appropriated funds for Amtrak have been provided to the DOT, which through its agency the Federal Railroad Administration (the “FRA”), provides those funds to Amtrak pursuant to operating funds and capital funds grant agreements, respectively. Amtrak’s ability to continue operating in its current form is dependent upon the continued receipt of subsidies from the Federal Government.

{….}

Audited Consolidated Financial Statements – Fiscal Year 2010

I love traveling by Amtrak but, to be honest, I have only ridden with them two or three times in the last 40 years. Amtrak, we love you, but you’ve got to go. If Amtrak is not able to make a profit, and thus return money to its investors, namely us, then what good is it? I could have flown to Cleveland for half the price that I paid for a sleeper car, and in a couple of hours versus the twenty-four that it took Amtrak. I literally can’t believe that having paid over $1,500 to ride from Atlanta to Cleveland, and back, that these guys can’t make a profit. I mean come on. Investing more public money into new rails and high speed trains is not the answer. Do you really believe that more people will ride trains if they were just a little bit faster? One can only imagine how much higher the fares (and losses) would be after such nonsense.

Capitalization (click to enlarge)

It’s time to fish, or cut bait. If the private sector can’t make Amtrak profitable, then it can’t be done. Private investors are not dumb enough to continue investing in something month-after-month, year-after-year which has never and will never return a profit, nor are taxpayers. If Amtrak were owned by the private sector, it would be no more. That’s just the way it is in the real-world. At the same time, if there is any hope at all, it lies within the private sector. It’s easy for the government to keep flushing good money down the drain, because it’s not their money. It’s our money, so let us make the choice. No one said it was going to be easy. It’s time to dump Amtrak.

The mandate: Amtrak will make the necessary structural changes to become profitable without additional governmental subsidies, and will return the taxpayers investment to the U.S. Treasury by the end of this fiscal year. If Amtrak continues to incur losses over the current fiscal year, then at close of business on September 30, 2011, its assets shall be sold and all proceeds returned to the Treasury.

Photo: http://media.photobucket.com/image/trainwreck+/rcoiteux/TrainWreck01.jpg

Source: Audited Consolidated Financial Statements – Fiscal Year 2010

The Social Security Bust Fund

Privatization

Opt Me Out

– by: Larry Walker, Jr. –

If it sounds too good to be true, it usually is” was a catchphrase used by the Better Business Bureau to alert the public to shady business practices. The phrase was in use since at least 1954. In 1962, the BBB produced a short film titled, “Too Good to Be True”. – The Big Apple

The assets of the Old-Age, Survivors, and Disability Insurance Trust Funds represent the accumulation over time of the difference between income and outgo. The growth of the assets from the end of December 1986 through the end of September 2010 is shown below by calendar quarter.

Assets grew from about $47 billion at the end of December 1986 to about $2,585 billion ($2.6 trillion) by the end of September 2010.

So where’s the money, you ask? Well, to be blunt, there is none. You see, by law, the trust funds are not allowed to hold cash. Instead, they must invest their money into what are known as, non-marketable, special issue (SI), government securities. That’s right! The whole $2.6 trillion “surplus” has been mandatorily invested in the U.S. Treasury. That would be the same Treasury which is currently $14,025,215,218,708.50 in debt. Through 12/31/2010, the Treasury owed a total of $9,390,476,088,043.35 on marketable public securities, and another $4,634,739,130,665.17 on intergovernmental debt (including the amount owed to Social Security). In other words, the government owes the Social Security Trust Fund $2.6 trillion, other governmental agencies $2.0 trillion, and the public another $9.4 trillion.

So where’s the money, you ask? As I said before, there is none; it has already been spent. Yet these special-issue securities are miraculously able to both earn and pay interest at the same time; that is if you can call issuing new debt to the public “earnings”, and paying with IOU’s “interest income”. Interest on these non-marketable special-issue investments is paid (i.e. accrued) semi-annually, at the end of June and the end of December. “Because the trust funds hold no cash, investments are redeemed each month to pay for benefits and administrative expenses. When investments are redeemed, interest is paid. The amount of interest paid is used to offset the amount of investment redemptions.”

In other words, the Treasury pays interest to the Social Security Trust Fund, but not in the form of cash, rather in the form of additional special-issue securities. (Huh?) Interest is only physically paid out when money is needed for benefits and other costs.” And where does the money come from to pay the interest? You guessed it! It comes from income taxes, which you also pay. That’s right! The government requires you to pay 6.2% of your wages into a mandatory retirement plan, and then taxes you on the same income again to pay the interest which your investment is earning. Does this sound like a shady business practice yet?

For example, let’s say that John Q is 50 years old and has $250,000 in a 401K plan. Now let’s say that he devises a scheme whereby he is able to borrow and spend the entire $250,000, and pay it back with interest over time. Let’s also say that he is allowed to pay back simple interest of 2.8%, by merely issuing additional promissory notes. By the time John Q retires at age 65, he will have amassed a retirement fortune of $355,000 (on paper that is). As far as where his first retirement check will come from, why that would be from himself. As John Q’s retirement plan begins to make payments it will need to redeem a portion of the promissory notes issued by John Q. Since John Q is no longer working, and no longer has income with which to pay the debt, he’s out of luck. Perhaps John Q would have been better off by investing real money into a legitimate investment vehicle.

Why in God’s name would anyone make an investment which required them to cover the return on the same out of their own pocket? And worse yet, why would anyone do this when the initial investment and earnings are used to pay for other people’s retirement first? Won’t the “fund” be broke by the time you retire? Yeah, that’s the point. And to make matters worse, our return on investment appears to be crashing; which is good in the sense that we are the ones paying the interest, and bad in the sense that the return on our retirement savings is plummeting. (Huh?)

Diversification 101“Never put all your eggs in one basket.” It looks like the federal government has violated this rule in requiring that federal agencies invest only in federal government securities (special ones at that). The federal government can’t even balance a budget, let alone return a surplus; so why in the world would anyone invest their sacred retirement money in an entity which is currently $14 trillion in debt, and will not be able to earn a surplus, let alone breakeven for the foreseeable future? The truth is that if given a choice, most American’s wouldn’t. The problem is that we don’t think that we have a choice. Why don’t we have a choice? Who does this country belong to? Whose money is at stake? Perhaps it’s time to revisit privatization?

Photo Credit: http://www.johncrabtreephotography.com/

References:

http://www.ssa.gov/oact/ProgData/newIssueRates.html

http://www.treasurydirect.gov/NP/BPDLogin?application=np

http://www.ssa.gov/cgi-bin/transactions.cgi

The Folly of Government Investment

It's Back on the Road

Car’s Out of the Ditch; What’s Left of It Anyway!

– By: Larry Walker, Jr. –

Realistically, it doesn’t look like anyone’s going to be driving this car ever again, so the highway that it’s on is irrelevant. And as far as what they’re sipping on, why that would be Kool-Aid. It looks like we’re going to need a new car, or perhaps just a new President, one who knows something about restoration. What in the heck is a government investment? I mean has anybody ever attempted to figure out what kind of return the government is getting on its current “investments”? I find it rather alarming when I compare the nominal rates of change in GDP, Unemployment, and the Public Debt during the recessions of 2001 and 2008.

click to enlarge

click to enlarge

For example, we see that in 2001, while the number of unemployed Americans increased by 46.6%, GDP was still growing, and the Public Debt was still shrinking. Then in 2002, the second year after the recession, the number of unemployed only grew by another 4.6%, with a modest increase in the Public Debt of 6.4%. And in 2003, the third year post-recession, the Public Debt increased by 10.4%, while the number of unemployed dropped by -3.7%. Unemployment continued to decline in each subsequent year until the beginning stages of the financial crisis appeared, near the end of 2007. In 2007 the number of unemployed Americans rose by 13.4% with modest changes in both the Public Debt and GDP. Following is the question of the day from @danlothiancnn, and then we’ll compare the periods of 2001 through 2003, with 2008 through 2010.

Year 1: The Recession of 2001 vs. 2008

The following statistics are drawn from the table and chart above. We are comparing nominal figures of the number of unemployed, gross domestic product, and the public debt. The percentages shown represent the rate of change from one year to the next.

  • In 2001, the increase in the number of unemployed was 46.6%, or nearly the same as the 48.1% increase in 2008.

  • In 2001, GDP growth was positive at 3.4%, versus an increase of just 2.2% in 2008.

  • The biggest difference was that the public debt decreased by -1.9% in 2001, versus an increase of 15.0% in 2008.

Year 2: Post-Recession 2002 vs. 2009

Moving into the year after the recession began, we notice a huge difference in the number of unemployed.

  • In 2002, the number of unemployed increased by just 4.6%, while in 2009 the increase was a whopping 33.9%.

  • You will also note that GDP increased by 3.5% in 2002, versus a decline of -1.7% in 2009.

  • Next, you will note that while the public debt increased by just 6.4% in 2002, the increase in 2009 was an astronomical 30.0%. What this indicates is that the government overacted in 2009 by implementing a barrage of stimulus, regulations, and bailouts which did little more than increase unemployment and slow economic growth.

Year 3: Post-Recession 2003 vs. 2010

Now let’s look at the 3rd year after the beginning of each recession.

  • In 2003 the number of unemployed declined by -3.7%, versus a decline of just -1.0% in 2010.

  • GDP grew by 4.7% in 2003, versus an increase of 4.4% in 2010.

  • Meanwhile, the public debt grew by 10.4% in 2003, versus an increase of 19.5% in 2010.

Summary

To summarize, the percentage changes over each three-year period were as follows:

  1. GDP was elevated by 12.0% in 2001-2003, while increasing by just 4.9% in 2008-2010.

  2. The Public Debt grew by 15.2% in 2001-2003, versus an escalation of 78.7% in 2008-2010.

  3. The number of the unemployed increased by 47.6% in 2001-2003, compared to mushrooming by 96.5% in 2008-2010.

Conclusion

There is no such thing as government investment. In spite of the government’s colossal spending campaign, which over the past three years has increased the public debt by 78.7%, in the end, the number of unemployed Americans expanded by an absurd 96.5%, and gross domestic product grew by just 4.9% (the same that was achieved in the single year of 2007). So it looks like the federal government’s return on investment over the past three years has been negative. All we got out of the deal was a ballooning of the public debt by 78.7%, and a gargantuan uptick of 96.5% in the number of unemployed Americans. So much for that theory. Government investment amounts to nothing more than meaningless rhetoric.

Perhaps it’s time for the government to get in the back seat; what’s left of it anyway. (1) Stop spending money that you don’t have, under the guise of making “investments”. (2) While you’re at it, you can stop playing God; enough with over-regulation. (3) And further, you guys can stop patting yourselves on the backs, because so far you have achieved nothing (nada). The car wasn’t in that bad a shape when Obama took the keys. The policies which Obama, Pelosi, and Reid implemented in 2009 are directly responsible for expanding both the number of unemployed, and the amount of public debt. Now that the car has been totalled, good luck with the C.Y.A. campaign.

Photo Credit: http://stock-free.com

GDP: Bureau of Economic Analysis

Unemployment: Table 1-A, Bureau of Labor Statistics

Public Debt: Treasury Direct – Debt to The Penny

Tax Rates, Earmarks, and Weiners

Money to Burn

Put Up, or Shut Up!

– By: Larry Walker, Jr. –

Okay, it’s time for all you rich whiners (a.k.a. Anthony Weiner) and cry babies to man up. For those who think that a top federal tax rate of 35% is too low, there is a solution. How about forking over some of that excess lucre? How about putting your money where your mouth is? The time to stand up for your convictions has come. It’s time to make a voluntary donation towards the national debt.

If you meet all of the following criteria, then I’m talking to you:

  1. You don’t like the tax rate extension.
  2. You are overcome with guilt, and want to pay more taxes.
  3. You are a congressman, senator, federal employee, millionaire or billionaire.
  4. You don’t have a business or payroll to meet, and have money to burn.

If this is you, then it’s time to step up. You can make a voluntary gift to the Bureau of the Public Debt, earmarked towards the national debt. That’s the only kind of earmark that we find acceptable. And the best part is that your donation is fully tax deductible. That’s right! You won’t have to pay taxes on any income you voluntarily contribute towards the national debt, not one dime. So what are you waiting for?

Only $2.8 million was donated in the last fiscal year. That’s pathetic. Let’s get that up in the hundreds of millions, or billions. Harry Reid and Nancy Pelosi should be the first to write checks, since they’re the ones who blew a $5 trillion hole in deficit. Where’s Warren Buffet? What about Anthony Weiner? What’s up with Bill Clinton? Is there an Obama in the house? It’s time to put up, or shut up. All those who love to talk trash, while advocating the squander of other people’s money, need to be the first in line. It’s time to trifle some of your own. Otherwise shut the hell up.

How do you make a contribution to reduce the debt?

There are two ways for you to make a contribution to reduce the debt:

  • You can make a contribution online either by credit card, checking or savings account at Pay.gov
  • You can write a check payable to the Bureau of the Public Debt, and in the memo section, notate that it’s a Gift to reduce the Debt Held by the Public. Mail your check to:

    Attn Dept G
    Bureau of the Public Debt
    P. O. Box 2188
    Parkersburg, WV 26106-2188

We will be following up in a couple of months to see how well you did.

Disclosure: 1. Before making a donation to the federal government or any other organization, be sure to review how it spends its money. 2. Voluntarily contributing to the same government that taxes you, may negate any (or all) potential tax savings. 3. Sorry, but I will not be joining you, as I do not fit the criteria.

Links: Treasury Direct ; Forbes Billionaire List

Uncorrelated: GDP and National Debt

Flatlined

Charting Insanity

– By: Larry Walker, Jr. –

Sorry but I can’t seem to find the extreme left-wing’s touted correlation between government borrowing and economic growth. They say things like: “We have to spend more to keep from going broke,” and, “For every dollar spent on unemployment and food stamps, $2.00 is put back into the economy.” But such statements don’t appear to have any rational basis, and as we shall see, no basis in fact.

For example, in 1988 while the national debt increased by 10.7% over the preceding year, real GDP* increased by just 4.1%, and then when the national debt shot up by 13.2% in 1990, real GDP merely increased by 1.9%. It looks to me like the more the government borrows, the worse the economy performs, but maybe it’s just me.

click to enlarge

From 1992 to 2000, while national debt growth was declining year-over-year, GDP remained relatively stable with growth rates between 2.5% and 4.8%, something that’s not supposed to happen in leftist ideology. But, GDP growth only exceeded national debt growth for four short years (1997-2000), and then came more borrowing.

In 2002, the national debt shot up by 7.2%, and GDP growth was an anemic 1.8%. The largest deviations were in 1991 and 2009. In 1991 while the national debt grew by 13.4%, GDP dropped by -0.2%. And again in 2009, the worst yet, as the national debt grew by 18.8%, GDP fell by -2.6%.

In 2010, although national debt growth slowed a bit from the previous year, it still grew by a whopping 13.9%, yet the increase to GDP was barely 2.5%. So far there doesn’t seem to be any proof to support the absurd leftist beliefs.

Now the diviners of the left seem to think that the key to robust economic growth is more borrowing. It’s as if they’re clueless. Here’s a question for you: How did that work out in 2009? The rationale du jour seems to be that since national debt growth slowed a bit in 2010 it should be quickly brought back up to 2009 levels. After all, increased government borrowing always leads to sound economic growth, right?

Wrong. In the real world, based on historical trends, economic growth probably will not follow, but the left will at least have been able to prove their point, whatever that is. My bet is that as government borrowing rises in 2011, GDP will head south again.

click to enlarge

Meanwhile, how about those interest payments? Woo hoo! The government has gone from paying interest on the debt of $214 billion per year in 1988, to $414 billion in 2010.

Good thing interest rates are only around 3.007%. I mean with all the excess debt Congress has been piling on, it will probably be ‘game over’ when interest rates double to 6%, but I guess that will be the price of stupidity.

click to enlarge

And, the debt grows on and on. Too bad we can’t invest in a national debt index fund. We could be making a killing.

If GDP and national debt growth rates in the first chart were reversed, we would be on the right track, but unfortunately, Washington D.C. is on the wrong track. I don’t see any evidence of a correlation between government borrowing and economic growth. Sorry government guys, but real GDP has failed to grow above the 5% level in the last 23 years in spite of over $11.2 trillion of government borrowing.

And, how much did all of this borrowing cost? Well, over the past 23 years the government has paid $7.8 trillion in interest payments.

I’m still waiting on that 100% return that Nancy Pelosi promised on her last unemployment extension, you know, the one that was supposed to be the ‘biggest bang for the buck’ and all. And, with all this new proposed spending I’m sure that unemployment probably won’t go above 11.0%, but nobody’s making that promise.

‘Maybe this time, it will be different’. Yeah, well either keep hoping, or jump ship. I recommend the latter. If there were any correlation at all between government borrowing and economic growth, it would probably be that the less the government borrows the better off the economy, but there doesn’t appear to be any positive correlation.

* Note – GDP is expressed as Real GDP from BEA Table 1.1.1

Data Sources: Bureau of Economic Analysis ; Treasury Direct

The Pelosi Effect: Fatally Flawed

Highway Robbery?

Rational Expectations and Two-Bit Liars

– by: Larry Walker, Jr. –

It is impossible to calculate the effect of deficit-financed government spending on demand without specifying how people expect the deficit to be paid off in the future. ~ The Theory of Rational Expectations

In Rational Expectations and Irrational Intentions, we attempted to show the cost of a deficit-financed $1 over time, as a rebuttal to Nancy Pelosi’s flawed analysis. There we used an interest rate of just 4%. But what if interest rates were to suddenly rise to 8%, something which is within the realm of reasonable possibilities? Well, as you can see below, when interest rates rise to 8%, the Pelosi Effect completely disintegrates. You see, while Ms. Pelosi has merely provided the benefit side of what should be a cost-benefit analysis, like-minded Americans are thinking about the cost.

Click to Enlarge

Well, with an interest rate of 8%, the benefit of Ms. Pelosi’s dollar disappears in just 7 to 9 years, when the cost, with financing, will then be between $1.71 and $2.00. In just 30 years the cost rises to $10.06. In 40 years the cost more than doubles to $21.72. In 50 years, it more than doubles again to $46.90. And at the end of 100 years, the cost to the treasury of just one additional deficit-financed dollar will be as much as $2,199.76. It’s highway robbery. It’s not even necessary to chart the next two centuries, as the nation will have been reduced to ashes in under 50 years. And moving forward, heaven forbid that interest rates should ever exceed 8%.

Excuse me, but when a politician, who is already personally responsible for adding over $5 trillion to the national debt in just four years, attempts to explain that borrowing just one more dollar (hundreds of billions more as is the case) will somehow add a benefit of $2 to the economy, and omits the most important part, the cost, she deserves to be swinging in the public square. Has the $5 trillion she has already flushed down the toilet returned two-fold as of yet? If so, then why hasn’t her debt been paid off, or why hasn’t our gross domestic product suddenly risen by $5 to $10 trillion? If not, then one can only conclude that this woman is a fraud, and should, at the very least, spend the rest of her days in a federal penitentiary. Nancy Pelosi is a fraud.

Photo Credit: Last public execution at Tyburn Gallows in London

Rational Expectations and Irrational Intentions

π is an irrational number

The Pelosi Effect Revisited

– by: Larry Walker, Jr. –

“It has been said that we judge others by their actions, but judge ourselves by our intentions.” ~ The Philippian Jailer

On October 6, 2010, Lame Duck Speaker of the House of Representatives, and Democrat, Nancy Pelosi said, “For every dollar a person receives in food stamps, $1.79 is put back into the economy. It is the biggest bang for the buck when you do food stamps and unemployment insurance. The biggest bang for the buck.” Now she’s boasting that for every dollar spent on unemployment and food stamps, $2.00 is put back into the economy. But as we pointed out in Rational Expectations vs. Obamanomics, “According to the theory of rational expectations, it is impossible to calculate the effect of deficit-financed government spending on demand without specifying how people expect the deficit to be paid off in the future.”

So okay let’s pretend that it’s true that every dollar the government spends on unemployment and food stamps magically doubles across the economy. There is just one major problem with the Pelosi Effect. Since the initial dollar was borrowed, and interest payments on the debt are effectively being borrowed as well, that same dollar will wind up costing the government $2.03 within 18 years, and may wind up costing in excess of $1,355,196.11 over time.

The cost of a deficit-financed dollar will double to $2.03 in about 18 years at an interest rate of 4.0%. Since we are not paying down the national debt, and are in effect borrowing further to make the interest payments, the cost will continue to rise over time. By the 29th year the cost of that dollar will be $3.12. By the 37th year it will have cost $4.27. By the 100th year the cost skyrockets to $50.50. And finally, by the 360th year that same dollar will have cost a total of $1,355,196.11, ad infinitum (see chart and table below).

You see, it is one thing for the government to spend a dollar from surplus, but entirely another when that buck has been deficit-financed. Thus, the effect that the proposed spend and spend package will have on demand will most certainly not be positive. It all points back to the importance of not spending what you don’t have (i.e. PAYGO). What happened to that theory? With the national debt currently at $13.8 trillion, and growing by $5 billion per day; how is it ever to be repaid when hundreds of billions more is recklessly piled on with every whim? Lady, please!

Apparently the word compromise means payoff rather than paygo. One can only imagine how much that elusive deficit reduction plan will cost [sarc]. Oh give me a break!

_______________________________

Note – The dollar never gets fully returned to the government, or to the recipient of benefits. In the near term, unemployment is partially taxable, but the most the government will get back in taxes is 10%. The recipient will only effectively be receiving 90 cents due to federal income taxes, and less when you factor in State taxes (in Georgia that would be 85 cents). So we’re back to around $1.70 (0.85 * 2) added to the economy rather than $2.00. Then once the recipient has spent the money it’s gone. Unless they are able to find a job within 13 months they will be knocking again, ad infinitum. First 99 weeks, then 56 more, and the debt grows on, and on, and on…….

Ill-Conceived Stimulus Threatens to Gum Up Recovery

Government Revenue Growth Surpasses Spending

– by: Larry Walker, Jr. –

Here we go again. At a time when government revenues are actually growing faster than spending, in step the clueless to gum it all up again. Sure, we still have a spending problem, but the cure is not more of the disease. Lawmakers always attempt to solve what they perceive to be a problem, well after self-correction has begun, and in all their ill-conceived efforts always manage to muck things up. In the present lame-duck session, all that the people asked is for tax rates to remain constant. That’s all we requested, and that’s all that’s needed at this moment in time. But instead, politicians are still playing around with the failed stimulus ideal, a policy which has never worked in American history. The truth is that with tax rates at present levels, revenues have already begun to surpass spending on a percentage basis. Government revenues have been growing faster than spending since the 2nd quarter of 2009.

The following chart, courtesy of the Bureau of Economic Analysis shows that government revenues are currently growing at a faster rate than spending (click to enlarge).

Government Spending and Revenues (% Change)

The chart below (click to enlarge) shows the discrepancy between revenues and spending in dollars. Clearly what’s needed is for spending to decline while revenues remain constant.

Government Spending and Revenues ($ Change)

In my piece entitled, “Untimely and Proven to Fail”, the myth behind government stimulus programs was clearly exposed. During the most recent recession, at the end of 2007, economists recommended stimulus spending as a means of averting a full blown recession. In order to work successfully, such a stimulus needed to be large enough; timely, targeted, and temporary. Although such a plan was implemented, by the time tax refunds began to reach taxpayers, in April of 2008, economists declared that it was too late, and that recession was then unavoidable. In February of 2009 a second stimulus was enacted, well after the recession had begun, and nearly at the time it was over. What was the point? The only purpose of an economic stimulus program, although one has never actually worked, is to avoid a recession. Once a recession has commenced, an entirely different set of policies is required.

What is called for in our present crisis is both a reduction in government spending, and stability in tax rates. Although reductions in income tax rates worked in the 1960’s, 1980’s and 2000’s, the present administration did not appear to actually want to improve the economy when it had the chance. Instead, progressives have been fixated on gumming things up in order to achieve what they claim are more noble goals. What lawmakers have proposed in lieu of a common sense compromise is more temporary stimulus. Where government errs is that businesses don’t respond to temporary policies. We are focused on the long-term. If we could see a coherent tax plan, one in which tax rates remain stable for some period and then eventually decline, there would be stability and growth. The Bush tax cuts were gradual in nature and, like Reagan’s plan, culminated in the lowest rates at the end, while the current administration is still playing around with temporary policies which lead to an uncertain end. Taxpayers can only suspect that in the end, we’ll all get screwed.

In an August 2004 article of the Journal of Political Economy, two UCLA economists said they figured out why the Great Depression dragged on for almost 15 years, and they blamed a suspect previously thought to be beyond reproach: President Franklin D. Roosevelt. After scrutinizing Roosevelt’s record for four years, Harold L. Cole and Lee E. Ohanian concluded that the New Deal policies signed into law 77 years ago thwarted economic recovery for seven long years. Ohanian and Cole blamed specific anti-competition and pro-labor measures that Roosevelt promoted and signed into law June 16, 1933.

“Why the Great Depression lasted so long has always been a great mystery, and because we never really knew the reason, we have always worried whether we would have another 10- to 15-year economic slump,” said Ohanian, vice chair of UCLA’s Department of Economics. “We found that a relapse isn’t likely unless lawmakers gum up a recovery with ill-conceived stimulus policies.”

“The fact that the Depression dragged on for years convinced generations of economists and policy-makers that capitalism could not be trusted to recover from depressions and that significant government intervention was required to achieve good outcomes,” Cole said. “Ironically, our work shows that the recovery would have been very rapid had the government not intervened.”

In conclusion, while policymakers should be focused on a plan which will reduce spending, and remove uncertainty, as the Fiscal Commission has already spelled out; instead what we are being served is another $700 to $900 billion stimulus program, this time three years after the fact. A lame-duck session is not a good time to consider a long-term strategy. All that we asked for was that tax rates remain stable until a solid plan may be implemented next year. We did not request another economic stimulus, but rather a stay, in order to remove the present cloud of unusual uncertainty. Will we ever have a government who gets it? I would rather see the current proposal fail and have tax rates rise for the first couple of weeks in 2011, than be herded into more bad policy by a bunch of incompetent lame ducks. Isn’t this why they lost in the first place?