Phantom Tax Credit for Elderly and Disabled

A Tax Credit in Name Only (TCNO)

– By: Larry Walker, II –

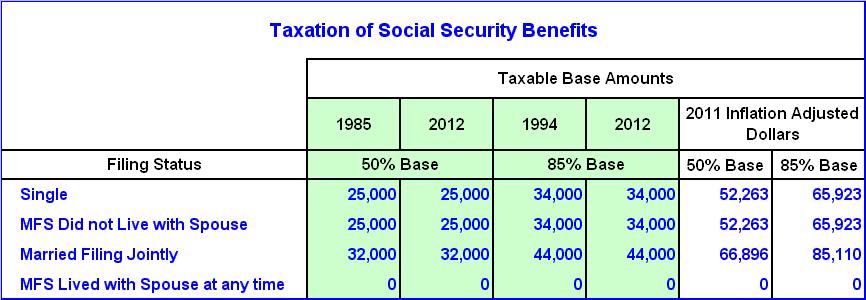
A couple of weeks ago I wrote about how during this year’s continuing education courses it suddenly dawned on me that the base amounts used in calculating the taxability of social security benefits are exactly the same in tax year 2012 as they were in 1985. Well here’s another example of elder abuse. Congress has failed to inflation adjust the limitations on the Credit for the Elderly or the Disabled since it was last upgraded back in 1984. I am frankly surprised that this credit is still around, since in its present form it’s completely useless to 99.999% of taxpayers. Why is it still taking up space in IRS instruction booklets?

Back in 1981, when my study of tax law began, it was known simply as the Credit for the Elderly. It initially applied to persons over the age of 65, or under 65 if they had taxable income from a public retirement system. In tax year 1984 it became known as the Credit for the Elderly and the Permanently and Totally Disabled. It was also in 1984 that the same limitations that are in place today were established. Since 1988 it has been known simply as the Credit for the Elderly or the Disabled.

Although it sounds appealing, due to the failure to adjust for inflation, it has become a tax credit in name only (i.e. completely useless). How’s that, you say? Well, like I said, its name may have changed over the years, but the initial amounts and income limitations have not.

Maximum Credit

The maximum amount of the credit is limited to 15.0% of the following initial amounts, based on one’s filing status. (Note: For the disabled, the initial amounts used in calculating the tax credit cannot be more than the amount of the taxpayer’s taxable disability income.)

  • $5,000 if Single, Head of Household or Qualifying Widow(er)

  • $7,500 if Married Filing Joint and both spouses qualify

  • $5,000 if Married Filing Joint and only one spouse qualifies

  • $3,750 if Married Filing Separate and you did not live with your spouse at any time during the tax year.

Thus, on paper, the maximum amounts of this nonrefundable tax credit (at 15.0% of the initial amounts) are limited to the following:

  • $750 if Single, Head of Household or Qualifying Widow(er)

  • $1,125 if Married Filing Joint and both spouses qualify

  • $750 if Married Filing Joint and only one spouse qualifies

  • $562.50 if Married Filing Separate and you did not live with your spouse at any time during the tax year.

Since this is a nonrefundable tax credit, even if you are magically somehow able to qualify, you can only actually use the credit if you have a regular income tax liability. In other words, the credit cannot be used to offset self-employment taxes, penalties on retirement distributions, or other taxes found on lines 56 to 60 of Form 1040. The credit is figured on Schedule R and entered on line 53 of Form 1040.

Limitations

It sounds fantastic, and maybe it was in 1984. But since hardly anyone can qualify for the credit anymore, it’s really meaningless today. The main problem here is that the same income limitations in place in 1984 are in effect in 2012. So who can qualify today?

If your adjusted gross income (AGI) is equal to or greater than the following amounts, then you do not qualify for the tax credit.

  • $17,500 if Single, Head of Household or Qualifying Widow(er)

  • $25,000 if Married Filing Joint and both spouses qualify

  • $20,000 if Married Filing Joint and only one spouse qualifies

  • $12,500 if Married Filing Separate and you did not live with your spouse at any time during the tax year.

Additionally, if the nontaxable part of your Social Security and other nontaxable pensions is greater than the following amounts, you are also excluded from the credit. No, really.

  • $5,000 if Single, Head of Household or Qualifying Widow(er)

  • $7,500 if Married Filing Joint and both spouses qualify

  • $5,000 if Married Filing Joint and only one spouse qualifies

  • $3,750 if Married Filing Separate and you did not live with your spouse at any time during the tax year.

Finally, if one-half of your Excess Adjusted Gross Income (defined as adjusted gross income minus the following limits), plus the nontaxable portion of your pensions is greater than the initial amount of the credit, you are also disqualified.

  • $7,500 if Single, Head of Household or Qualifying Widow(er)

  • $10,000 if Married Filing Jointly

  • $5,000 if Married Filing Separate and you did not live with your spouse at any time during the tax year.

In other words, you must reduce the initial amount of the credit, by one-half of your Excess AGI and your total nontaxable pensions.

The Problem

Think inflation. The average monthly Social Security benefit for a retired worker was about $1,230 at the beginning of 2012. So a single retiree with an average benefit would receive around $14,760 per year. A married couple with an average benefit would receive around $29,520 per year. So with that, let’s see whether or not it’s even possible to qualify for this tax credit.

Example 0: Let’s say you are single, over the age of 65, and receive social security benefits of $14,760. Since social security isn’t taxable until half of your social security plus your other income (both taxable and tax exempt) exceeds $25,000, if that is your only source of income, then none of it is taxable, and the Credit for the Elderly or the Disabled doesn’t apply. So let’s try to figure out the precise circumstances under which the credit does apply.

  1. In order for 50% of your social security benefits to be taxable, your income from other sources (both taxable and tax exempt) must be greater than $17,620 [17,620 + 7,380 (½ of social security benefits) = $25,000].

a) But if this is the case, then your adjusted gross income is also likely to be more than the AGI limit of $17,500, so you will not qualify for the credit.

b) And since only half of your social security is taxable, because the nontaxable portion of $7,380 (14,760 / 2) is greater than the $5,000 limit for nontaxable pensions, you don’t qualify.

c) Also, since your adjusted gross income is likely greater than $17,500, subtracting the limit for excess adjusted gross income of $7,500 leaves $10,000, which when divided by 2 is equal to or greater than the initial amount of $5,000, which means you don’t qualify. Got it?

  1. In order for 85% of your social security benefits to be taxable, your income from other sources (taxable and tax exempt) must be greater than $26,620 [26,620 + 7,380 (½ of social security benefits) = $34,000]. But then, you are also likely disqualified due to both (a) and (c) under #1 above. Got that?

  1. And there’s another problem. Because the standard deduction for a single person over the age of 65 in 2012 is $7,400 [5,950 + 1,450], and the personal exemption allowance is $3,800, your adjusted gross income must be greater than $11,200 to even have an income tax liability. In other words, if your adjusted gross income is under $11,200, you don’t qualify. But if your AGI is between $11,200 and $17,500, and the nontaxable portion of your social security benefits is less than $5,000 (item #1 (b)), then you might qualify.

a) However, if your AGI is between $11,201 and $17,499, then in this example, the nontaxable portion of your social security benefits will be greater than $5,000 which disqualifies you under item #1 (b).

  1. Even if you don’t receive social security, and the nontaxable portion of your other pension income is less than the $5,000 limit, when calculating the credit, you must then subtract one-half of your excess AGI plus your nontaxable pensions, from the initial credit amount, in order to determine your limited tax credit. So at the low end, your Excess AGI would be $3,700 (11,200 – 7,500), and at the high end it would be $10,000 (17,500 – 7,500). But this poses further problems.

a) The initial amount of your tax credit is limited to $5,000, but this must be further reduced by one-half of your excess AGI, which will either be $1,850 (3,700 / 2) at the low end, or $5,000 (10,000 / 2) at the high end, plus the nontaxable amount of your pensions (i.e. up to $5,000). So at the low end, assuming a nontaxable pension of $5,000, the initial amount of your credit is limited to -0- (5,000 – 1,850 – 5,000), and at the high end it is also reduced to -0- (5,000 – 5,000 – 5,000).

  1. Finally, if none of your income is from social security, you don’t have any other nontaxable pensions, and assuming all other criteria are met, then in order to qualify for the tax credit, the adjusted gross income of a single taxpayer is limited to being between $11,201 and $17,499. Simple, right?

a) However, since the amount of the actual tax credit is further limited to 15.0% of the initial amount (after the reduction of one-half of excess AGI), the maximum amount of the credit can be no greater than $472.50 [(5,000 – ((11,201 – 7,500) / 2)) * 15.0%], and this would be further limited to the amount of income tax actually owed.

b) At the low-end, a single retiree with AGI of $11,201 qualifies for the maximum credit of $472.50 [(5,000 – ((11,201 – 7,500) / 2)) * 15.0%], but would have an income tax liability of $0 [(11,201 – 11,200) * 10.0%]. Thus, the credit is useless.

c) In the mid-range, a retiree with AGI of $14,350 would have a tax liability of $315 [(14,350 – 11,200) * 10.0%], and would qualify for a tax credit of $236 [(5,000 – ((14,350 – 7,500) / 2)) * 15.0%]. That would about cover the cost of calculating this monstrosity.

d) At the high-end, a retiree with AGI of $17,499 would have a tax liability of $630 [(17,499 – 11,200) * 10.0%], and would qualify for a tax credit of $0 [(5,000 – ((17,499 – 7,500) / 2)) * 15.0%]. Thus, the credit is once again useless.

Summary: In order for a single retiree to qualify for the Credit for the Elderly or the Disabled, his Adjusted Gross Income must fall between $11,201 and $17,499, and he must either not be on social security, or the nontaxable portion of his combined pension income must be less than $3,150 (5,000 – 1,850). The mid-range amount of the final tax credit for such a rare individual would be around $236 (between -0- and $472.50), while the maximum credit would only be available against an income tax liability of -0-. Thus, in order to qualify for the optimal credit, a single retiree would have to have an adjusted gross income of around $14,350, with no income from social security and no other nontaxable pension income.

The results for married couples and the disabled are similar. The example above is just a long way of proving that the Credit for the Elderly or the Disabled has become obsolete due to the failure of Congress to adjust its 1984 initial amounts and limitations for inflation.

Solution

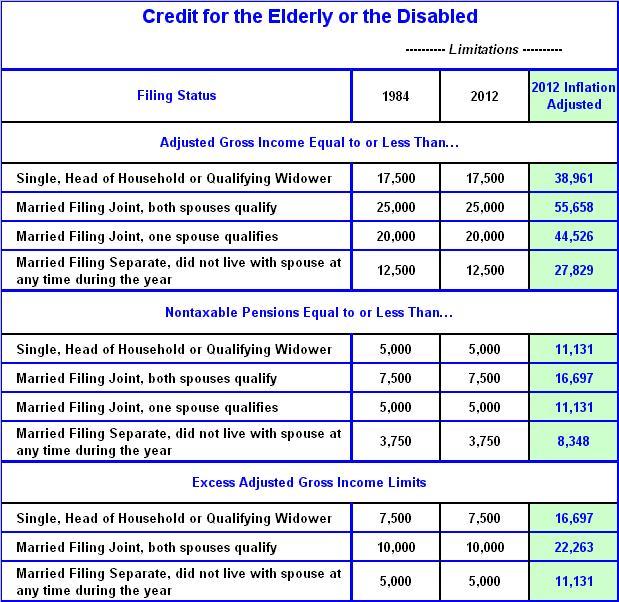
The table below shows the limitations in force in 1984 and 2012, along with the inflation adjusted amounts. As you can see, a simple inflation adjustment would more than double the income limitations, likely causing at least some elderly and disabled taxpayers to qualify. So why hasn’t this been done? Is it too hard, or has Congress simply forgotten?

The maximum amount of the credit would increase to 15.0% of the following initial amounts, based on filing status. (Note: For the disabled, the initial amounts used in calculating the tax credit cannot be more than the amount of the taxpayer’s taxable disability income.)

  • To $11,131 from $5,000 if Single, Head of Household or Qualifying Widow(er)

  • To $16,697 from $7,500 if Married Filing Joint and both spouses qualify

  • To $11,131 from $5,000 if Married Filing Joint and only one spouse qualifies

  • To $8,348 from $3,750 if Married Filing Separate and you did not live with your spouse at any time during the tax year.

Thus, on paper, the maximum amounts of the nonrefundable credit (at 15.0% of the initial amounts) would increase as follows:

  • To $1,670 from $750 if Single, Head of Household or Qualifying Widow(er)

  • To $2,505 from $1,125 if Married Filing Joint and both spouses qualify

  • To $1,670 from $750 if Married Filing Joint and only one spouse qualifies

  • To $1,252 from $562.50 if Married Filing Separate and you did not live with your spouse at any time during the tax year.

Now that’s more like it. It’s not all that, but it’s better than what we have today. Inflation Indexing should be an integral part of tax reform. It’s not right to screw our seniors and disabled out of a tax credit, when an automatic adjustment is granted in other areas of the tax code. We should have more respect for the elderly and disabled.

The following example is based on one used by the IRS. It calculates the tax credit before and after the proposed inflation adjustments:

Example 1 (before) – You are 66 years old and your spouse is 64. Your spouse is not disabled. You file a joint return on Form 1040. Your adjusted gross income is $14,630. Together you received $3,200 from social security, which was nontaxable. You figure your credit as follows:

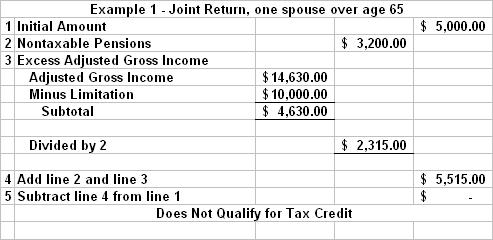
You cannot take the credit since your nontaxable social security (line 2) plus your excess adjusted gross income (line 3) is more than your initial amount on line 1.

Example 1A (after) – The same circumstances as in example 1, except that all limitations have been adjusted for inflation.

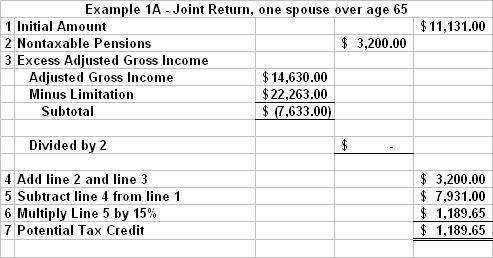
Your potential tax credit is now $1,189.65 which will be limited by the amount of income tax shown on line 46 of your Form 1040 tax return.

Example 1B – This is the income tax calculation for the couple in Examples 1 and 1A.

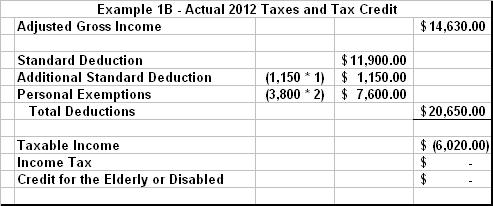
Since the sum of the taxpayers’ standard deduction, additional standard deduction for one spouse being over the age of 65, and the deduction for personal exemptions are greater than their adjusted gross income; the taxpayers’ do not have a tax liability. Thus, in this case, although they qualify for the tax credit in Example 1A, they are not able to, and do not need to use it. However, what’s changed is that after the inflation adjustment, the couple could potentially have up to $38,000 of adjusted gross income (or around $24,000 more than in the example) and still qualify for the tax credit.

Conclusion

The Credit for the Elderly or the Disabled is a Tax Credit in Name Only (TCNO). In its present state it is completely useless to 99.999% of Americans. It’s easier for a camel to go through the eye of needle than to qualify for this phantom credit. Its initial amounts and limitations should immediately be adjusted for inflation (although the numbers probably need a bit more tweaking). If Congress refuses to make these simple adjustments, then all references to this tax credit should be purged from the Internal Revenue Code, from all income tax forms and publications, and from the IRS’s computers. It costs money to print B.S., and frankly, it’s a waste of time to calculate and explain to a senior or disabled person why they are not qualified.

Related:

Taxing Social Security Taxes

#Taxes

References:

U.S.Inflation Calculator

2012 Schedule R

2000 Schedule R

1990 Schedule R

1985 Schedule R

1984 Schedule R

1983 Schedule R

1981 Schedule R

1980 Schedule R

The Fiscal Responsibility Cliff

Talk About Crazy Bastards…

– By: Larry Walker, II –

Hiking tax rates now, in advance of the pending 2013 Medicare Tax Increase from 2.9% to 3.8% on those making $200K ($250K if married), the new 3.8% Medicare Tax on Investment Income including capital gains, the 2014 health insurance tax on individuals of $695 to $2,085 (plus inflation) depending on family size, and the 2014 shared responsibility penalty of $2,000 per employee on companies with 50 or more part-time employees (working 30 hours or more), probably isn’t wise. Legislator’s must pare any further tax increases with the hikes already baked in the cake.

Many of the provisions commonly referred to as the Bush Tax Cuts were phased in gradually between 2003 and 2010 culminating in maximum favorability in 2010. Since Congress has already extended these temporary provisions for two years, I would have no problem with returning to the pre-2008 tax law right now (i.e. the laws in effect prior to the Stimulus package which only added to the current morass). I would hesitate to call removing the 2010 concessions and Stimulus subsidies a tax hike, because each were designed to be temporary in nature, not extended ad infinitum. However, if Congress insists on raising income tax rates, then any such increases should be gradual (i.e. phased in over a 7 to 10-year period), not jammed in all at once.

Lawmakers should be careful not to turn a blind eye to what’s already beneath the icing while cooking up the next barrage of tax law changes. In my opinion, the Obama Administration is not qualified to address income tax matters; it lacks mathematical fortitude. Its words are mere noise, good for little more than forefinger exercise in locating the mute button, at least for me. You crazy bastards have already screwed up everything for three years in a row. We really don’t have the time or patience for anymore of this nonsense. You’ve talked enough. It’s time to get off the T.V. shows and do some work. Step one should be a mandatory crash course in income tax law for all legislators and the White House. You really should take a timeout to contemplate the monstrosity you’ve already created before making another move.

References:

Under Obamacare, Medicare Double Taxation Begins in 2013

Obamacare’s Effect on Small Business

Get ready to fill out Obamacare’s individual mandate tax form

IRS issues proposed regs. on 3.8% net investment income tax

Proposed regulations – Net investment tax

Related: #TAXES

Tax Fairness | Reverse Parity

It’s Magic!

– By: Larry Walker, II –

The current 2012 Tax Rate Schedule is shown below. Applying the Obama-Doctrine, single filers making over $200,000, and married filers making over $250,000 would get a tax hike. However, since there is no cut-off at either $200,000 or $250,000 in the current tax rate schedule, the 33% bracket would need to be split, resulting in a sharp tax increase for a handful of unfortunate individuals.

Thus, taxpayers with taxable incomes between $200,000 ($250,000 if married) and $388,350 would see their taxes rise by 20%, while those with incomes over $388,350 would get that plus a marginal increase of 13.1% on income above the new ceiling (see tables below).

So what’s the effect?

We’ll use the married filing joint filing status in the following examples to determine the overall effect.

# 1 – If you’re married and have taxable income of $400,000, your taxes will increase by 19.4%, or by $9,667.

# 2 – If you’re married and have taxable income of $1,000,000, your taxes will increase by 14.3%, or by $37,267.

# 3 – If you’re married and have taxable income of $10,000,000, your taxes will increase by 13.2%, or by $451,267.

# 4 – If you’re married and have taxable income of $20,000,000, your taxes will increase by 13.2%, or by $911,267.

# 5 – If you’re married and have taxable income of $100,000,000, your taxes will increase by 13.2%, or by $4,591,267.

What’s wrong with this picture?

First of all, those with taxable incomes below $200,000 ($250,000 if married) get to keep the tax rates they’ve had for the last 10 years, plus all the other garbage in the tax code, which is being called –– a tax cut. So in other words, for 95% of Americans, nothing is the new something.

Secondly, those who already pay the highest tax rates will receive a 13.2% to 20.0% tax hike, which is being called –– fair. However, tax rates will go up the most not on millionaires and billionaires, but rather on single individuals with taxable incomes between $200,000 and $388,350 and married couples with taxable incomes between $250,000 and $388,350.

So why not just admit it? This isn’t a tax cut for the middle-class. And it’s not so much a tax hike on millionaires and billionaires. What it represents is a massive tax hike on those with taxable incomes between $200,000 ($250,000 if married) and $388,350, and a more modest hike on millionaires and billionaires. Got it?

If a top marginal rate of 33% has been proven to raise more revenue than higher rates, due to the Laffer Curve (see video: Do High Taxes Raise More Money?), then why are we even talking about raising rates above the 35% mark? Aren’t rates already too high? Couldn’t we achieve the same parity by keeping top rates where they are and simply cutting tax rates on the 95% of Americans with incomes below the new ceiling? Why, yes we could. And here’s what the new tax rate schedule would look like if we were to do just that.

The 10%, 15%, 25%, 28% and 33% brackets are reduced by 13.2% (the same amount of increase currently being proposed on the wealthy), and are thus lowered to 8.7%, 13.0%, 21.7%, 24.3% and 28.6%. Note that the 35% bracket is still lowered to include those with taxable incomes over $200,000 ($250,000 if married), so that those making between $200,000 ($250,000 if married) and $388,350 will still see a modest increase of around 6%, but isn’t this the group we we’re trying to screw anyway? Yep! So there you go.

You say, “But what will your plan do for the deficit”? I say, what does the one on the table do for the deficit? Score them both dynamically (skip the static nonsense) and see which plan raises more revenue in the long-term. Not that it really matters though, since the main goal here is fairness, right? Well, that’s what my plan achieves.

Reverse Parity Tax Effects

So here’s how the Obama-Doctrine stacks up against the reverse parity plan. At current tax rates, married taxpayers filing jointly pay the following taxes (see table below).

Under the Obama Doctrine, married taxpayers filing jointly get nothing at taxable incomes below $250,000, and realize a 13.1% (rounded down) tax increase at upper levels. This means income tax burdens would increase by $451,267 to $4,591,267 for those with taxable incomes between $10,000,000 and $100,000,000, respectively (see table below).

But under the Reverse Parity Plan, married taxpayers filing jointly will realize a 13.2% tax cut at taxable incomes below $250,000, and only negligible savings at upper levels. This means income tax burdens will decrease by $875 to $7,842 for married couples with taxable incomes between $50,000 and $250,000, respectively (see table below). At the same time, income tax burdens will fall by $5,074 for those with taxable incomes over $1,000,000, representing a negligible decline.

It’s the same thing the White House is striving for, except in reverse. The big difference is that under the reverse parity plan the middle-class gets a genuine tax cut, not just smoke and mirrors, while the upper-class pays an effectively higher tax rate, roughly 13.1% more than those with taxable incomes under $200,000 ($250,000 if married), and this is achieved without actually raising tax rates. The only exception, of course, is those poor saps stuck between taxable incomes of $200,000 ($250,000 if married) and $388,350, but that’s life, right?

It’s real simple. If ‘no change’ for 95% of Americans can be deemed a tax cut, then ‘no change’ for the remaining 5% can likewise be deemed a tax hike. It’s magic! Ninety five percent of taxpayers receive a stimulative tax cut, the top five percent get nothing, the Laffer Curve is respected, and fairness is restored. Problem solved. Now it’s time to tackle the real problem, those elusive spending cuts.

Related:

Taxing Social Security Taxes

#Taxes

Taxing Social Security Taxes

The Fiscal Responsibility Cliff

– By: Larry Walker –

When I went to work for the IRS back in 1988, the first few weeks were spent in tax law courses. I distinctly remember, at the time, that the base amounts used in determining the taxability of Social Security benefits were $25,000 for single taxpayers and $32,000 for married taxpayers filing a joint return. For some reason when the topic came up this year, during annual continuing education, with all the talk of looming fiscal responsibility (errantly referred to as a cliff), combined with having been read the riot act by several seniors over the past year, it suddenly dawned on me that the base amounts are exactly the same in tax year 2012 as they were in 1985 –– $25,000 and $32,000. What’s wrong with this picture? The same thing that’s wrong with Barack Obama’s $250,000 top tax bracket argument, a failure to adjust for inflation.

My first brush with tax law was actually through a Junior College course in 1981. I helped prepare tax returns commercially for several years thereafter while attending college. Needless to say, I left the IRS in 1994 and moved on to brighter horizons. I returned to my first love in the year 2000 and am still involved in the industry today. With that out of the way, what’s both interesting and disturbing to me is the fact that Social Security benefits were tax-free prior to 1985, but then Congress, in its wisdom, changed the law to ensure that wealthy seniors were paying their fair share, which by my logic merely amounted to forcing them to pay taxes on the taxes they had already paid.

It was in 1985 that a neat little formula was devised whereby if one-half of a taxpayers Social Security benefits plus their other income (both taxable and tax-exempt) was more than the base amount (mentioned above), then up to half of their Social Security benefits would become taxable. As a consolation, if a senior’s sole source of income was Social Security, in other words if they were living near or below the poverty line, then none of the benefits were taxable.

According to the formula, if you are single or married filing separate and did not live with your spouse for the entire year, the base amount is $25,000. If you are married and file a joint return, the base amount is $32,000. And if you are married filing separate but lived with your spouse at anytime during the year, the base amount is $0. To determine how much of your benefits are taxable, you add one-half of your Social Security benefits to other income received from pensions, interest, dividends, capital gains, rental income, business income, tax-exempt interest, etc…, and then subtract from this the applicable base amount. If the result is positive, then the taxable amount of your Social Security benefits is the lesser of one-half of the result, or one-half of your Social Security benefits. Got it?

The obvious dilemma is that the base amounts are exactly the same today as they were in 1985 –– $25,000 and $32,000. Something is deftly wrong with this, because when adjusted for inflation the base amounts become $52,263 and $66,896. That’s a material difference, more than double. In my opinion, if Congress would simply index all limitations, base amounts and tax brackets for inflation (the AMT comes to mind), then the U.S. income tax system would be fair, but as it stands today for many it is not.

Making matters worse, beginning in 1994 Congress decided to up the ante. Taxing 50% of Social Security just wasn’t enough for really rich old folks, so Congress added a second set of base amounts, whereby up to 85% of benefits could become taxable. To distinguish wealthier seniors from the rest, the original base amounts were raised by $9,000 for single filers and by $12,000 for joint filers. Thus, if one-half of your Social Security benefits, plus other income (both taxable and tax-exempt) was greater than $34,000 or $44,000, respectively, then up to 85% of the difference, or 85% of your Social Security benefits were taxable, whichever was less. The same amounts are in force today. There has been no inflation adjustment to the 85% base amounts since 1994.

If the 50% and 85% base amounts were rightly adjusted for inflation, then the former would rise from $25,000 and $32,000, to $52,263 and $66,896; and the latter would increase from $34,000 and $44,000, to $65,923 and $85,110 (see table below).

Now that’s more like it. It’s not all that, but it’s better than what we have today. Inflation Indexing should be an integral part of tax reform. It’s not right to screw our seniors out of money, when an automatic adjustment is granted in other areas of the tax code. We should have more respect for our elders. But even though my proposal would be an improvement, still the premise behind taxing Social Security benefits is errant.

Can you understand why so many seniors complain? Here’s what one fellow said to me recently, “What do you mean 85% of my Social Security is taxable? It wasn’t taxable at all last year. Just because I was finally able to make a little extra money this year, you mean to tell me that now I have to pay half of what I made in taxes? You’re telling me that I’m going to owe about half of what I’ve been able to save this year in taxes. I paid into the system my whole life, that money should be tax free. I might as well just stop working if I’m going to owe half of what I make in taxes, but then how am I supposed to live?”

I basically agreed with him. What he said is true. If you are self-employed and on Social Security, and make around $50,000 on the side, by the time you add in 85% of your Social Security benefits, $50,000 suddenly becomes $60,000 or more. Then when you add together the applicable self-employment taxes, federal income taxes and state taxes, the marginal tax rate quickly approaches 50%. I opined that I think anyone over 65 should be exempt from paying into Social Security while they are receiving benefits, and that the benefits should be tax free. I qualified this by adding that I don’t write the laws, I just apply them.

Congress should recall that we pay Social Security taxes in order to receive a basic subsistence in the future. The Social Security taxes we pay are a tax. Then the federal government has the nerve to turn around and tax seniors on the taxes they have already paid throughout their lives. In effect, what seniors are asked to do is pay a tax on a tax. How much sense does that make in the era of fair this and fair that? You have to admit that this is messed up. So fix it! It’s real simple.

Congress should either increase the Social Security base amounts for inflation, or go back to the pre-1985 policy making Social Security benefits non-taxable, and let the cards fall where they may. Make a choice and live with it. Anyone in Congress, or the White House who doesn’t have a clue about what’s in the current tax law, should study up, shut up, or just resign. Anyone who takes the time to examine what’s actually in the Code will come to the realization that some of this stuff is completely ridiculous. Under current law, it is entirely possible to make over $250,000, write it all off through new equipment purchases, other credits and gimmicks, and end up paying nothing in taxes. Yep, that’s right!

In my opinion, what we need to do is get rid of all of the temporary 2010 provisions including –– repeal of the Personal Exemption Phase-Out (PEP), repeal of the Itemized Deduction Limitation (Pease), 0% Capital Gains Tax, expanded Child Tax Credit, expanded Dependent Care Credit, increased Adoption Credit, increased Earned Income Credit, refundable Education Credit, Alternative Minimum Tax (AMT) patch, Bonus Depreciation, extended Section 179 Deduction, Payroll Tax Cut, and the vast array of Energy Tax Credits, and then go back to the 1986 Code and adjust all limitations, base amounts and tax brackets for inflation. In most cases, just like with Social Security benefits, the results will favor those who are the most deserving. We got by without this chaos before 2010, and we can get by without it today.

Fiscal responsibility isn’t a cliff, it’s an opportunity to correct our errant ways. Respect your elders. By the way, the notion of lowering the top income tax bracket from the current inflation adjusted amount, to the 1993 unadjusted top bracket of $250,000 is equally offensive. That’s not forward thinking. In fact, it’s so backwards it’s laughable. Think inflation!

References:

U.S. Inflation Calculator

1985 IRS Publication 915

1993 IRS Publication 915

1994 IRS Publication 915

2011 IRS Publication 915

Related:

Obama’s 1950s Tax Fallacy

From AAA to AA- in Four Years

The New National Curse

– By: Larry Walker, Jr. –

In the year 2009 double-dealing returned to Washington, DC. Shortly after his inauguration, President Barack Obama pledged to cut the nation’s annual budget deficit in half by the end of his first term. At the time, he identified exploding health-care costs as the chief culprit behind rising federal deficits. He warned that the country could not continue its current rate of deficit spending without facing dire economic consequences. He said, “I refuse to leave our children with a debt they cannot repay. … We cannot and will not sustain deficits like these without end. … We cannot simply spend as we please.” Yet within four short years, the USA’s sovereign credit rating has been downgraded three times, from AAA to AA(+) on August 5, 2011, to AA on April 15, 2012, and again to AA(-) on September 14, 2012.

Talk is cheap. By September 20, 2012, after 44 month’s of empty words, health care costs have continued to rise. Having risen by 3.9% in 2010, health care costs are expected to rise by another 7.5% in 2013, or more than three times the projected rates for inflation and economic growth. As if this wasn’t bad enough, the national debt has exploded by $5,387,546,974,859 in the last 44 months, resulting in an average annual increase of $1.5 trillion, versus an average of $612.4 billion during the presidency of George W. Bush (see chart below). And there are still four month’s to count until inauguration day.

National Debt: The National Curse

“I am one of those who do not believe that a national debt is a national blessing, but rather a curse to a republic; inasmuch as it is calculated to raise around the administration a moneyed aristocracy dangerous to the liberties of the country.”Andrew Jackson

On Jan. 8, 1835, all the big political names in Washington gathered to celebrate what Democratic President Andrew Jackson had just accomplished. The national debt had been paid. It was the only time in history when the U.S. was debt free, and it lasted exactly one year. Back then like today, it wasn’t easy for politicians to slash spending — that is until Andrew Jackson came along.

During the election of 1828, Jackson’s opponents referred to him as a “jackass”. Jackson liked the name and used the jackass as a symbol for a while, but it died out. However, it later became the symbol for the Democratic Party when cartoonist Thomas Nast popularized it. But based upon the growth of the national debt over the past 44 months, the symbol no longer fits, or does it?

“For Andrew Jackson, politics was very personal,” says H.W. Brands, an Andrew Jackson biographer at the University of Texas. “He hated not just the federal debt. He hated debt at all.” Before he was president, Jackson was a land speculator in Tennessee. He learned to hate debt when a land deal went bad and left him with massive debt and some worthless paper notes. Ah, so unlike Barack Obama, Andrew Jackson brought some practical business experience to the White House, just like Mitt Romney will.

When Jackson ran for president, he knew his enemy: banks and the national debt. He called it the national curse. People ate it up. In Jackson’s mind, debt was “a moral failing,” Brands says. “And the idea you could somehow acquire stuff through debt almost seemed like black magic.” Yet if you listen closely to today’s Democratic Party, the national debt is no longer its enemy, but rather the anti-debt, fiscally responsible Tea Party.

Andrew Jackson pledged to pay off the debt. In order to do so, he took advantage of a huge real-estate bubble that was raging in the Western U.S. The federal government owned a lot of Western land — so Jackson started selling it off. He was also ruthless on the budget. He blocked every spending bill he could. “He vetoed, for example, programs to build national highways,” Brands says. “He considered these to be unconstitutional in the first place, but bad policy in the second place.” But nowadays, we hear repeatedly from Barack Obama stuff like, “The House should put aside partisan posturing and pass the measure authorizing $109 billion in spending over two years. So much of America needs to be rebuilt right now. We’ve got crumbling roads and bridges…” In other words, forget about the credit downgrade, borrow and spend now, pay later.

When Jackson took office in 1829, the national debt was about $58 million. Six years later, it was paid in full, and the government was running a surplus. This created a new problem: What to do with all that surplus money? So Jackson decided to divide it among the states. By the way, the phrase “the government was running a surplus” doesn’t mean the same thing as Bill Clinton’s four consecutive annual budget surpluses. Although that was a step in the right direction, the national debt was still over $5.7 trillion when he left office.

Andrew Jackson was a stand up guy, he fulfilled his pledge. But unfortunately, the debt would only remain at zero for one year. By January 20, 2001, the national debt had grown to $5,727,776,738,305. From the time Andrew “Jackass” Jackson paid it off, until the inauguration of Republican President George W. Bush, the national debt grew at an annual average of $34.7 billion over the ensuing 165 years.

Forward: To Insolvency

In the year 2000, George W. Bush was elected on a pledge to cut income taxes. By the end of his term, the national debt had grown by another $4.9 trillion — to $10.6 trillion or at an annual average of $612.4 billion over 8 years. Although in retrospect, most of the Republican Party finds his fiscal record detestable, it is notable that Bush never once pledged to pay down the national debt or cut the federal deficit. In fact the federal government was running at a slight surplus at the time of his election, so the federal budget wasn’t an election year issue. Nevertheless, the USA’s sovereign credit rating remained intact at AAA throughout both of his terms, and its debt-to-GDP ratio averaged around 62.4%.

Finally in the year 2008, under the banner of Hope and Change, along came Barack H. Obama, portending to be all things to everybody. After making a solemn promise to cut the federal deficit in half by the end of his first term, many thought he represented the second coming of old Jackass himself. But instead, from the time of his inauguration the national debt has grown by an additional $5.4 trillion, not only exceeding the Bush presidency, but in double-time. That’s a fact! The national debt now stands at just over $16.0 trillion, having grown at an annual average of $1.5 trillion over the last 4 years. To top it off, the U.S. sovereign credit rating has been downgraded three times on his watch, from AAA to AA(+) on August 5, 2011, to AA on April 15, 2012, and again to AA(-) on September 14, 2012. Meanwhile, the U.S. debt-to-GDP ratio has risen to 104% and is projected to reach 110% a year from today.

Conclusion

As Andrew Jackson put it, the national debt is “the national curse.” In the first 165 years after the debt was paid off in 1835, it rose by an average of $34.7 billion per year. And although it would increase by an average of $612.4 billion over the next eight years, during President Bush’s term, that doesn’t excuse President Obama. Besides, how can we hold Bush accountable for something he never pledged to do? Nonetheless, Barack Obama is on the ballot this year, not Bush. And he pledged to cut the deficit in half during his first term, but it has instead doubled. Your word is your bond.

You might be thinking, “So what? We can’t afford to go back to the failed policies of George W. Bush, because that’s what caused health care costs to spiral out of control, and that’s the reason the debt was so high to begin with.” Yeah, like that makes sense. Stop listening to far-left lies and think for yourself. As a consequence of Barack Obama’s shortsightedness, the USA’s sovereign credit rating has been downgraded three times, from AAA to AA(+) on August 5, 2011, to AA on April 15, 2012, and again to AA(-) on September 14, 2012. Another downgrade or two and U.S. backed securities will no longer be suitable for many bond investors. And what happens when there are more sellers of U.S. backed debt than buyers? Interest rates will skyrocket. And what happens when interest rates rise? Everyone’s borrowing costs will increase, as will the USA’s annual budget deficits.

Now it’s election time, and thus time to decide. Who’s to blame for Obama’s improvidence, Bush, the Republican Party, the Tea Party, or perhaps simply Obama himself? Well, allow me to spell out the American way. If you make a pledge and fail to deliver, there’s no one to blame but yourself. Not only did Obama fail to cut the deficit in half by the end of his first term, but the USA’s annual deficits have more than doubled, and its credit reputation has been trashed. Barack Obama has cursed the nation, and now is the time to cut his career short. And here’s my pledge, if we elect Mitt Romney and he screws up, I will personally help to expel the bum four years from now. But just for today, the ‘jackass’ in chief has got to go.

_____________________________________________________________

Addendum: Ratings History

Egan-Jones rating history for United States Government:

  • 9/14/2012 AA to AA(-)

  • 4/15/2012 AA(+) to AA (Negative outlook)

  • 7/16/2011 AAA to AA(+)

Standard & Poor’s rating history for the United States Government:

  • 08/05/2011 AAA to AA(+) (Negative outlook)

_____________________________________________________________

Photo Credit Via: Greetings Jackass

Has Obama’s Loot-and-Plunder Theory Worked?

A 50-Year Retrospective

– By: Larry Walker, Jr. –

“Socialism is a philosophy of failure, the creed of ignorance, and the gospel of envy, its inherent virtue is the equal sharing of misery.” ~ Winston Churchill ::

Discussing his economic policies at a fundraiser in Oakland, California on July 23rd, Barack Obama, told supporters that, “We tried our plan, and it worked.” Yet, by the end of his first year in office, he had only managed to drag America, kicking and screaming, beyond the point of no return, as our National Debt, on a per capita (per person) basis, surpassed per capita Personal Income for the first time in more than 50 years (see chart above). As of June 30, 2012, after nearly four years of disservice to the nation, under the leadership of Barack Obama, every American now owes $7,958 more in federal government debt, on a per capita basis, than their personal income.

Per Capita National Debt to GDP

Equally alarming, as of June 30, 2012, the U.S. National Debt per capita reached a stunning 101.7% of Gross Domestic Product, an increase of 45.1% since the end of 2008. Looking back over the last half-century, no other President of the United States has done more to destroy our standard of living than Barack Obama. Now if that was his goal, then yes – it worked like a charm. However, this temporary condition will soon meet its demise.

Gross Domestic Product (GDP) is the market value of all officially recognized final goods and services produced within the United States. GDP per capita is considered an indicator of our nation’s standard of living. As of June 30, 2012, U.S. GDP per capita was equal to $49,672. The National Debt is the sum of all previously incurred annual federal deficits. Since deficits are financed by government borrowing, either from the public or from itself, the national debt is equal to all government debt outstanding. As of June 30, 2012, the U.S. National Debt per capita was equal to $50,502.

Thus, it may be stated that, as of June 30, 2012, the standard of living of the United States is negative. In other words, when taken as a whole, on a per capita basis, for the first time in more than a half-century, Americans now owe more in federal government debt than we produce. In effect, there isn’t anything left to address the growing mountain of state and local government, personal and business arrearages.

Granted that Barack Obama and a tiny remnant of gullible far-left loyalists have devised numerous excuses as justification for this atrocity, one way of accurately measuring the validity of such subterfuge is to simply compare the ratio of per capita National Debt to GDP over the last half-century. After all, it was Barack Obama who said of supply-side economics, a theory which has been deployed during most of the 1960’s through 2007, “We tried this trickle-down fairy dust before, and guess what — it didn’t work then, it won’t work now… It’s not a plan to lower the deficit…” Well, let us test this hypothesis on a relative basis, and see just how well his loot-and-plunder theory stacks up.

A quick study of the chart above, Per Capita National Debt to GDP: 1960 through June 2012, tells the whole story.

Testing Obama’s Theory

  1. At the end of 1960 per capita National Debt to GDP was equal to 54.4%.

  2. John F. Kennedy’s Tax Reduction Act of 1964 was signed into Law by his successor Lyndon B. Johnson. Under the ensuing era of lower tax rates, by the end of 1981, per capita National Debt to GDP declined all the way to 31.9%.

  3. Ronald W. Reagan’s Economic Recovery Tax Act went into effect in 1982, and even though government spending was higher than he would have liked, by the end of his term in 1988, per capita National Debt to GDP stood at just 51.0%.

  4. In 1993, Bill Clinton signed the Deficit Reduction Act, which turned out to be nothing more than a tax hike. By the end of 1996, per capita National Debt to GDP had increased to 66.7%.

  5. Then in 1997 the Republican-led Congress passed a tax-relief and deficit-reduction bill that was resisted but ultimately signed by President Clinton. One of the things the 1997 bill did was lower the capital gains tax. It was actually the 1997 tax cut, not the 1993 Clinton tax hike, which produced the boom of the 1990’s. By the end of the year 2000, per capita National Debt to GDP declined to 57.0%.

  6. In 2001, George W. Bush signed the Economic Growth and Tax Relief Reconciliation Act. By the end of 2001, per capita National Debt to GDP decreased to 56.5%, and later increased slightly to 58.5% in 2002.

  7. The following year, George W. Bush signed the Jobs and Growth Tax Relief Reconciliation Act of 2003, which provided the tax rates in effect today. By the end of 2007, per capita National Debt to GDP held at just 64.2%.

  8. In 2009, Barack H. Obama signed the American Recovery and Reinvestment Act (ARRA). The primary objective for ARRA was to save and create jobs almost immediately. Secondary objectives were to provide temporary relief programs for those most impacted by the recession and invest in infrastructure, education, health, and ‘green’ energy. The cost of the economic stimulus package was estimated to be $787 billion at the time of passage, but was later revised to $831 billion. By the end of 2009, per capita National Debt to GDP increased to 85.2%.

  9. The following year, Barack H. Obama signed the Tax Relief, Unemployment Insurance Reauthorization, and Job Creation Act of 2010, which extended long-term unemployment benefits and cut the employee’s portion of the Social Security payroll taxes by 2.0%. By the end of 2010, per capita National Debt to GDP increased to 93.5%. By the end of 2011 the ratio had increased to 101.0%, and by June 30, 2012, per capita National Debt to GDP notched up by another seven tenths of a percent to 101.7%.

Ever since Barack Obama implemented his plan, America’s standard of living has gone straight down the tubes. And since he said, “We tried our plan, and it worked…,” we are forced to conclude that his goal was to destroy America’s standard of living. If for some reason this wasn’t his goal, then a more honest assessment would have been, ‘We tried our plan, and it failed.’

When Barack Obama said, “We tried this trickle-down fairy dust before. And guess what — it didn’t work then, it won’t work now… It’s not a plan to lower the deficit..,” whose policies could he possibly have been referring to? A quick study of U.S. per capita National Debt to GDP ratios and per capita Personal Income to National Debt over the last 50 years leads to only one possible conclusion – his own.

Conclusion

Since per capita National Debt to GDP is at the highest ratio since the unsustainable heights attained during the second World War, and higher than at any time in the last half-century, and since Barack Obama has clocked the highest annual budget deficits in American history ($1,412.7 billion in 2009, $1,293.5 billion in 2010, $1,299.6 billion in 2011, and $1,326.9 billion in 2012), we can only conclude that his loot-and-plunder economic theory has achieved the worst results of any set of economic policies deployed by any American president, ever. The facts speak for themselves.

We tried Barack Obama’s loot-and-plunder theory, and it failed. And not only have Obama’s policies failed, but American’s are now worse off than at any time since the 1940’s. No one has managed our economy more recklessly than Barack H. Obama. Are you still a believer? Isn’t it high time we go back to what we know works, make some improvements, and implement some of the reforms proposed over the years, which were errantly pushed aside? Yes it’s time. And since Barack Obama has proved himself unwilling to bend to the will of the American people, it’s time we gave someone else the opportunity. It’s time to switch teams. It’s time to follow real leadership. It’s time to elect a true Conservative.

References:

Table 7.1 Selected Per Capita Product and Income Series in Current and Chained Dollars | Bureau of Economic Analysis

Debt to the Penny | Treasury Direct

Chart Data | Google Drive

Talk about Fairy Dust and Snake Oil!

:: Obama’s Loot-and-Plunder Theory on Social Benefits

– By: Larry Walker, Jr.-

Under Barack Obama’s economic theory, better known as Loot-and-Plunder Economics, income tax rates will necessarily skyrocket, perhaps by as much as 50% across-the-board. If you don’t believe it, just look at the facts and figures. For example, as of FY 2011, annual outlays on Social Security Benefits were 77.7% greater than they were in 2001, while outlays on Medicare were 148.8% greater (shown in current dollars in the chart above). Has Obama solved the problem through entitlement reform? Has he raised Social Security and Medicare taxes by 77.7% and 148.8% respectively? No, so what do you think is coming?

While Obama talks the talk, regarding taxing the rich and fairness, surely even he knows that his plan is not sustainable. It doesn’t balance the budget or grow the economy. The truth is that Obama has no plans for lowering income tax rates on the middle-class, but instead he created Obamacare, which is a nifty way of imposing a whole new set of taxes on those who can least afford health insurance, namely the middle-class. Got it? There will be no middle-class tax relief in a second Obama term, just new health care taxes (i.e. more pain).

So other than leading us all to the edge of a Fiscal Cliff, what else has Obama done for the middle-class? Well, he delivered a two-year Make Work Pay Credit (MWPC), which represented a $400 to $800 reduction in Social Security Taxes in 2009 and 2010, and followed this up with a two-year 2.0% Social Security Tax Cut. In other words, he gave us four years of temporary measures in an effort to stimulate the economy. But what did this really accomplish?

Two Things

#1 – The jobs deficit has grown to 11,760,000 under Obama’s watch, from 5,165,000 when Bush turned over the keys. So we can state without ambiguity that his attempts to stimulate the economy have failed. Sure, things might not be as bad as they could have been, but at the same time, things might not be as good as they could have been either.

The “jobs deficit” increases every month that employers create fewer than 127,000 jobs, the number needed to keep pace with population growth. As you can see in the chart below, the jobs deficit has increased under Obama’s watch, and has remained virtually unchanged since December of 2009. Aside from the jobs deficit, we are still 4,648,000 jobs short of where we were in December of 2007, partially due to the Great Recession, which ended in June of 2009, but namely due to Barack Obama’s loot-and-plunder economic policies, which were designed to prolong the crisis.

#2 – Not only has the unemployment rate remained above 8.0% for his entire term, but Obama’s ingeniously designed Social Security tax cuts have since created a $500 billion per year shortfall in the Social Insurance Fund accounts. Per the chart below, derived from the Bureau of Economic Analysis, Table 3.14 – Government Social Insurance Funds Current Receipts and Expenditures, the gap between Social Insurance receipts and expenditures is now worse than ever, thanks to Obama. I guess we’ll find out whether or not work pays (i.e. the MWPC), a few years from now, when we discover that our Social Security and Medicare guarantees were squandered away during the Obama years. His looting of an additional $716 billion out of Medicare to fund Obamacare should be le coup de grâce (the final blow).

As you can see in the chart above, the point of no return was actually breached in FY 2001, when Outlays for Social Benefits equaled Insurance Contributions. This was primarily due to an escalation in the number of baby-boomers reaching retirement age. But instead of addressing the obvious dilemma, the federal government allowed it to fester into larger and larger annual deficits. Thus, the “Social Benefits Deficit” eventually reached $177 billion by Fiscal Year 2008. Then along came Obama, who instead of addressing the problem has handed out four consecutive years of Social Security Tax cuts (i.e. loot-and-plunder fairy dust).

In just three years Obama turned a $177 billion annual Social Benefits Deficit into a $500 billion per year morass. Free money! Obamabucks! What were the results? As you can see in the chart above, and in the related table, in Fiscal Year 2009 the gap between Government Social Benefit Expenditures and Contributions swelled to $376 billion, from $177 billion in 2008, or by 112.4%. Those were the consequences of giving both taxpayers and non-taxpayers a reduction in their Social Insurance responsibilities via the MWPC. In Fiscal Year 2010, with the extension of MWPC, the Social Benefits Deficit widened to $411 billion, or by another 9.3%.

As if that wasn’t enough, Obama devised an even more cunning way of plundering America’s future retirement security. Replacing MWPC with his 2.0% Payroll Tax Cut, in 2011, caused the Social Benefits Deficit to widen by an additional 21.4%, to $499 billion. That’s a half-a-trillion dollar shortfall. And it’s not over yet. Since the 2.0% Payroll Tax Cut was extended into 2012, we will find out where Social Insurance Benefits stand, at the close of the fiscal year, on September 30th. But so far, when added together, $376 billion in 2009, $411 billion in 2010, and $499 billion in 2011, equals a total Social Benefits Deficit of $1.3 trillion. That’s the amount Obama has added to the national debt by tampering with our future retirement security, and that’s just a fraction of the $5.3 trillion he’s added to the overall debt.

Summary:

Between FY 2001 and 2008, Contributions for Government Social Insurance grew by 39.3%, while Social Benefit Expenditures grew by 73.6%. But instead of raising a red flag and solving the problem, Barack Obama proceeded to loot-and-plunder contributions, at a time when the demand for benefits was soaring. This was an amateurish move. Between FY 2009 and 2011, Contributions for Government Social Insurance actually shrank by -6.9%, while Social Benefit Expenditures rose by 22.1%, creating a $1.3 trillion shortfall.

So while gullible far-left loyalists continue to fall for Obama’s pretense, that the Romney-Ryan Ticket and Supply-Side economics would gut Social Security and Medicare, if they took five minutes to look up the facts, they would discover that Obama, through his own brand of loot-and-plunder fairy dust, has already beat them to it. The snake oil Obama is pushing is the same stuff that prolonged the Great Depression. Everyone knows that the federal government didn’t end the Depression, World War II did. That is everyone except for Obama, the unlearned and a few far-left loons.

What folks should be engaged in is bipartisan criticism of the manner in which Barack Obama is destroying our future economic security. We should at least be able to agree that there has to be a more viable alternative. Supply-side economics worked in the Roaring 20’s under Coolidge, in the 1960’s under JFK, in the 1980’s under Reagan, and in the 1990’s through 2007 under Clinton and Bush. That’s right! But according to Barack Obama, “It never worked.” Don’t believe that lie. A quick glance at the following chart, Net Federal Outlays and Receipts since 1980, says it all. Trillion dollar annual deficits are a phenomenon which began with Obama.

Lest we forget, Bill Clinton’s famed tax plan was a package which included tax rates ranging from 15% to 39.6% (i.e. rates were higher at all levels across-the-board), in addition to the Republican-led Tax-Relief and Deficit-Reduction Bill of 1997 (i.e. what actually created the boom of the 90’s). But if you think Obama can cherry-pick just one smidgen of Clinton’s tax policies, apply it to only a fraction of taxpayers, those making more than $250,000 (the equivalent of $157,197 in 1993), and achieve the same results, then you’re not using your brain.

Loot-and-Plunder economics ends when everyone sees their taxes rise by 50% or more across-the-board. That’s the only way the federal government can continue to spend at current levels, and move even halfway towards balancing its budget. When you see the symptoms of a failed economic policy (above), and your candidate boasts, “My plan worked,” that’s when you run!

—————————–

Notes:

The third chart (above) purposefully excludes interest contributed towards Social Insurance, since such interest is paid from general government funds. The federal government long ago raided the Social Security Trust Fund spending every dime, and now owes the Social Security Trust Fund $2.5 trillion, per Note 24 of the United States Government’s Notes to the Financial Statements, for the year ended September 30, 2011. From time to time, the federal government pays the Trust Fund interest on its debt, but with trillion dollar deficits for the last four years, it is reasonable to conclude that every dime of the interest paid is borrowed, thus it makes no sense to double count. The chart also excludes administrative expenses.

References:

U.S. GAO | Fiscal Year 2011 Financial Report of the United States Government

Bureau of Economic Analysis | Table 3.14 Government Social Insurance Funds Current Receipts and Expenditures

Chart Data | Google Drive

Path to Liberty | Privatization or Back to the Plantation?


“Mr. President, it is natural to man to indulge in the illusions of hope. We are apt to shut our eyes against a painful truth, and listen to the song of that siren till she transforms us into beasts. Is this the part of wise men, engaged in a great and arduous struggle for liberty? Are we disposed to be of the number of those who, having eyes, see not, and, having ears, hear not, the things which so nearly concern their temporal salvation? For my part, whatever anguish of spirit it may cost, I am willing to know the whole truth; to know the worst, and to provide for it.” ~ Patrick Henry

An Accountant Explains Why the U.S. Cannot Balance its Budget

– By: Larry Walker, Jr. –

In following video (link), a former accountant who worked with budgets for over 40 years clearly explains the U.S. budget dilemma. After reviewing the facts contained therein, it should be evident that there are only two possible solutions for the survival of the United States: (1) raise taxes by 50% across the board or, (2) lower taxes and privatize entitlement programs.

Raising taxes leads to a smaller economy and larger government, with the need to eventually raise taxes again at some point. On the other hand, lowering taxes while privatizing entitlement programs leads to a larger economy and less government. Although the latter will cause some pain in the initial years, the affliction will be faced either way. However, privatization is the only path leading to the long-term sustainability of a free Republic.

While some would conclude that the solution involves a combination of increasing tax rates while cutting entitlement programs, I believe the two are mutually exclusive. That is to say, raising taxes reduces the size of the economy leading to the need for even more entitlements. Raising taxes also narrows the tax base leading to less government revenue. On the other hand, privatization requires lowering income tax rates to enable entitlement programs to go private. Cutting taxes also leads to a larger private economy, a broader tax base and increased government revenues. So the latter leads to greater economic independence for free citizens, and less reliance on government programs. This should be the goal for a free society.

Our freedoms may only be sustained by lowering income tax rates in conjunction with privatization of the major entitlement programs (i.e. Social Security, and Medicare). Although some painful days will occur during the initial years of conversion, in which the government must meet its past commitments while transitioning younger workers towards privatization, it is important to note that, “Every time in this century we’ve lowered the tax rates across the board, on employment, on saving, investment and risk-taking in this economy, revenues went up, not down.” Thus reducing income tax rates will actually increase, not decrease, federal revenues during the transition. Therefore, the tax cuts that I am speaking of should be across the board and immediate, as should the transition towards privatization.

There are really only two choices, (1) a larger private economy based on free-market principles and self-reliance, or (2) an ever increasing and invasive federal government with greater dependence on its ability to collect taxes from a shrinking base of those able to pay. The policies implemented today will determine America’s future. The alternatives are clear – live free, or become a ward of the State. There are no laurels to rest upon. Either you favor exercising your God-given right to freedom, or returning to slavery. The decision is yours. As for me, I choose freedom, by any means necessary.

“The day that the black man takes an uncompromising step and realizes that he’s within his rights, when his own freedom is being jeopardized, to use any means necessary to bring about his freedom or put a halt to that injustice, I don’t think he’ll be by himself.” ~ Malcolm X

Photo Credit: English Exercises

See Related:

Obsolete Government Programs, Part 1 | FICA – Apr 20, 2011

If we were not forced to pay this mandatory tax of 6.2% (12.4% for the self-employed) on earned income up to the limit of $106,800, we would be able to save a greater portion of our own money into the modern retirement…

Obsolete Government Programs, Part 2 | Medicare – Apr 21, 2011

Medicare is partially financed through payroll taxes imposed by the Federal Insurance Contributions Act (FICA) and the Self-Employment Contributions Act of 1954. In the case of employees, the tax is equal to 2.9% (1.45%…

Social Security: A Breach of Trust – Jan 09, 2011

As I explained in “The Social Security Bust Fund”, the federal government has summarily confiscated and spent every dime of the $2.6 trillion surplus, which would have comprised the Social Security Trust Fund, and has…

Unequally Yoked | Social Security and the Working Class – May 07, 2011

Did you know that most state and local government employees are exempt from Social Security taxes? Millions of Americans who are covered by state or local retirement plans do not pay into the Social Security system.

The Social Security Bust Fund – Jan 03, 2011

In other words, the Treasury pays interest to the Social Security Trust Fund, but not in the form of cash, rather in the form of additional special-issue securities. (Huh?) Interest is only physically paid out when money is needed…

What Does $40 per Week Mean To You?

– Let’s see, to me one thing it means is that the federal government will be adding another $120 billion to the national debt. For my friend Jeff, at Liberty Works, it means – we’ve been bamboozled again. –

By: BoomerJeff | Liberty Works

“… On Thursday Obama ramped up the theatrics and gave us a preview of his New Year strategy for diverting attention away from his manifest failures. He stepped to the microphones to prove he identifies with the struggles of the helpless against those cruel Republican Scrooges (transcript). His tone dripping with pious solicitude, he began:

We’ve been doing everything we can to make sure that 160 million working Americans aren’t hit with a Holiday tax increase on January First…If you’re a family making about $50,000 a year this is a tax cut that amounts to about a thousand dollars a year. That’s about forty bucks out of every paycheck.

So far the President’s math is correct, since most employees are paid either bi-weekly or semi-monthly.

It may be that there are some folks in the House who refuse to vote for this compromise because they don’t think forty bucks is a lot of money. But anyone who knows what it’s like to stretch a budget knows that at the end of the week or the end of the month forty dollars can make all the difference in the world…

So on Tuesday we asked folks to tell us what it would be like to lose forty bucks every week.

Wait a minute! “Every week?” He just changed it from $40 out of every paycheck to $40 every week! But the temporary tax cut is worth only $19 every week to his hypothetical $50,000 per year family.

You’d have to earn $104,000 a year for Obama’s Social Security tax markdown to be worth $40 every week.

Obama then quoted some of the emails from his “folks” about how they would deal with the loss of $40 per week.

Joseph from New Jersey would have to sacrifice the occasional pizza night with his daughters. My 16 year old twins will be out of the house soon – I’ll miss this.

Richard from Rhode Island wrote to tell us that having an extra $40 in his check buys enough heating oil to keep his family warm for three nights. In his words, and I’m quoting, If someone doesn’t think that 12 gallons of heating oil is important invite them to spend three nights in an unheated home.

Pete from Wisconsin told us about driving more than 200 miles each week to keep his father in law company in a nursing home. $40 out of his paycheck would mean that he could only make three trips instead of four.

Dinner out for child who’s home for Christmas, a pair of shoes – these are the things that are at stake for millions of Americans. They matter a lot.

Obviously these emails are absurd. If you earn $104,000 and have to give up $40 per week, are you really going to have to deny your kids a pizza or a pair of shoes? Will you shiver for three nights without heating oil?

Of course, there are some folks to whom $40 every week would be make a real difference:

  • A hotel maid who works full time for $8.50 per hour

  • A construction worker who has been cut back to half time work at $17 per hour

  • A self employed business owner whose customers were hammered by the recession and now barely survives by depleting his savings. He generated only $17,700 profit this year after paying his employees and the employer’s half of the payroll tax which was not reduced by the Obama payroll tax markdown.

To each of these people Obama’s temporary payroll tax cut is worth not $40 but $6.80 per week.

But much of the media have already begun to help Obama plant a false perception in the minds of uninformed voters that Republicans would deny everyone $40 per week. (For example, see the headline here.)

Obama knows that informed voters will figure out the deception. But he doesn’t care about informed voters. They won’t vote for him anyway.”

Unequally Yoked | Social Security and the Working Class

Liberty?

Public vs. Private Sector Inequities

~ By: Larry Walker, Jr. ~

Did you know that most state and local government employees are exempt from Social Security taxes? Millions of Americans who are covered by state or local retirement plans do not pay into the Social Security system. If Social Security is such a great plan, then why are 17,738,156 [1] state and local government workers exempt? Why does the federal government continue to legally bind the rest of us to a sinking ship? This isn’t 1933 anymore. The time for change is now. Social Security is the biggest fraud in American history.

There is no retreat but in submission and slavery! Our chains are forged! ~ Patrick Henry

Teachers Retirement System of Georgia vs. Social Security

For example, teachers in the state of Georgia are covered by the Teachers Retirement System (TRS). Following are some of the differences between teachers covered by TRS and private sector workers covered by Social Security.

  1. Although Georgia teachers are required to contribute 5.0% of their pay into the TRS, the contribution is considered a pre-tax deduction. Workers covered by Social Security must contribute 6.2% of their pay on an after-tax basis.

  2. Georgia public employers pay a matching contribution of 9.24% into the TRS. Private sector employers pay a 6.2% match to the Social Security Administration (SSA).

  3. TRS contributions are invested in stocks, bonds and other liquid investments earning interest, dividends and the chance for appreciation in value. Social Security contributions are used to pay the benefits of current recipients. Any surplus is borrowed and spent by the federal government which is currently $14.3 trillion in debt.

  4. The normal retirement age for Georgia teachers is 60 years of age. Normal retirement for Social Security recipients is age 65, 66, 67 or greater.

  5. Georgia teachers may retire at any age after 25 years of service. Social Security recipients may not retire until they reach the age of 62 (with reduced benefits).

  6. The amount of benefits received by Georgia teachers is based on the two highest years of compensation. The benefits paid by Social Security are based on the average amount of earnings over a 35 year period.

  7. Georgia teachers become vested in their retirement benefits after 10 years of service. Upon separation from service they may either take a lump-sum distribution or rollover their contributions into an IRA. After the vesting period, Georgia Teachers may also take a lump-sum distribution or rollover the employer contributions into an IRA. Social Security recipients are vested after working 40 quarters, or 10 years, but have no rights to lump-sum distributions or rollovers.

  8. Upon separation of service or retirement, Georgia teachers may either take a lump-sum distribution or rollover their benefits into an IRA account. Georgia teachers may also elect to have their remaining benefits paid to their beneficiaries. Social Security recipients do not have any contractual right to take lump-sum distributions, make rollovers, or to pass benefits on to their heirs.

  9. The maximum amount of annual retirement benefits paid to Georgia teachers is determined by multiplying the average of their top two years’ salary by the number of years of service, and then by 2%. Thus an employee who earned $50,000 in their top two years, with 30 years of service, would receive an annual pension of $30,000 per year, or $2,500 per month [50,000 * (.02 * 30)]. The average amount of benefits paid to Social Security recipients is $14,088 per year, or $1,174 per month. The maximum Social Security benefit for a worker retiring in 2011 is $28,392 or $2,366 per month based on earnings at the maximum taxable amount for every year after the age of 21. The maximum taxable amount of Social Security wages in 2009/2010 is $106,800. [2,3]

Wisconsin Retirement System vs. Social Security

As a second example, teachers in the state of Wisconsin are covered by the Wisconsin Retirement System (WRS). Following are some of the differences between teachers covered by WRS and private sector workers covered by Social Security.

  1. Although Wisconsin teachers are supposed to contribute 5.0% of their pay into the WRS, the contribution is actually paid by their employer (i.e. amounts designated as employee contributions for accounting purposes are actually paid by the employer). [1 (pages 15-17)] WRS employees may also make additional tax deferred contributions to their WRS accounts. Workers covered by Social Security must contribute 6.2% of their pay on an after-tax basis.

  2. Wisconsin public employers pay a matching contribution of 4.5% into the WRS, but since they also pay the employees portion, their total contribution is 9.5%. Private sector employers pay a 6.2% match to the Social Security Administration (SSA).

  3. WRS contributions are invested in stocks, bonds and other liquid investments earning interest, dividends and the chance for appreciation in value. Social Security contributions are used to pay the benefits of current recipients. Any surplus is borrowed and spent by the federal government which is currently $14.3 trillion in debt.

  4. The normal retirement age for Wisconsin teachers is 65 years of age, or 57 with 30 years of service. Normal retirement for Social Security recipients is age 65, 66, 67 or greater.

  5. Wisconsin teachers may retire as early as the age of 55 (with reduced benefits). Social Security recipients may not retire until they reach the age of 62 (with reduced benefits).

  6. The amount of benefits received by Wisconsin teachers is based on an average of the three highest years of compensation. The benefits paid by Social Security are based on the average amount of earnings over a 35 year period.

  7. Wisconsin teachers become vested in their retirement benefits immediately and may either take a lump-sum distribution or rollover the employer contributions into an IRA upon separation. Social Security recipients are vested after working 40 quarters, or 10 years, but have no rights to lump-sum distributions or rollovers.

  8. Upon separation of service or retirement, Wisconsin teachers may either take a lump-sum distribution or rollover their benefits into an IRA account. Wisconsin teachers may also elect to have their remaining benefits paid to their beneficiaries. Social Security recipients do not have any contractual right to take lump-sum distributions, make rollovers, or to pass benefits on to their heirs.

  9. The maximum amount of annual retirement benefits paid to Wisconsin teachers is determined by multiplying the average of their top three years’ salary by the number of years of service, and then by 1.6%. Thus an employee who earned $50,000 in their top three years, with 30 years of service, would receive an annual pension of $24,000 per year, or $2,000 per month [50,000 * (.016 * 30)]. The average amount of benefits paid to Social Security recipients is $14,088 per year, or $1,174 per month. The maximum Social Security benefit for a worker retiring in 2011 is $28,392 or $2,366 per month, based on earnings at the maximum taxable amount for every year after the age of 21. The maximum taxable amount of Social Security wages in 2009/2010 is $106,800. [2,3]

Unequally Yoked

When it comes to retirement, not all Americans are treated equally. State and local government workers have great advantages over private sector employees. Not only does the private sector pay the salaries of state and local government workers through income and property taxes, and not only do we contribute towards their retirement, but we allow them to have better retirement plans than ourselves. As most of us sit, chained to the broken and antiquated Social Security system, state and local government employees continually bargain for more and more. Here are the major inequities in a nutshell.

  • Most state and local government employees contribute less towards their retirement plans than those covered by Social Security but receive back more in benefits. Wisconsin public employees contribute nothing towards their retirement yet receive back more in benefits than comparable working class peons.

  • State and local government employees have portable retirement accounts which actually exist. Americans who are covered by Social Security don’t have any portability of savings, nor have their funds been set aside or invested in any manner.

  • State and local workers have greater options for early retirement based on age and the number of years of service, while Social Security patrons must wait until the age of 62 to receive a reduced amount of benefits.

  • The age of full retirement for those covered by Social Security continues to be pushed back due to the lack of funds, while state and local employees are allowed to quit their jobs and take their savings with them at any time.

  • State and local employees are paid retirement benefits based on an average of their top 2 or 3 years of earnings, while Social Security benefits are calculated using an average of 35 years of earnings.

  • Social Security benefits are limited to $28,392 per year, in 2011, no matter how much is earned in a lifetime. The benefits paid to most state and local plan recipients are for the most part unlimited.

Not all workers in the United States are covered by Social Security, so why don’t the rest of us have a choice? Since state and local retirement plans are required to invest contributions in a fiduciary capacity, why doesn’t Social Security? What makes state and local government employees better than the average American? Wouldn’t privately owned and managed retirement accounts be an improvement for all Americans? It’s time to end Social Security. It’s time for all American workers to be treated equally. The ‘Nanny State’ has failed. The era of big government is over. Give me liberty, or give me death!

Sources:

[1] WISCONSIN LEGISLATIVE COUNCIL – 2006 COMPARATIVE STUDY OF MAJOR PUBLIC EMPLOYEE RETIREMENT SYSTEMS

[2] Social Security Administration – Answers

[3] Your Retirement Benefit: How It Is Figured

Other References:

Teachers Retirement System of Georgia – 2010 Annual Financial Report

Wisconsin Department of Employee Trust Funds – 2009 Annual Financial Report

Wisconsin Retirement System (WRS) Benefit Summary

Links:

Chile's Private Accounts Turn 30 – Investors.com

Bill Baar's West Side: NBC LA: A New Party Within a Party? Labor-Skeptic Democrats