“He might as well have said that his stimulus plan would provide a temporary fix and a temporary economic recovery, which may have to be repeated over and over again to provide the impression that we are getting somewhere, even if we are really just going broke.”
* By: Larry Walker, Jr. *
The Great Recession lasted for a total of 19 months, beginning in December 2007 and ending in June 2009. So the U.S. economy has technically been in a state of recovery for exactly three years. Yet, other than the federal government, which has realized a net gain of 234,300 non-postal employees, since the recession began, the rest of the economy is worse off today than it was on the day Barack Obama was sworn in.
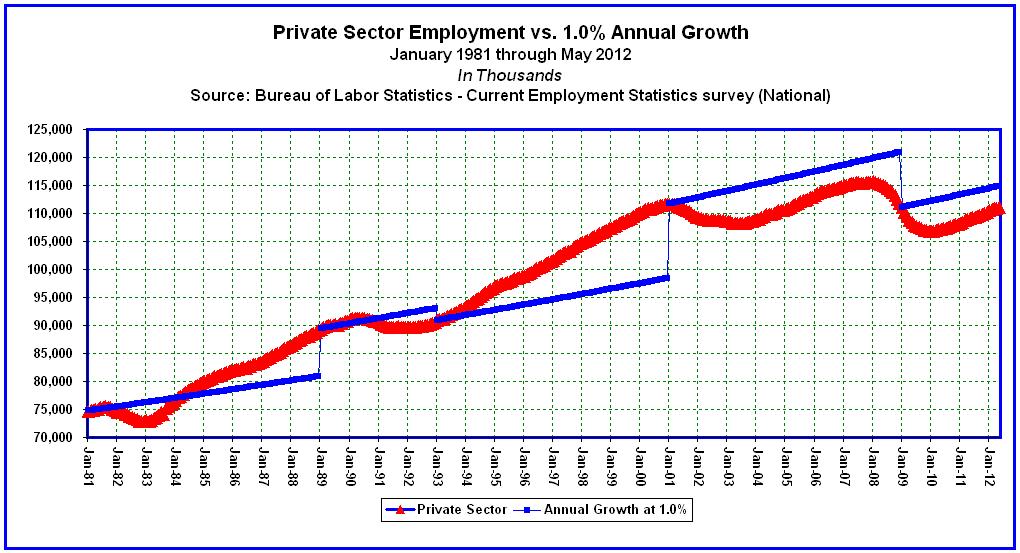
We addressed the Private Sector in Part 1. Today we’ll examine Total Nonfarm Employment, which includes the Private Sector, the Federal government, and State & Local governments, in order to assess our economic progress, since Barack Obama promised to deliver “a new foundation for our lasting economic growth and prosperity”.
Government Sector
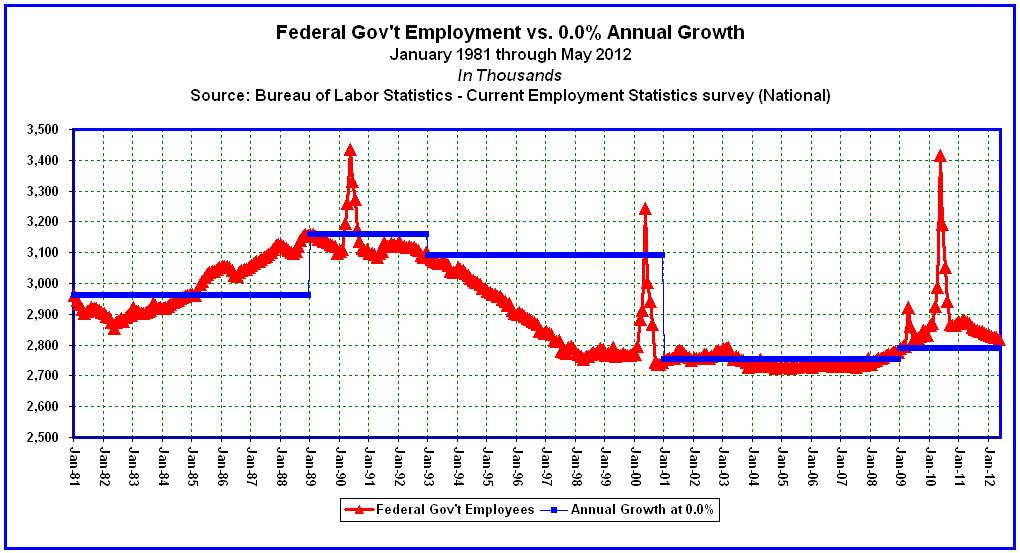
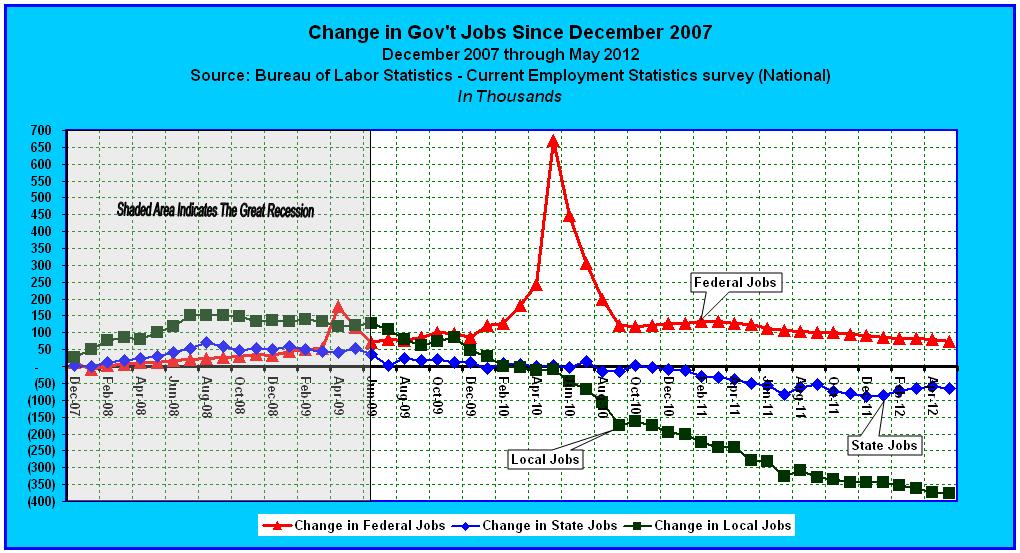
The chart below summarizes the Government employment situation since the start of the Great Recession. The figures come from the Bureau of Labor Statistics, Table B-1 – Establishment Data. The main highlights are outlined below the chart.
-
The number of Federal government employees has increased by +75,000 from December 2007 through May of 2012. The federal government is the only sector of the economy with a net employment gain since the recession began. (Note: The huge spike represents temporary hiring by the U.S. Census Bureau.)
-
Federal jobs grew by +33,000 during the last 13 months of President Bush’s term.
-
Federal jobs have grown by an additional +42,000 during Barack Obama’s 41-month term.
-
Non-postal workers increased by +234,300 [+82,100 during Bush’s last 13 months, and +152,200 during Obama’s 41-month term to-date].
-
Postal workers decreased by -158,500 [-48,500 during Bush’s last 13 months, and -110,000 during Obama’s first 41 months].
-
The number of State government employees has declined by -64,000 since December of 2007.
-
State government jobs actually grew by +52,000 during the last 13 months of President Bush’s term.
-
State government jobs have declined by -116,000 during Obama’s 41-month term to-date.
-
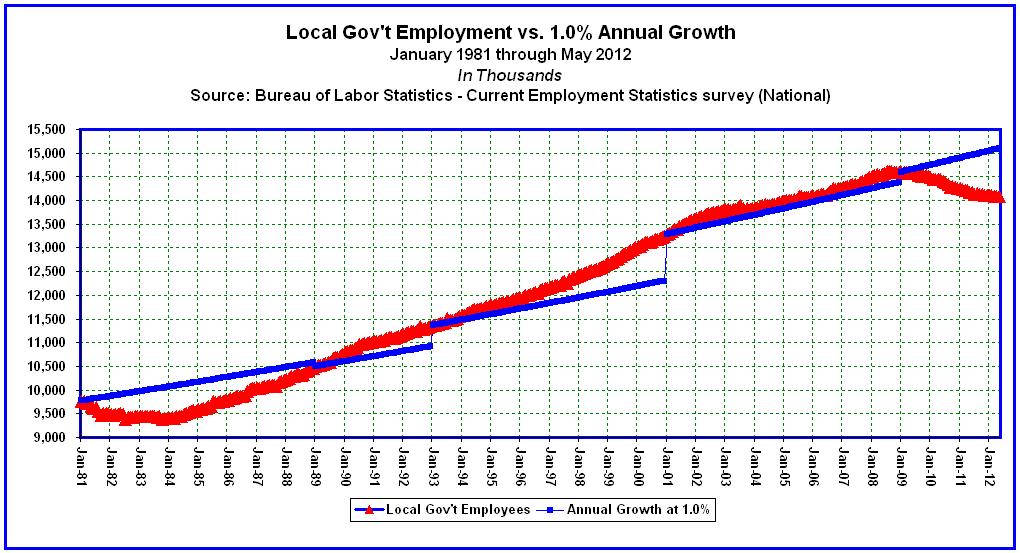
The number of Local government employees has declined by -376,000 since the start of the Great Recession.
-
Local government jobs continued to increase by +136,000 during the last 13 months of President Bush’s term.
-
Local government jobs have since declined by -512,000 under the policies of Barack Obama.
Overall, the Government Sector has suffered a net loss of 365,000 jobs since the start of the Great Recession. But it’s important to note that 221,000 jobs were gained during President Bush’s final 13 months in office, while 586,000 jobs have been lost during Barack Obama’s 41-month term to-date. Digging a little deeper, we find that, since the baton was passed to Obama, 628,000 State and Local government jobs have been lost, while 42,000 Federal jobs were gained. Since government employment did not decline during the 19 months comprising the Great Recession, nor during President Bush’s term, who’s to blame for the decline?
You would think that a decline in the number of State & Local government workers is a good thing, but Barack Obama doesn’t think so. He has thus proffered more government borrowing and spending to fix the alleged problem. But as I pointed out previously, and it’s only common sense, even if the Federal government handed State and Local governments $1.0 trillion to rehire all 628,000 workers, whom they can obviously no longer afford, they will find themselves dumbfounded when the taxpayer funded handout expires.
Thus far, all of Barack Obama’s economic proposals have been temporary fixes, one after another. But the barrage of temporary measures hardly lines up with his 2009 rhetorical promise, that his stimulus plan would ‘lay a new foundation for our lasting economic growth and prosperity’. It’s been three and a half years, and he still doesn’t seem to understand that government stimulus is by its very definition, temporary. He might as well have said that his stimulus plan would provide a temporary fix and a temporary economic recovery, which may have to be repeated over and over again to provide the impression that we are getting somewhere, even if we are really just going broke.
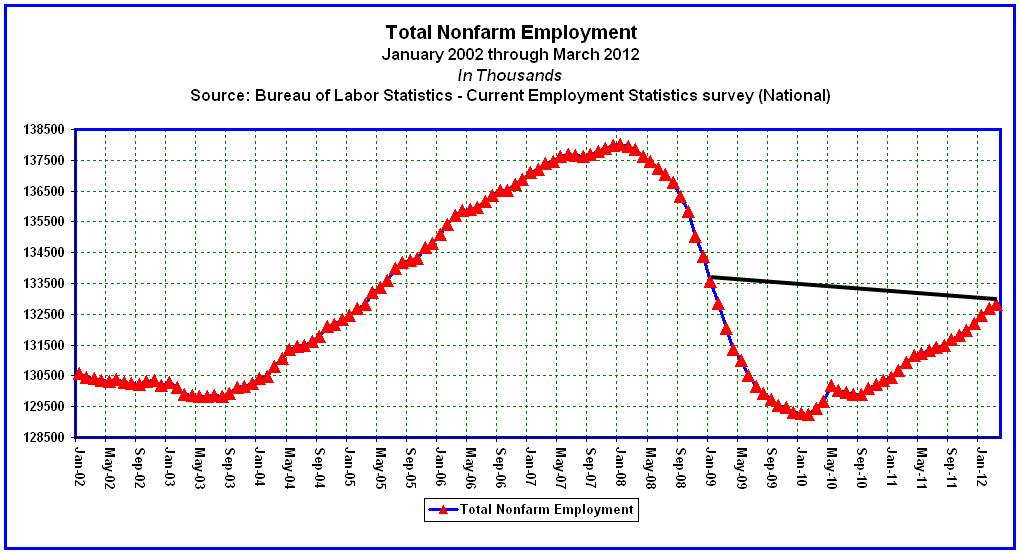
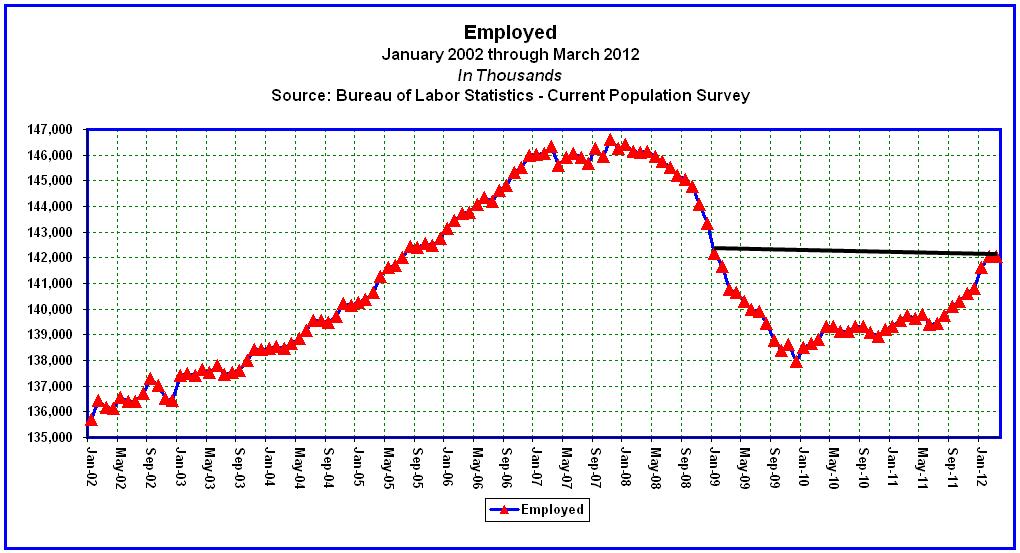
Total Nonfarm Jobs
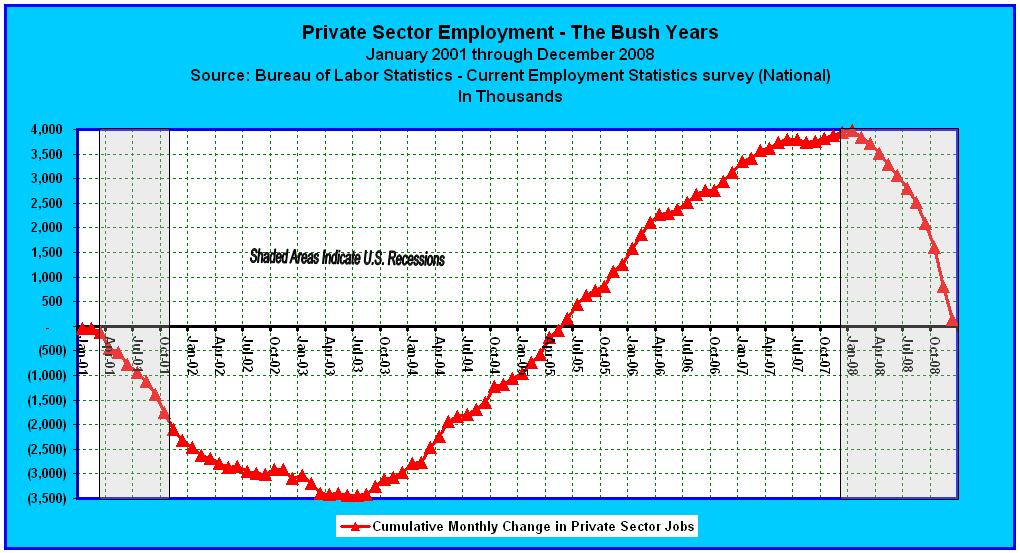
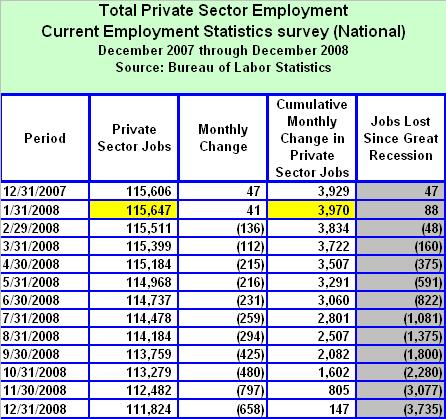
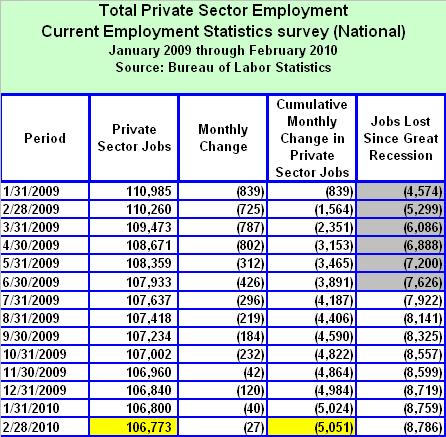
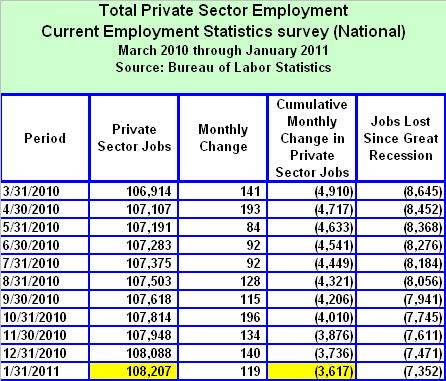
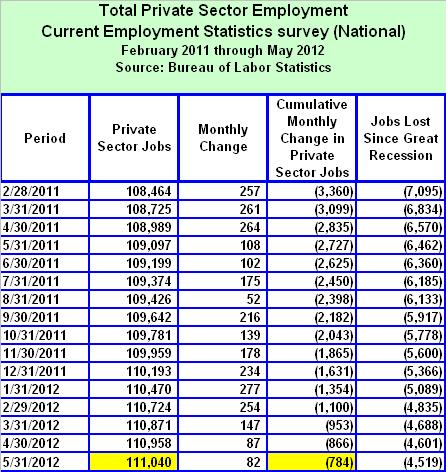
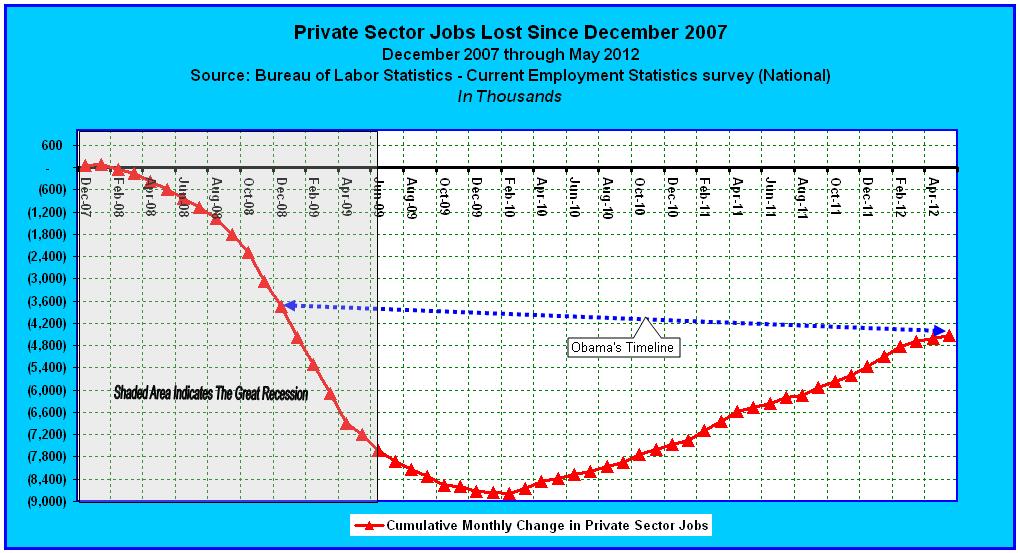
In Part 1, we discovered that a total of 3,735,000 Private Sector jobs were lost during the first 13 months of the Great Recession, and that an additional 784,000 have been lost since Barack Obama promised that his stimulus plan would, ‘save or create more than 3.5 million jobs by January of 2011’. But now, as we factor in the number of government sector jobs gained or lost since the recession began, we discover the following facts.
-
Total Nonfarm jobs declined by 3,514,000 during the last 13 months of President Bush’s term.
-
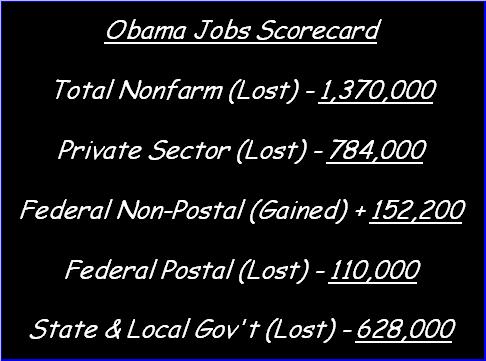
Total Nonfarm jobs have declined by an additional 1,370,000 during Barack Obama’s 41-month term to-date.
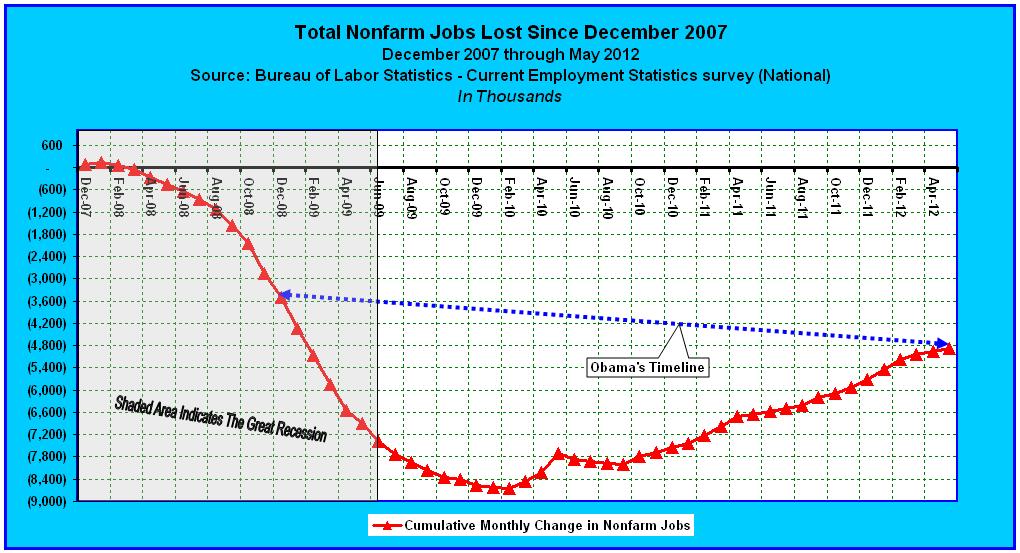
Overall, the U.S. economy has lost a total of 4,884,000 nonfarm jobs since December of 2007. Among them, 1,370,000 have been lost since Barack Obama was sworn into office. So his claim, that we have created 4.3 million jobs over the last 27 months, is wishful thinking. In reality, we lost 5,135,000 nonfarm jobs during his first 14 months in office. Do the math. The facts speak for themselves. And although the Federal government has gained 234,300 new non-postal workers, 152,200 of which are attributable to Mr. Obama, we haven’t created a single net job in the last 54 months. The chart above summarizes where we are statically, but as we shall see, the real employment situation is far worse.
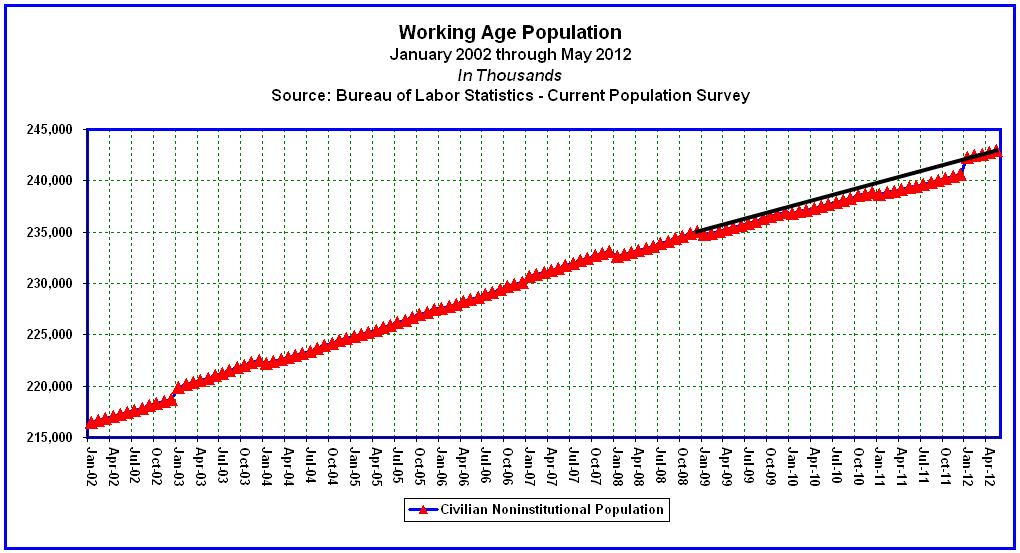
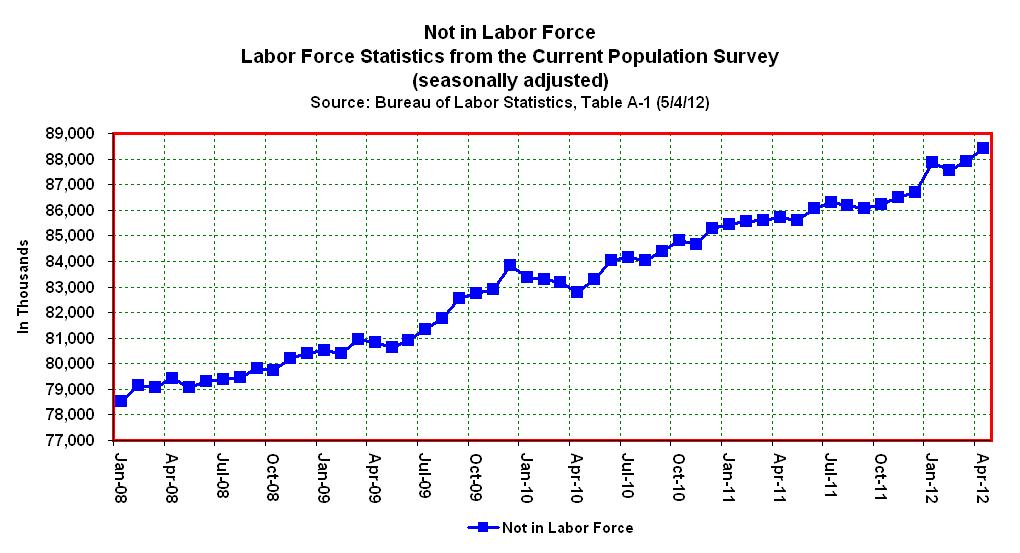
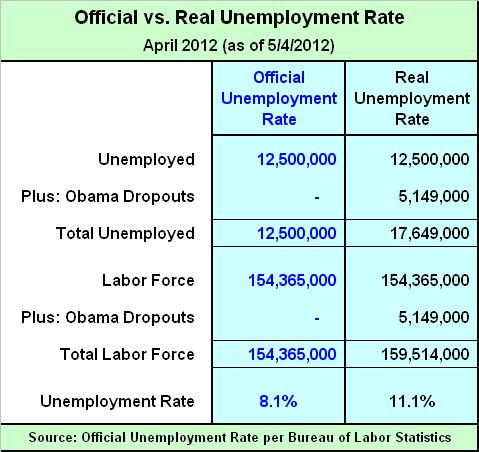
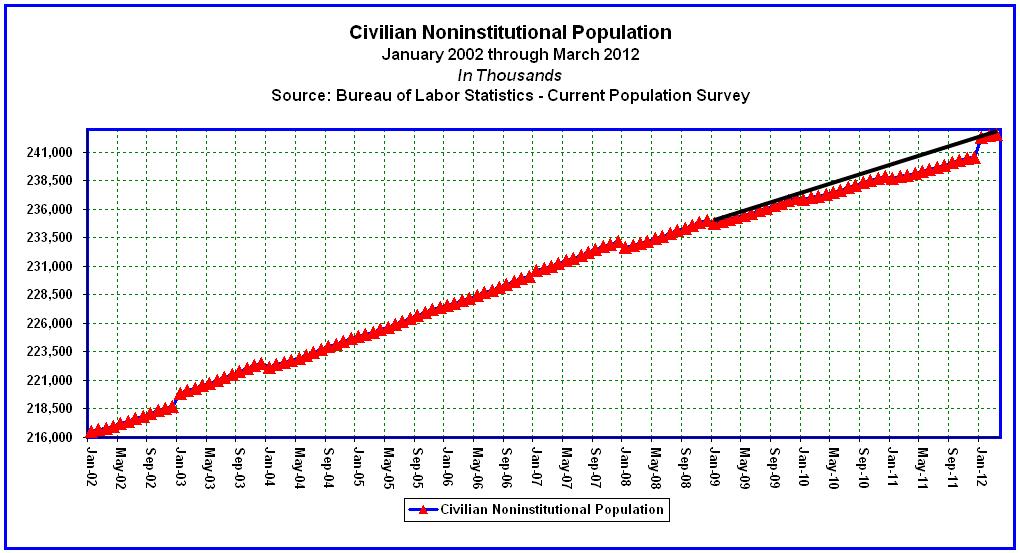
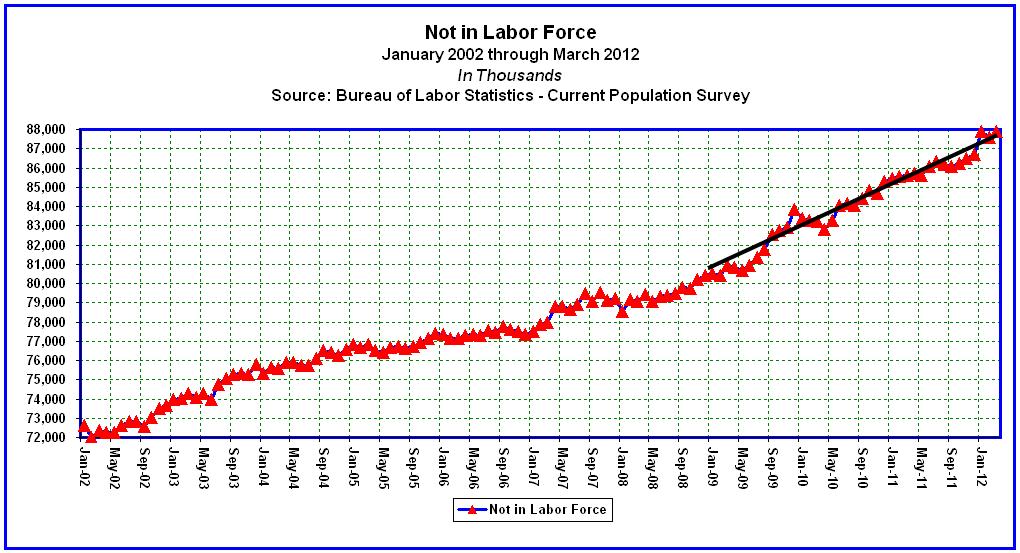
That’s the end of Part 2, but it’s still not the end of the story. In Part 3 we’ll discuss how the increase in the Working-Age Population, since December 2007, in conjunction with a decline in the Labor Force Participation Rate, has made the real employment situation far worse than it appears, placing the American Dream in jeopardy.
To be continued… Obama Jobs Scorecard, Part 3 : The American Dream
Continued from… Obama Jobs Scorecard, Part 1 : The Private Sector